Kansas Geological Survey, Bulletin 5, originally published in 1920
Originally published in 1920 as Kansas Geological Survey Bulletin 5. This is, in general, the original text as published. The information has not been updated.
Dr. Frank Strong, Chancellor of the University of Kansas, ex officio Director of the State Geological Survey:
Sir--The natural gas deposits of Kansas comprise one of the most important of its natural resources. At the present time, when the problem of fuel supply has been acute, it is desirable to learn the conditions under which natural gas is found in the state and to determine as definitely as possible what may be the future supply.
The present report on the Elk City gas field, by C. W. Boughton, describes one of the important gas-producing districts in southeastern Kansas. It will constitute Bulletin 5 of the Reports of the State Geological Survey of Kansas.
Respectfully submitted.
Raymond C. Moore,
State Geologist.
The Elk City gas field is located in T. 31 S., R. 13 E., in the northwest part of Montgomery County and the contiguous portion of southeastern Elk County. It lies midway between the towns of Elk City and Oak Valley. The Winfield branch of the Atchison, Topeka & Santa Fe Railway and the Independence-Winfield automobile highway run through the field.
The field occupies an area of approximately 3 1/2 square miles, the greater portion of which lies in Montgomery County. The productive area is bordered on the east, north, and southwest by wooded hills, 100 to 150 feet high. On the west, Elk River has cut away these hills, and the larger number of the producing wells are on the floodplain of this stream. Two relatively small creeks, which unite a short distance from the river, drain the area from the north.
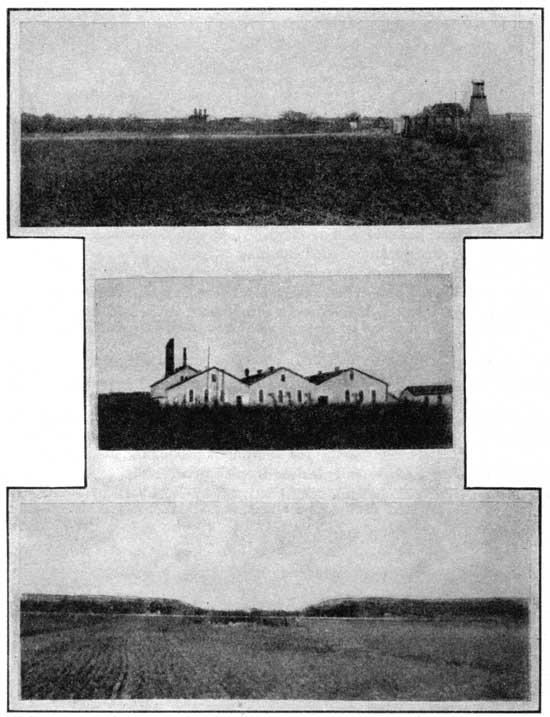
Plate I--Views along the floodplain of Elk River, together with compressor station in sec. 26.
The examination of the Elk City field was made during the month of November 1919, by Chas. W. Boughton and P. C. Murphy. A telescopic alidade and plane table were used in mapping the surface geology and structure, and in securing the elevation of the well locations. The elevations were controlled from a Santa Fe benchmark in the north center of sec. 36. Elevation, 836.2 feet above sea level.
The writer is indebted to Mr. C. A. Blackburn of the Elk Valley Syndicate, and Mr. V. F. Milton of the Southwestern Gas Company, for much of the field data. Such figures as the pressure decline, and a list of the wells, were supplied by Messrs. W. H. Johnson and M. L. Truby of the Southwestern Gas Company at Independence. Messrs. E. M. Stryker, M. D. Stryker, and Lester Stryker, of Fredonia, offered many helpful suggestions and in part supplied the data concerning the Mississippi limestone and other gas fields of this region. The writer is indebted to Mr. D. W. Williams of the York State Oil Company, Caney, for a number of well records and for the vertical section south of the producing area. Appreciation of the direction and suggestions of Dr. R. C. Moore is also expressed.
Figure 1--Detailed vertical section of the rocks exposed in the vicinity of the Elk City gas field.
Douglas Formation--The rocks exposed in the Elk City gas field belong to the Douglas formation, one of the middle divisions of the upper Pennsylvanian in Kansas. Of the four members of this formation, the Weston shale, Iatan limestone, Lawrence shale, and Oread limestone, all but the Oread are exposed in the area under consideration.
The hills surrounding the field are capped with sandstones belonging to the Lawrence shale, which constitutes about one-half of the Douglas formation. The Lawrence shale is about 180 feet thick and is composed of alternating beds of dark-brown sandstone and shale, the amount of the sandstone being about equal to that of the shale. The Lawrence shale has been mapped from northwest Missouri to north-central Oklahoma, and the ratio of sandstone to shale appears to increase rapidly from north to south in southern Kansas.
The Iatan limestone, which was used as a key bed in mapping the Elk City field, lies directly beneath the Lawrence shale. It varies from 4 to 8 feet in thickness, and although covered in many places by slumping of the overlying shale and sandstone, it makes a fairly easily traceable horizon. On fresh fracture the bed is a dark bluish gray, but it weathers to a light-steel color. As a rule, the Iatan is highly fossiliferous, containing many small brachiopods, crinoid stems, some Fusulina, and a considerable amount of vegetable matter.
The Weston shale lies directly below the Iatan limestone and occupies the lower portion of the hillsides and most of the valley floor. This member is composed of various colored shales and brown sandstones, and contains at least one thin limestone bed. The limestone is found about 32 feet below the Iatan, and is quite different from that bed in physical characteristics and fossil content. It is uniformly about 20 inches in thickness, has a dark muddy color, and breaks readily into small irregular-shaped fragments. The contained fossils are for the most part Fusulina, a small number of brachiopods being found. In his sections 3 miles south of the field, Mr. D. W. Williams (personal communication) reports another limestone bed, between the Iatan and the bed which has just been described. This limestone is described as thin, sandy, and rather soft. It was not encountered in the area included in this report.
The Quaternary deposits in the Elk City field are represented by silt, gravel, and sand deposited on the floodplain and in the bed of Elk River. Some of the wells at present situated a quarter of a mile from the river show deposits of sand and gravel 50 feet in thickness, showing that the stream has at times occupied various portions of the valley.
Information concerning the rocks below the surface is derived largely from well records, and in part from observations noted outside of the producing area. About 20 well records and a fairly complete set of sand records were available. The strata between the Iatan bed and the Mississippian limestones in this region vary in thickness from 1,500 to 1,650 feet. The section consists of about three-fourths shale, 15 percent limestone, and the remainder sandstone. (See vertical sections, plate II.)
Lansing Formation--The first limestone below the surface throughout most of the field is the Stanton, which is the uppermost member of the Lansing formation. Its nearest surface outcrop is in the bed of Elk River at Elk City. In this region the Stanton has an average thickness of about 50 feet. It is a light-gray limestone and rather massive, the beds being separated by thin layers of slaty shale. At the city of Fredonia the interval between the Stanton and the Iatan limestone is about 230 feet (Mr. E. M. Stryker, Fredonia, personal communication). Three miles south of the field D. W. Williams found it to be but 128 feet. Within the producing area, the interval varies from 200 to 250 feet. These irregularities indicate either a short period of erosion before the deposition of the succeeding strata, or more probably an irregularity in the deposition of the overlying Weston shale. In any case, the top of the Stanton is, in fact, so irregular that it cannot be used with certainty in determining the probable elevation of the Iatan where the latter has been eroded.
The Vilas shale, which underlies the Stanton limestone, thickens toward the south. At Fredonia, 20 miles to the northeast, it is 5 to 15 feet thick (supplied in part by Mr. E. M. Stryker of Fredonia), while the log of Simmons well No. 1, in the NE sec. 27, shows it to be 50 feet thick. At Longton, 25 miles northwest of the Elk City field, the Vilas shale is over 100 feet thick.
The Plattsburg ("Allen") limestone is a highly crystalline bed, rather massive, and contains a variety of fossils. It breaks easily into small angular fragments. At Fredonia this member is 80 and 90 feet thick (supplied in part by Mr. E. M. Stryker of Fredonia), while the Simmons log shows it to be but 5 feet in thickness.
Kansas City Formation--The thickest limestone encountered in any of the logs lies approximately 450 feet below the surface in the center of the field. Some of the well records show as much as 115 feet of massive limestone. This limestone belongs without doubt to the very calcareous Kansas City formation, and probably represents in large part the Drum limestone, which is known to thicken toward the southwest.
Marmaton Formation--The only bed of importance in the Marmaton, from the standpoint of correlation of the well logs, is the Fort Scott ("Oswego") limestone, which lies about 1,100 feet below the Iatan and consists of an upper member of fairly hard white limestone, 22 to 30 feet thick, and a lower bed of blue limestone, 6 to 12 feet thick, the two being separated by 4 to 10 feet of dark shale. A limestone corresponding in position and character to the Fort Scott is encountered in all the wells of the Elk City field.
Cherokee Shale--Although the Cherokee shale, which constitutes the basal portion of the Pennsylvanian series, contains many beds of economic importance, few of its shale and sandstone beds can be traced from one place to another. Practically all the well records in the Elk City field show a bed of "red-rock" 220 feet or more below the Fort Scott limestone. This is probably a firmly cemented, red-colored shale. It varies in thickness from 6 to 10 feet. Many of the records show two beds of "red-rock," separated by 30 to 40 feet of ordinary shale.
The Mississippian limestone, which has generally been considered the limit of possible production in eastern Kansas, has been encountered in a number of wells in this immediate region. (See figure 3.) A typical log, showing the upper part of the Mississippian in the Elk City field, is as follows (supplied in part by Mr. E. M. Stryker of Fredonia):
| Drill record of the upper part of the Mississippian in the Elk City district | |
|---|---|
| 1 ft. | Blue limestone, in some cases chert. |
| 1-3 ft. | Blue shale. |
| 20-30 ft. | Hard gray limestone. |
| 10-25 ft. | Soft porous limestone. |
| 20-35 ft. | White sandstone, containing water, and in some cases gas. |
Wayside Sand--Well logs in the Elk City field show three persistent sandstone horizons. The uppermost of these sands is about 30 feet thick and was encountered at 747 feet in the discovery well. (Simmons No. 1.) In the logs of a few wells this sand has been classified as the Wayside, which is fairly productive about the town of Wayside, 20 miles to the south. For many years wells in this region extended only to this sand, and it was not until the Simmons well was drilled into the deeper gas-bearing sands that it was thought worth-while to drill deeper in other parts of the field. A number of small oil wells in secs. 34 and 35 apparently secure their production from this shallow sand.
Weiser Sand--Between 70 and 90 feet below the Wayside the records show a second sand, to which the name Weiser has been applied. This sand is rather uniformly 40 feet in thickness and thus far is unproductive in this field. It is possible that this sand corresponds to the Peru sand of Chautauqua County, as both are found at practically the same depth below the Wayside. Mr. E. H. Klinefelter, of the Hale Gas Company, reports that this sand is in all probability the equivalent of the Peru sand, but on account of uncertainty as to this at first, the sand was named after an operator, Mr. Weiser, who first encountered it in Montgomery County.
Bartlesville Sand--The gas sand in the Elk City field lies about 1,350 feet below the surface in the central part of the field. It is known to be at least 24 feet thick, as some of the wells have drilled into it that far. The smallest producing gas well in the field, in the NW NE sec. 23, drilled through 24 feet of sand and into the Mississippian limestone, so it is possible that wells in the center of the producing area draw from as much as 30 or possibly 40 feet of sand. The sand appears to be uniform in texture and composed of round, medium-sized grains. The interval between the top of the gas sand and the Fort Scott limestone varies from 319 to 370 feet. (See figure 4.) Considering this interval, the sand appears to be in the horizon of the Bartlesville sand, which is so highly productive in northeastern Oklahoma. On the other hand, the well mentioned above, which drilled through the sand into the Mississippian, found but 2 feet of black shale between the base of the producing gas sand and the top of the Mississippian limestone, which would correspond to the position of the Burgess sand. Along the southern border of Montgomery County, the Bartlesville sand is known to be about 100 feet above the Mississippian, while the Burgess lies directly upon the limestone. A study of the log of Lewis No. 1, mentioned above, shows but 375 feet of Cherokee shale between the Fort Scott and Mississippian limestones, while the log of Spaht No. 1 (in the SE corner sec. 24) shows 455 feet of shale. For this reason, it is believed that the producing gas sand in the Elk City field should be correlated with the Bartlesville.
Other Sandstones--The sand found in Spaht No. 1 lies directly upon the Mississippian. It is approximately 435 feet below the top of the Fort Scott limestone, and 35 feet below the horizon of the Bartlesville sand. A fifth sandstone horizon exists a few feet above the Fort Scott, while a sixth is found directly below this limestone. Neither of these sands is persistent, or has been found to contain commercial deposits of oil or gas. Both vary considerably in thickness.
The terms Wayside, Weiser, Bartlesville, and Burgess are applied to sandstones within certain horizons, and although they may be of approximately the same age it is highly improbable that they represent one continuous sand body.
The structure of the surface formations in the Elk City gas field is graphically indicated on plate II by means of 10-foot contours, which show the elevation of the Iatan limestone above sea level. It may be noted that the surface in general dips to the west about 35 feet in a mile. Superimposed on this broad monocline are two small domes, each with a relief of approximately 20 feet. The smaller of these domes is located in the north-center of sec. 23, while the larger covers the southeast quarter of the same section.
Plate II--Structure and production map of the Elk City gas field. [A larger version of the figure is available as an Acrobat PDF file.]
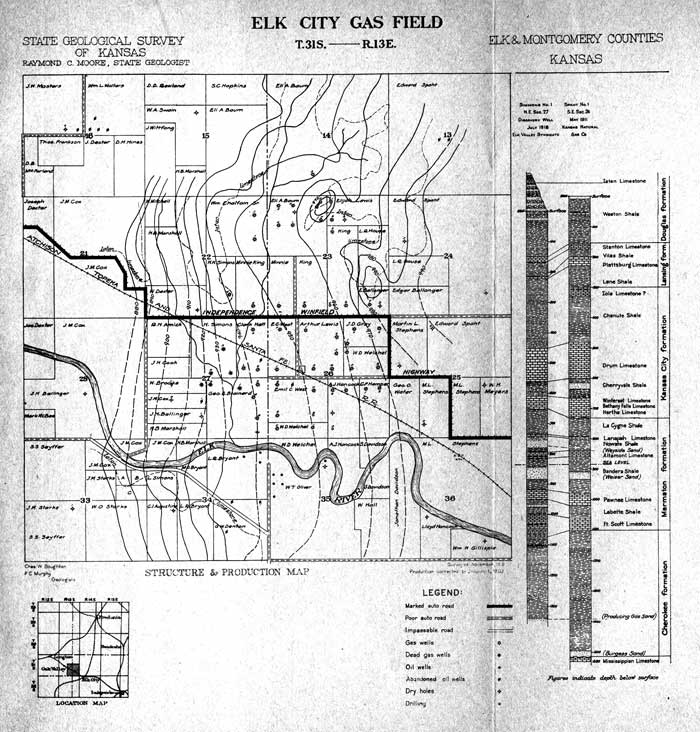
The Iatan limestone has been eroded away from the southeastern and central parts of the Elk City field, and on account of the uncertain interval between the Iatan and Stanton limestone in this area, the latter cannot be used with certainty in determining the probable elevation of the Iatan. However, a study of well records from secs. 23, 24, 25, and 26 shows approximately 25 feet of east dip on the Stanton, Drum, and Fort Scott limestone. (See cross section on plate III.) This east dip extends from the vicinity of the surface domes to the east side of sec. 24.
Plate III--Structure map of the producing gas sand in the Elk City field. [A larger version of the figure is available as an Acrobat PDF file.]
Contours for plate III, which shows the depth of the top of the Bartlesville gas sand below sea level, were determined by comparing the elevation of the mouth of the wells with their sand records. This map shows that the highest part of the sand lies in secs. 23 and 26, and that the dip is to the south and west, somewhat the same as that of the surface formations. It is to be noted that the structure of the sand coincides with that of the subsurface formations, as shown in the cross section.
According to the anticlinal theory, wells of largest capacity might be anticipated near the crest of such structures as shown on plate II. Figure 2 shows the combined open-flow capacity and the average capacity of the gas wells in each quarter section, and demonstrates that the wells of largest capacity are considerably downdip from these two small domes. By comparing figure 2 and plate II, it may be noted that there is also little relation between the structure of the gas sand and the average capacity of the wells. Indeed, the wells of smallest capacity are found slightly east of the highest part of the producing sand. We must conclude that the texture and porosity of the sand are very important factors governing production.
Figure 2--Map showing the total and average initial open flow capacity of the gas wells in each quarter section.
The depth of the Mississippian limestone below sea level, as reported in 11 wells in the Elk City field, is shown on figure 3. It is apparent that the Mississippian is 113 feet higher in sec. 23 than in the SE corner sec. 24, a mile to the east. With the data at hand, it is impossible to determine whether these high points of the Mississippian represent an erosional outlier or the crest of a small but rather pronounced fold. The cross section shows that the highest part of the Mississippian directly underlies the crest of the apparent folding in the Pennsylvanian strata. It is apparent that folding during Pennsylvanian time would affect the Mississippian strata, so at this time the exact structure of the Mississippian cannot be determined. This marked difference in the surface of the Mississippian limestone may be due to pre-Pennsylvanian erosion, to folding during late Mississippian time, or to both. There is between 70 and 80 feet more Cherokee shale in the SE corner sec. 24 than on top of the limestone, which indicates that the irregularity in the surface of the Mississippian existed before Pennsylvanian time.
Figure 3--Skeleton map showing the depth of the Mississippian limestone below sea level. Contour interval is 20 feet.
It has been suggested that the apparent folding in the Pennsylvanian strata is the result of deposition over this Mississippian irregularity, but it hardly seems likely that a topographic dome could be reflected through 1,500 feet of sediments without considerable variation in the thickness of the Pennsylvanian strata.
It is interesting to note, as shown by the lines of equal thickness (isopachous contours) for the strata between the Fort Scott limestone and the top of the producing sand, that a marked convergence of the beds exists (figure 4). In general, the convergence of these beds is toward the N center sec. 26. On the other hand, a study of the strata between the Iatan and Fort Scott limestones shows a convergence toward the NW corner sec. 23.
Figure 4--Isopachous contour map showing the thickness of the strata between the Fort Scott limestone and the top of the producing gas sand. Contour interval is 10 feet.
The first gas well in the Elk City field was drilled July 12, 1918, by the Elk Valley Syndicate on the Simmons farm in the NE sec. 27. The original open-flow capacity was 10,000,000 cubic feet. Previous to that date a number of wells had secured a small production of oil from the Wayside sand at a depth of 750 to 800 feet. In the spring of 1911 the Kansas Natural Gas Company drilled a deep test on the Spaht ranch, near the SE corner sec. 24, and found 20 feet of dry sand. The second gas well in the field was drilled in August 5, 1918, on the Simmons land, 800 feet west of the discovery well. It is reported that almost immediately after the drill touched the sand, the gas broke through with a roar that could be heard several miles. The original volume of this well was 32,000,000 cubic feet, and the pressure was so great that the well was not shut in for nearly a week, and only then with considerable difficulty. Efforts to cap the well were futile, and the gas was mudded in by means of mud pumps (Oil and Gas Journal, November 21, 1919, p. 80).
Plate IV--West No. 5 immediately after touching the gas sand, showing the effect of the rock pressure. (Courtesy of Southwestern Gas Company.)
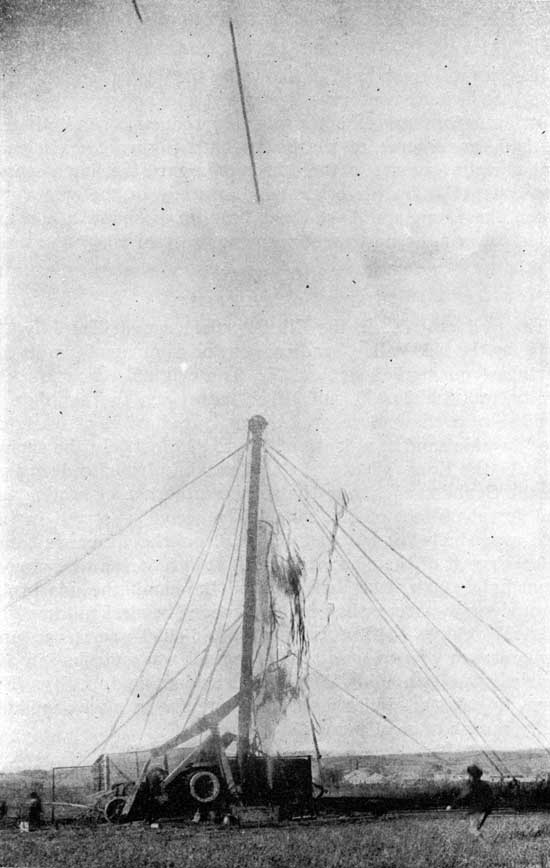
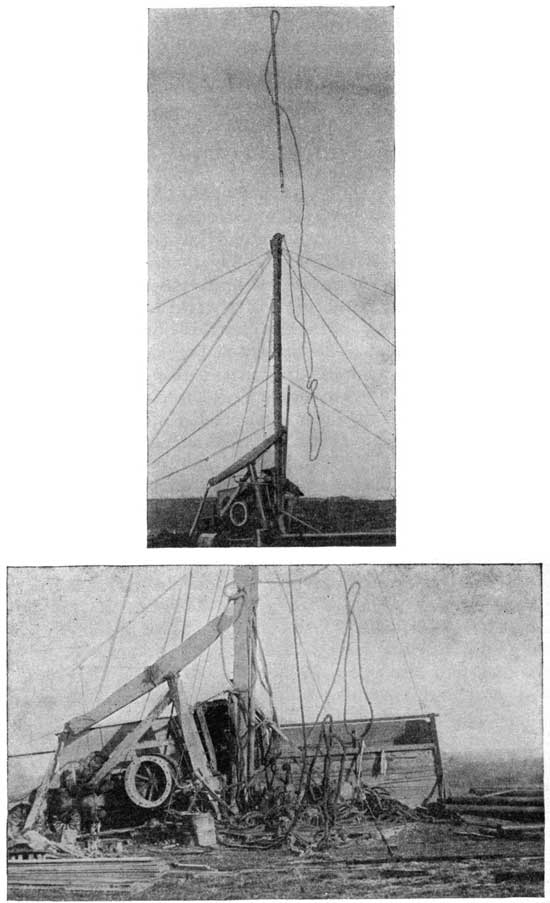
Plate V--Upper photograph shows West No. 2 immediately after being drilled in. Lower view shows the wreckage at West No. 5, after the well was brought under control. (Courtesy of Southwestern Gas Company.)
Up to the present time (December 20, 1919), 52 producing gas wells have been drilled in the Elk City field. These wells range in original volume from 1,500,000 to 86,000,000 cubic feet of gas daily, the average being close to 27,000,000 cubic feet. In this respect, it is probable that the Elk City field is one of the largest in the United States. About 15 dry holes have been drilled, determining fairly definitely the extent of the producing area. The ratio of dry holes to producing gas wells is less than one to three. A list of wells, showing initial capacity, etc., is given in Appendix A.
The Southwestern Gas Company of Independence marketed the first gas from the Elk City field in December 1918. Up to January 1, 1920, the Southwestern had marketed slightly over 6 billion cubic feet of gas, the daily average ranging from 4,000,000 to 27,700,000 cubic feet. It was impossible to secure any figures on the amount of gas marketed by the Nicholson Pipe Line Company, although it is reported that their average daily run since July 1, 1919, has varied between 7,000,000 and 10,000,000 cubic feet. Assuming that the Nicholson interests marketed on the average about 8,000,000 cubic feet of gas daily, it appears that up to January 1, 1920, their total would be about one and a half billion cubic feet. Although it is impossible, with the data at hand, to determine the exact amount of gas taken from the Elk City field, it is believed that at least seven and a half billion cubic feet had been marketed up to January 1, 1920. (See Appendix B.)
At present three pipelines carry the gas from the Elk City field. The Southwestern Gas Company of Independence has an 8-inch line leading from the field to Grabham station, south of Independence, where it delivers gas to the Kansas Natural Gas Company. All of this gas, amounting to about one-half of the daily output of the field, is used for domestic purposes. The Southwestern also has a 10-inch line leading to Cherryvale, with a spur line running south to Independence. This line ordinarily carries about one-fifth of the daily output and supplies both domestic and industrial consumers. The remaining line is owned by the Nicholson Pipe Line of Kansas City, Mo. This line runs northeast from the field to Lafontaine and Neodesha, where a considerable portion of its load is used by the Standard Oil Refinery.
The Southwestern Gas Company has erected a large compressor station in the NW sec. 26, which will be used to force the gas through the lines when the pressure falls to a point where the gas will not flow under its own pressure. This compressor station is now being used to gather gas from the low-pressure fields of Chautauqua and Elk counties.
During the early history of the Elk City field, when little was known regarding subsurface conditions, considerable difficulty was experienced by some operators because they failed to use sufficient casing. With the great pressure found in this pool, the casing must be absolutely tight and should extend all the way to the producing sand. Some operators have called this field a "water-pressure pool," meaning that the producing sand is lenticular and that the gas is held under pressure by water around the edges of the sand body. Such being the case, it would be expected that wells around the edge of the producing area would suffer from water troubles, and that as the pressure declines, the water would become more troublesome toward the center of the pool. In December 1919, six wells were disconnected from the pipeline because of water troubles. Referring to plate II, it may be noted that these wells were 1, 2, and 3 on the Simmons farm, 1 and 2 on the Brainerd, and 1 on the Brooke. It was reported that the Simmons wells were to be cleaned and re-tubed in an effort to exhaust the water and secure a further production of gas. Brainerd No. 1 is reported as dead. Brainerd No. 2 was troubled with water and a slight amount of oil, but it was hoped that the well could be cleaned, re-tubed, and turned into the low-pressure line of the Southwestern Gas Company. Well No. 1 on the Brooke farm became choked with water in January 1919, and it is doubtful if it will again produce gas. When water was at first noted in the wells, attempts were made to plug the bottom of the holes with various kinds of material. In some of the wells lead plugs were used, and in others a mixture of iron shavings and cement, but neither of these remedies proved of any value because of the rock pressure. At present the wells are blown every two weeks, so as to force out the water, which filters in through the sand and which would soon ruin the wells, if permitted to remain in the hole.
The original rock pressure in practically all of the first wells drilled in the Elk City field was 520 pounds. This remained constant until December 1918, when the first gas from the field was marketed by the Southwestern Gas Company. From January to July 1919, the pressure fell 35 pounds, and from July 1919 to January 1920, the decrease was over 150 pounds. (See figure 5.) During the last few weeks of 1919 the pressure declined about one pound daily. If the decrease in pressure continues at the present rate, the field will probably show signs of exhaustion during the fall of 1920, and it is possible that the compressor station will be needed next winter. It may be that the pressure will decline to a certain point and then tend to decrease less rapidly, many fields acting in this manner. As a rule, however, the gas fields of high initial pressure and volume are of rather short duration, as compared to those of medium pressure and smaller initial volume.
Figure 5--Diagram showing the monthly decline in rock pressure, as measured in pounds per square inch.
Offset wells drilled during the fall of 1919 came in with pressures sufficient to throw the tools over the top of the rig. The original pressure in some of these new wells was as high as 450 pounds, which would indicate that the sand at these points was as yet relatively unaffected by lines of drainage from the older wells. However, the pressure in these new wells tends to decrease rather rapidly, and in a few months is about the same as the older wells. Although the sand is fairly compact, it appears, therefore, that interfering drainage lines tend to equalize the pressure between the newer and older wells.
Little has been done in working out a satisfactory method for determining the future production of gas fields. Johnson and Huntley ("Principles of Oil and Gas Production," 1916, p. 164) have evolved a formula which in some cases may work out very well, yet it is admitted that the life of a field is modified by the rate at which the pressure declines, by the number of wells drilled in the pool, by the encroachment of saltwater, by retardation in tight sand wells, by the size of the reservoir, and sometimes by leakage through the well into an upper low-pressure sand. It is obviously a difficult matter to determine all of these factors. The method proposed by Johnson and Huntley takes into consideration the original pressure, the amount of the decline, the pressure at which the field will cease to be of great value, the total amount of gas produced, and the daily output. Assuming that the Elk City field has produced seven and a half billion cubic feet, the formula and result would be as follows:
[Original pressure minus 40 (minimum working pressure) / Decline in pressure] x Amount of gas produced
Substituting: [(520-40) / 200] X 7.5 billion = 18,000,000 cubic feet,
which is theoretically, according to this calculation, the amount of gas remaining in the pool. If the present rate of production could be maintained, the field should last approximately 450 days, according to this formula. However, the yield of a gas field declines with the pressure, so that although the Elk City pool may yet contain 18 billion cubic feet of gas, it is hardly probable that this amount will be marketed within the next 450 days. It is probable that the pressure will decline to such an amount as to make it necessary to use the compressor station next winter, yet it is believed that the Elk City field will be producing gas two or three years hence. A list of five gas fields in southeastern Kansas, with comparative figures as to depth, thickness of the gas sand, initial pressure and volume, life, and extent of the producing area, is given in Appendix C.
Figure 6 shows the pressure decline and life of six gas fields in southeastern Kansas and northeastern Oklahoma. It is to be noted that thus far the curve for the Elk City field closely resembles that for the Hogshooter field of Oklahoma, which produced enormous quantities of gas for about two years.
Figure 6--Diagram showing the comparative decline in rock pressure in important southeast Kansas and Oklahoma gas fields. (From Johnson and Huntley, Principles of Oil and Gas Production.)
As previously stated, 53 producing wells have been drilled in the Elk City field. There is space for possibly 10 good additional well locations, which will be drilled from time to time as the yield declines, so as to maintain the output at as nearly a constant level as possible. The average distance between the wells should not be less than 1,000 feet, although in some parts of the field they are more closely spaced because of property lines and the consequent necessity for offsets. Indeed, there is at present a sufficient number of wells to drain the entire pool, but they are not so arranged as to make this as thorough as possible. The life of the individual wells and of the entire field would be lengthened if production could be restricted to a small number of wells. The extent of the producing area has been determined on the east, south, and west, and it is expected that future development will extend toward the northwest, although one or two dry holes have already been encountered in this direction.
It is possible that the ridge of Mississippian limestone, which has been described, extends some distance to the northwest, and there is a possibility that favorable sand conditions may be repeated elsewhere along its course.
Recent developments in northeastern Oklahoma demonstrate that excellent production may be secured below the top of the Mississippian limestone. Subsurface conditions in the Elk City field show that there is a possibility of favorable structure in the Mississippian strata. Any deep test should extend at least 400 feet into the limestone.
| Farm | No. | Depth to gas sand |
Depth to Miss. Ls. |
Production (initial) |
|---|---|---|---|---|
| Augustine | 1 | 1450 ft. | Dry | |
| Ballinger | 1 | 9,000,000 cu. ft. | ||
| Ballinger | 2 | 1450 ft. | Dry | |
| Baum | 1 | 1340 ft. | 23,500,000 cu. ft. | |
| Baum | 2 | 1345 ft. | 25,850,000 cu. ft. | |
| Baum | 3 | 1354 ft. | 24,600,000 cu. ft. | |
| Baum | 4 | 1336 ft. | 33,750,000 cu. ft. | |
| Baum | 5 | 1343 ft. | 27,000,000 cu. ft. | |
| Baum | 6 | 1375 ft. | 33,000,000 cu. ft. | |
| Baum | 7 | 33,000,000 cu. ft. | ||
| Brainerd | 1 | 1355 ft. | 22,000,000 (water) | |
| Brainerd | 2 | 1367 ft. | 20,000,000 (dead) | |
| Brainerd | 3 | 24,600,000 cu. ft. | ||
| Brainerd | 4 | 33,700,000 cu. ft. | ||
| Brainerd | 5 | 30,000,000 cu. ft. | ||
| Brooke | 1 | 14,800,000 (dead) | ||
| Bryant | 1 | 1370 ft. | Dry | |
| Chalfant | 1 | 27,000,000 cu. ft. | ||
| Chalfant | 2 | 1352 ft. | 33,750,000 cu. ft. | |
| Cox | 1 | 1358 ft. | Drowned; oil and water | |
| Denton | 1 | 1357 ft. | Show of gas | |
| Gray | 1 | 1346 ft. | 26,600,000 cu. ft. | |
| Gray | 2 | 1338 ft. | 33,100,000 cu. ft. | |
| Gray | 3 | 11,000,000 cu. ft. | ||
| Hancock | 1 | 33,000,000 cu. ft. | ||
| Hancock | 2 | 1332 ft. | 55,000,000 cu. ft. | |
| Hemper | 1 | 1307 ft. | 20,000,000 cu. ft. | |
| Hemper | 2 | 1340 ft. | 23,000,000 cu. ft. | |
| Hett | 1 | 1335 ft. | 22,000,000 cu. ft. | |
| Hett | 2 | 1315 ft. | 18,000,000 cu. ft. | |
| Hett | 3 | 1321 ft. | 52,980,000 cu. ft. | |
| King | 1 | 1331 ft. | 20,000,000 cu. ft. | |
| King | 2 | 1353 ft. | 22,000,000 cu. ft. | |
| King | 3 | 1371 ft. | 32,000,000 cu. ft. | |
| King | 4 | 1327 ft. | 86,700,000 cu. ft. | |
| King | 5 | 22,500,000 cu. ft. | ||
| Lewis (sec. 23) | 1 | 1468 ft. | 1495 ft. | 1,500,000 cu. ft. |
| Lewis | 2 | 1440 ft. | 22,000,000 cu. ft. | |
| Lewis | 3 | 1432 (?) | Dry | |
| Lewis (sec. 26) | 1 | 1358 ft. | 31,700,000 cu. ft. | |
| Lewis | 2 | 19,600,000 cu. ft. | ||
| Lewis | 3 | 24,000,000 cu. ft. | ||
| Lewis | 4 | 34,000,000 cu. ft. | ||
| Lewis | 5 | 37,000,000 cu. ft. | ||
| Masters | 2 | 1507 ft. | Dry | |
| Simmons | 1 | 1340 ft. | 10,000,000 (water and oil) | |
| Simmons | 2 | 32,000,000 (water) | ||
| Simmons | 3 | 1337 ft. | 22,570,000 (water) | |
| Simmons | 4 | 27,200,000 cu. ft. | ||
| Stephens | 1 | 1360 ft. | Dry | |
| Stephens | 2 | 1452 ft. | Dry | |
| Spaht | 1 | 1515 ft. | Dry | |
| Spaht | 2 | 1580 ft. | Dry | |
| Spaht | 3 | 1387 ft. | Dry | |
| Starks | 1 | 1623 ft. | Dry | |
| Welchel (NE sec. 26) | 1 | 1350 ft. | 24,500,000 cu. ft. | |
| Welchel | 2 | 38,000,000 cu. ft. | ||
| Welchel | 3 | 14,500,000 cu. ft. | ||
| Welchel (SW sec. 26) | 1 | 1330 ft. | 36,000,000 cu. ft. | |
| Welchel | 2 | 1330 ft. | 32,000,000 cu. ft. | |
| West | 1 | 1327 ft. | 19,500,000 cu. ft. | |
| West | 2 | 41,600,000 cu. ft. | ||
| West | 3 | 33,500,000 cu. ft. | ||
| West | 4 | 35,700,000 cu. ft. | ||
| West | 5 | 60,000,000 cu. ft. |
Data showing the amount of gas marketed by the Southwestern Gas Company from the Elk City field:
| December 1918 | 126,267,000 cu. ft. |
| January 1919 | 372,431,000 cu. ft. |
| February | 564,067,000 cu. ft. |
| March | 672,721,000 cu. ft. |
| April | 567,968,000 cu. ft. |
| May | 230,889,000 cu. ft. |
| June | 319,043,000 cu. ft. |
| July | 261,626,000 cu. ft. |
| August | 226,000,000 cu. ft. |
| September | 353,290,000 cu. ft. |
| October | 839,478,000 cu. ft. |
| November | 798,408,000 cu. ft. |
| December | 808,713,000 cu. ft. |
| Total | 6,140,901,000 cu. ft. |
| Amount of gas marketed by Nicholson Pipe Line Company, estimated at 8,000,000 cubic feet daily for 180 days | 1,440,000,000 cu. ft. |
| Total amount of gas marketed probably about | 7,580,901,000 cu. ft. |
The following is a list of five gas fields in this part of the state, giving comparative figures as to depth, thickness of the producing sand, initial pressure and volume, life, and extent of the producing area (supplied in part by Mr. E. M. Stryker of Fredonia, KS):
Havana--Depth, 800 feet; sand thickness, 15 to 50 feet; initial pressure, 265 pounds; initial volume, average, 3 million; life, 5 years; area, 10 to 15 square miles.
Sedan--Depth, 700 feet; sand thickness, 10 to 40 feet; initial pressure, 285 pounds; initial volume, average, 5 million; life, 10 years; area, 8 to 10 square miles.
Hale--Depth, 800 feet; sand thickness, 50 to 60 feet; initial pressure, 255 pounds; initial volume, average, 1/2 to 3 million; life, wells hold good; area, 8 to 10 square miles.
New Albany--Depth, 1,200 feet; sand thickness, 22 feet; initial pressure, 320 pounds; initial volume, average, 3 to 12 million; life, 18 months.
Elk City--Depth, 1,350 feet; sand thickness, 20 to 30 feet; initial pressure, 520 pounds; initial volume, average, 1 1/2 to 86 million; area, 3 1/2 square miles.
Kansas Geological Survey
Placed on web Sep. 5, 2011; originally published in 1920.
Comments to webadmin@kgs.ku.edu
The URL for this page is http://www.kgs.ku.edu/Publications/Bulletins/5/index.html