Kansas Geological Survey, Bulletin 233, p. 9-30
by
Christopher G. St. C. Kendall1, Philip Moore1, John Strobel1, Robert Cannon2, Marty Perlmutter3, James Bezdek4, and Gautam Biswas5
1Department of Geological Sciences, University of South Carolina
2Department of Computer Science, University of South Carolina
3Texaco Research Center
4Division of Computer Science, University of West Florida
5Department of Computer Science, Vanderbilt University
There are many forward models that simulate sedimentary processes. The significance and utility of any particular model is a matter of need, computer hardware, and programming resources. Some forward-model simulations are one-dimensional; they are used to define third-order sea-level curves to infer the origin of peritidal cyclic carbonates, model the interdependence of sea level, depth-dependent carbonate accumulation, and the flexural response of the earths crust, and handle diagenesis of carbonate in relation to the eustatic record. Other simulations are two-dimensional and may handle clastics alone; they are used to create synthetic seismograms for sediment packages by modeling subsidence, sea level, sediment supply, and erosion, provide sedimentation rates for clastic fluvial systems using sediment compaction and tectonic movement, and simulate transport, deposition, erosion, and compaction of clastic sediments, emphasizing fluid velocity. Other simulations are two-dimensional carbonate shelf models that respond to sea-level changes and erosion, allowing redeposition of sediment with user-defined production functions; still others are two-dimensional mixed clastic and carbonate basin fill models. Both of these last kinds of models respond to sea-level changes and erosion, allowing redeposition of sediment with user-defined production functions. The program SEDPAK models some of the functions described and tests seismic interpretations based on sea-level curves. These curves are input parameters to the program. The program responds to tectonic movement, eustasy, and sedimentation, modeling sedimentary bypass and erosion. It reproduces clastic systems (including lacustrine, alluvial, and coastal plains, marine shelf, basin slope, and basin floor systems, and carbonate systems) and accounts for progradation, development of hardgrounds, downslope aprons, keep-up, catch-up, back-step, and drowned reef systems, and lagoonal and epeiric sea settings. SEDPAK simulates extensional vertical faulting of the basin, sediment compaction, and isostatic response to sediment loading. Sediment geometries can be viewed immediately on a graphics terminal as they are computed. Based on the observed geometric patterns, the user can repeatedly change the parameter and rerun the program until satisfied with the resultant geometry. This simulation is implemented in the C programming language (Kernighan and Ritchie, 1978), uses the X window system for graphical plotting functions (Scheifler and Gettys, 1986), and is operated on a Unix-based workstation, such as DEC 3 100, Sun, and Apollo. The simulation output is illustrated with examples from the Permian basin of West Texas and New Mexico, the Permian of the Sichuan basin, and the Upper Devonian of western Canada.
An Acrobat PDF file containing the complete paper is available (1.6 MB).
Various approaches have been taken to forward-model sedimentary processes. These different systems often reflect the type of modeling that the researchers are undertaking and their computer space and time requirements. The significance and utility of any particular approach is a matter of need and available hardware and programming resources. In our opinion (for a work setting with unlimited hardware and programming capability) probably the best scheme for modeling the sedimentary fill of basins is a combination of stochastic and forward-modeling systems. Recent advances in quantitative correlation techniques (Agterberg and Gradstein, 1988) and improvements in both computer hardware and software make the future for simulations good.
Our simulation is one of a number of simulation programs that forward-model the sedimentary fill of basins. Several of these forward simulations are one-dimensional. They model single locations and consider the vertical accumulation of sediment. These one-dimensional simulations are powerful tools commonly developed around programs small enough to run on personal computers while providing the means for inferring two- and three-dimensional models from one-dimensional output.
Grotzinger (1986) and Read and Goldhammer (1988) describe examples of forward modeling. They use the plots of Fischer (1964) to define third-order sea-level curves for the Ordovician peritidal cyclic carbonates of the Appalachians. By using the sediment record provided by the tidal-flat carbonates, these researchers determined the frequency and size of third-order (1-10 m.y.) sea-level variations. They examined the sediment record and used their simulation to infer the mechanisms that produced the sequence of sediments. This one-dimensional model for carbonate accumulation features a depth-dependent carbonate accumulation rate, time lags for carbonate accumulation, tidal ranges, carbonate facies in terms of their tidal or nontidal character, constant sinusoidal eustatic sea-level variation, and subsidence.
Goldhammer et al. (1987), Harris and Goldhammer (1987), Hinnov and Goldhammer (1988), and Goldhammer (1988) have described a similar approach with single-location simulations. They ascribe the high-frequency cycles recorded in the Middle Triassic Latemar platform carbonates of the Dolomite Mountains of northern Italy to Milankovitch glacioeustatic sea-level oscillations. Goldhammer and coworkers used a time-series analysis of the carbonate record to interpret the eustatic sea-level variations and explain them as the product of glacial effects (sea-level variations on a time scale of 10,000-15,000 years). Their model to account for the stratigraphic record is derived from a one-dimensional carbonate simulation (MR SEDIMENT). Features of MR SEDIMENT include a fixed carbonate deposition rate (i.e., the model is not depth dependent), lag depths for carbonate deposition, a constant rate of subsidence, and a sinusoidally fluctuating eustatic sea-level curve. This approach involved both forward and backward modeling. Later versions Of MR SEDIMENT (Goldhammer et al., this volume) are depth dependent. Goldhammer and Harris (1989) conducted a similar study in which they also determined the eustatic controls on the stratigraphy, carbonate facies, and geometry of the Latemar buildup of northern Italy.
Other similar simulations are useful to the user who needs to model the interdependence of sea level, depth-dependent carbonate accumulation, and the flexural response of the earth's crust. For instance, Cisne et al. (1984) describe a one-dimensional simulation that models carbonate sedimentation in an epeiric setting with changes in sea level. They derived a synthetic ecostratigraphy from the sedimentary record of the area to determine sea-level curves. Cisne (1985) then modeled depth-dependent sedimentation and the flexural edge effect in epeiric seas. Water depth was measured relative to the lithosphere's flexural wavelength and was used to recover flexural values for the earth's crust from analysis of water depth as determined from one-dimensional vertical sequences of carbonate rocks on epeiric platforms. Cisne's one-dimensional simulation featured depth-dependent carbonate accumulation rates, carbonate lag times, isostatic compensation, and a sinusoidally fluctuating sea-level curve.
Other one-dimensional approaches treat the stratigraphic record and diagenesis of carbonate platforms and bank margins as the product of glacial eustatic sea-level fluctuations (Matthews and Frohlich, 1987; Quinn, 1989; Humphrey and Quinn, 1989). Features incorporated into these models are sinusoidal eustatic sea level, depth-dependent carbonate accumulation rates, lag times, and the inclusion of up to four carbonate facies.
There are a number of two-dimensional simulations described in the literature. Most are too large to run on a PC and require at least an engineering workstation. These simulations tend to handle only clastic sediments. For instance, Turcotte and Willemann's (1983) simulation creates synthetic seismograms for sediment packages by modeling tectonic subsidence and harmonically varying sea level, sediment supply, and erosion. Sediment supply and erosion rates are treated as spatial variables. Their simulation models one sediment type, and sea-level changes follow a simple harmonic function; tectonic subsidence is constant, and sedimentation varies along spatial distances.
In another simulation Turcotte and Bernthal (1984) describe an essentially one-dimensional model that can be translated into a two-dimensional cross section by assuming a constant marine slope, a harmonically varying sea level, and a constant rate of tectonic uplift in the marine slope. Turcotte and Bernthal make no statement about carbonate accumulation rates, and the simulation appears to fill to sea level at some predetermined distance from the shoreline. Sea-level fluctuations are connected to a 100,000-year time scale with smaller 20,000-40,000-year sea-level variations superimposed on this.
Another two-dimensional clastic simulation is that of Bridge (1975, 1979) and Bridge and Leeder (1979). This evolving simulation, which is written in Fortran IV, models the stratigraphy of alluvial clastic facies. It is a sophisticated treatment of sediment compaction and tectonic movement and provides information on sedimentation rates for various clastic fluvial systems around the world. Along slightly different lines, Paola (1989) has created a two-dimensional clastic simulation to model foreland basin subsidence and gravel transport into adjacent alluvial basins. This simulation tracks gravels as a function of supply and subsidence and emphasizes grain-size controls on the slope of the alluvial plain. Pinter (1990), in contrast, has developed a series of algorithms that synthesize the stratigraphy of passive margins. Matthews and Frohlich (1990) take a similar approach and use glacioeustasy to drive the erosion and depositional cycles of fluvial and coastal systems.
In a more stratigraphic vein, Ross (1989) and Ross et al. (1990) describe a two-dimensional simulation that models the clastic fill of a basin and mimics the stratal patterns seen on seismic cross sections. Similarly, Cross (1987) has developed a simulation that describes the genetic controls on the distribution of coals and clastic sediments in transgressive-regressive cycles occurring in the Upper Cretaceous of the western interior of the United States. Syvitski (1990) has developed a two-dimensional finite-difference model to track deposition of clastic sediments in river and deltaic settings over periods of a year. Algorithms include bed load behavior, hemipelagic sedimentation, creep, and slides. These algorithms are related to diffusion. Syvitski has also developed a way to predict the organic carbon content of the sediment.
In contrast, Bitzer and Harbaugh (1987) have a relatively simple process-driven clastic model called DEPOSIM, which is designed for a Macintosh computer. This model is a two-dimensional simulation of transport, deposition, erosion, and compaction of clastic sediments. It emphasizes the importance of fluid velocity in terms of deposition and erosion. It stores clastic facies as an ultimate function of the fluid velocity at the time of deposition. Tetzlaff (1986) has developed a much more sophisticated clastic simulation called SEDSIM, which models the processes of grain transport responding to fluid flow. The program runs on a high-level workstation. Tetzlaff (1986), Bitzer and Harbaugh (1987), and Tetzlaff and Harbaugh (1989) have used fluid velocity as the primary control for sediment deposition and erosion. The model does not explicitly incorporate sediment supply, however, and so the modeling of large basins becomes computationally lengthy. Bitzer and Harbaugh (1987) report that a single run on Tetzlaff's simulation requires hours of mainframe time. Recently, Takao et al. (1990) developed a three-dimensional clastic model for deltaic sedimentation involving jet flow, density flow, and bed load transportation.
Other one- and two-dimensional clastic process models include those of Thorne (1988) and Thorne and Swift (1990). Thorne's (1988) model handles sedimentation on shelves in terms of grain size, the transport path of the sediment across the shelf, and the advective and diffusive components of sediment transport. Thorne and Swift (1990) extended the two-dimensional process-driven clastic model to track foreland basin fill for alluvial fans and their dispersal by longshore wave transport. Diffusion is again used to model offshore sediment transport.
Carbonate simulations have as wide a variety as clastic simulations. For instance, Graus et al. (1988) describe a two-dimensional computer simulation of the Holocene facies history of a Caribbean fringing reef tract at Galeta Point, Panama. This simulation plots facies along the reef using carbonate growth potential as a function of water depth (sunlight) and wave energy.
Demicco and Spencer (1989) and Spencer and Demicco (1989) have worked out a simple two-dimensional carbonate shelf simulation (MAPS) that shows how carbonate cycles can be a product of not only eustasy but also a variety of processes related to relative sea-level change (e.g., subsidence, isostasy, sediment accumulation, and compaction). Twenty process variables affecting carbonate accumulation are modeled in the program. Four steps (calculation of water depth, sediment production, sediment distribution, and plotting) make up the program's operation. Sea-level changes, built from linear, sawtooth, sinusoidal, and step functions, are used to derive a Milankovitch curve. Bice (1988) describes a similar two-dimensional carbonate shelf to basin simulation that is particularly sensitive to changes in sea level.
Another two-dimensional simulation for carbonate accumulation has been put forward by Dromgoole et al. (1986) and Lerche et al. (1987). They use as input depth, nutrient supply, sunlight, temperature, salinity, oxygen content, sea level, and tectonism. Although the simulation of Lerche et al. (1987) handles a large number of variables to model carbonate accumulation, few of these variables have dimensions that have been measured and, when using the geologic record as a source, most of the values of these variables can only be guessed at.
Koerschner and Read (1989) used a mix of one- and two-dimensional simulations tied to carbonate sedimentary facies to model the Cambrian shelf carbonates of the Viriginian Appalachians. Their study is one of the best demonstrations of how good stratigraphic data can be used with a simulation to establish the causes of variations in carbonate facies, thickness, and geometry in the cycles across a shelf.
Bosence and Waltham (1990a, b) developed a simulation to model carbonate platforms. The model, which responds to sea-level changes and erosion, allows redeposition of sediment and relies on an empirical user-defined production function. Production is accounted for both vertically and laterally, enabling the modeler to form lagoons. Eroded sediment is transported either to the deepest part of the lagoon or to depressions in the foreslope base. Isostasy, flexure, and compaction are not modeled. Harris (1990) has a similar two-dimensional carbonate progradational model in which he demonstrates the importance of antecedent topography and rates of sedimentation on the final geometry of carbonate margins.
Simulations analogous to ours that model both the clastic and the carbonate fill of a basin and that respond to eustasy, sedimentation, and tectonic movement have been reported by Aigner et al. (1987), Lawrence et al. (1987, 1990), and Lawrence (1988). Like us, these researchers try to match their simulation's output to seismic lines. French and Watney (1990) have developed a scheme that could improve the power of these two-dimensional simulations through the proscription of facies on simulation output based on position and depth of water.
The future of simulations seems to lie in taking fluid flow and thermal history models such as that of Bethke et al. (1988) and tying them to (1) forward sedimentologic models similar to our simulation; (2) models that consider such settings as foreland basins in terms of sediment erosion and fill responding to depositional slope and relief, the rheology of the crust, plate tectonics, and thermal subsidence [e.g., Angevine and Turcotte (1981), Jordan and Flemings (1989), Flemings and Jordan (1990), and Slingerland and Furlong (1990)]; and (3) stochastic approaches. Such simulations involving fluid flow should improve our capability to evaluate potential models for the production of hydrocarbons from sedimentary basins with poor data sets. An exciting line of research lies in using a least-squares method to tie interpreted seismic lines to simulation output while letting one of the major input variables (e.g., sea level or subsidence) vary freely.
The significance of sedimentary simulations is that, although they may not provide a unique solution to the causes of a particular sediment geometry or relationship, they can be used to test hypotheses involving the effects of eustatic change, tectonic movement, and changes in the rates of sedimentation by providing geometries to match to outcrops, well-log cross sections, and seismic lines. An example of this is illustrated by Koerschner and Read (1989), who demonstrate how simulations can be used to bracket the size of the processes hypothesized to cause the facies variations and geometries observed in sedimentary sections. In much the same way, simulations like ours can be used to model tectonic mechanisms that cause regional sea-level variations and can test whether changes in the regional stress field are sufficient to produce apparent eustatic sea-level variations akin to those described by Cloetingh et al. (1985), Cloetingh and Wortel (1986), and Cloetingh (1986). Similarly mixed clastic-carbonate two-dimensional simulations can be used to test the occurrence of eustatic sea-level events and their effects and thus to confirm or deny concepts such as those of Gradstein et al. (1988), who believe that there may be errors in Exxon's coastal onlap charts, particularly in the chronology of fluctuating sea levels since the Triassic.
The development of the SEDPAK simulation began with some of the concepts of Jervey (1989). Essentially, Jervey's quantitative two-dimensional geologic model simulates the deposition of siliciclastic rock sequences and reproduces the geometries that can be seen on seismic lines. Jervey recognized the interrelationships among accommodation, subsidence, sediment supply, and sea level, and it is these interrelationships that we have tried to simulate. Our first attempt was a program (SEDFIL) that simulated the deposition of marine clastic sediments (Burton et al., 1987; Kendall and Lerche, 1989). We then added the capability to simulate deposition of an alluvial plain (Kendall et al. 1986; Helland-Hanson et al., 1988) and showed that there was no unique mathematical solution to determine the size of the three variables that produce the geometries we were trying to model (Burton et al., 1987). Later, our simulation algorithm was extended to include carbonate deposition, faulting, and sediment deposition from two sides of the basin; this simulation is called SEDBSN (Strobel et al., 1987; Strobel, Cannon et al. 1989; Strobel, Soewito et al., 1989; Scaturo et al., 1989). The program was then restructured to speed up execution and reduce space requirements and renamed SEDPAK (Strobel, Cannon et al., 1989; Tang et al., 1989; Kendall, Strobel et al., 1989; Kendall, Harris et al., 1989; Kendall, Moore et al., 1989).
In earlier publications (Strobel et al., 1987; Strobel, Cannon et al., 1989; Strobel, Soewito et al., 1989; Scaturo et al., 1989), we have described in some detail how our simulation reproduces clastic and carbonate sediment geometries in various depositional settings. We have shown how the simulation tracks the evolving sedimentary geometry of clastic sediments transported into the basin and the in situ production of carbonates and their transportation over short distances. Where possible, we have tried to design the simulation to mimic the geologic processes involved in clastic and carbonate sediment accumulation for large time spans and specific depositional settings. At the same time our approach has been that, when we have no algorithm to describe a particular effect, we proscribe it. For instance, if we cannot model the parameters that control the distance that submarine sediments are transported into the basin, then we define a distance. Nevertheless, in proscribing that distance, we do not deposit sediments on slopes above a certain angle (we do not exceed depositional repose angles for submarine and alluvial settings) and we erode the previously deposited sediment if, after compaction and tectonic subsidence, the angle of the sediment surface exceeds the postdepositional angle of rest for that sediment (we use different angles for the subaerial and the submarine settings). The user is able to vary these and other input parameters to study the effects that changes in these parameters have on the evolving geometry. In particular, the effects of eustatic changes on clastic and carbonate sediment deposition can be modeled.
The simulation treats clastic geometries as primarily influenced by the volume of sediments delivered to and redistributed within a basin. It is assumed that the sources of the sand and shale sediments are not located within the boundaries of the simulated region; the user has good estimates of both the volume (expressed as cross-sectional areas) of clastic sediments involved and the distance that each type of clastic penetrates (transported from the basin margin) into the basin over the time interval modeled. In addition, the program simulates deposition of nonmarine and marine clastic sediments. Included are mechanisms to fill topographic depressions, to develop sediment wedges or fans, to drape fill over topography, to ensure that clastic sediments penetrate a minimum distance into the basin, and to monitor the volume and areal distribution of the sediments being deposited. Sand and shale deposition are treated separately so that both the distance traveled and the volume (cross-sectional area on the simulation) of the material transported into the basin can differ. However, it should be noted that within each time step no attempt is made to recreate the interbedded relationships between the sand and the shale. Instead, the total amount of sediment deposited is modeled, with the areal distribution of each sediment type shown as a ratio of the total quantity of sediment deposited at each time step.
In contrast to clastic sediments, the source for carbonate sediments is assumed to be located within the boundaries of the simulation; carbonate geometries are treated as if they are influenced by the amount of in situ carbonate accumulation and the volume of transported carbonate talus that accumulates over that same time interval. The modeled carbonate depositional phenomena include a response to the influences of eustasy on the rates of accumulation and the progradation or retreat of carbonates similar to that described by Strobel, Cannon et al. (1989), Strobel, Soewito et al. (1989), Bice (1988), and Scaturo et al. (1989).
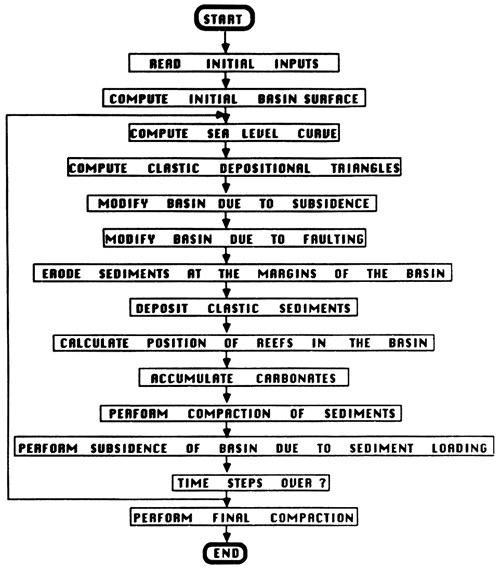
In our simulation, as in nature, the initial and evolving shape of the basin surface directly affects the geometry of the sediments as they are deposited. Our simulation can model additional influences on sediment geometry, such as the amount of regional and hinged subsidence, faulting of the basin, water depth, erosion of previously deposited sediments, submarine slumping, compaction of sediments, and isostatic subsidence of the basin in response to sediment loading. Figure 1 diagrams the flow of the SEDPAK program. The program is iterative and deposits sediments layer by layer for a user-specified number of time steps. Each time step corresponds to a user-defined number of real years (usually a few million years).
Figure 1--Flow diagram for SEDPAK.
The simulation can be viewed as a medium for testing hypotheses used to explain the geometries observed in stratigraphic sequences as they respond to sea-level variation, sediment accumulation, and tectonic movement. The simulation is limited by the variables that we have modeled. For instance, at this time SEDPAK does not model crustal rigidity algorithms or algorithms for thermal subsidence. However, the user can determine subsidence behavior from burial and crustal subsidence curves or from seismic data an enter these values directly into the simulation just as the user can proscribe a sea-level curve. For instance, the Haq et al. (1987) sea-level curves are effective inputs for the Mesozoic and Tertiary section. The simulation then enables the user to see how sediment geometry evolves in response to a particular movement of the crust or rate of sediment supply or sea-level curve. Our simulation is designed to be computationally fast (requiring only minutes on a workstation), enabling the user to compare the resulting geometry quickly with interpreted seismic lines. In the interest of speed, our simulation incorporates sediment supply into the model directly and simplifies many geologic processes.
The simulation was run on a variety of data sets to test its features. Some runs were carried out to illustrate the simulation's sensitivity to various input parameters, such as eustatic sea-level variation, crustal rigidity, volume of sediment transported into the basin, erosion of sediments, and user-supplied repose angles. Other runs demonstrate how the simulation algorithm can model faulting, salt ridges, compaction, offshore topography, and sedimentary drape.
For the sensitivity tests the data used as a standard of comparison are called the Dvail data set. Briefly, some of the major features modeled in the Dvail data set are three rises and two falls in the eustatic sea level, as can be seen in fig. 2. Eustatic sea level is plotted in the lower left-hand comer of the figure. Another feature modeled was fluctuating sediment supply. To produce the geometry seen in the simulation, we assumed that sediment supply increased when eustatic sea level rose and decreased when sea level fell, a relationship that is the inverse of that expected in nature but a test of the simulation. The volume of sediments transported into the basin over time from the left margin is plotted in the lower center part of fig. 2, and the sediments transported into the basin over time from the right side of the basin are shown in the lower right-hand part of fig. 2. The distance to which the sediments penetrate the basin was uniform over time. The simulation was also modeled to subside regionally for approximately the first two-thirds of the run and then to cease regional subsidence in the final third. A strong degree of crustal rigidity was proscribed throughout the area of the simulation.
Figure 2--Output of the Dvail data set. The upper graph shows the simulated cross section of the fill of a basin by sand (dots) and shale (horizontal lines). If carbonates are deposited (and in this case they are not), they are marked by vertical lines. The small black squares on the simulation mark where the alluvial plain intersects sea level. The horizontal dashed line is the sea-level position for the last time step simulated. The left-hand graph on the bottom shows the vertical sea-level position as a function of time. The upper dotted line is the second-order sea-level curve and the lower thin continuous line is the first-order sea-level curve. The lower dotted line is the resulting sea-level curve used in the simulation. The central lower graph shows how the area of clastic sediment deposited from the left varies as a function of time. The upper series of dots represents the area of shale deposited per time step. The lower series of crosses represents the area of sand deposited per time step. The light thick horizontal line of diamonds represents the area of a third potential sediment that could be deposited per time step. In this case, nothing was deposited so the line is horizontal. The lower right-hand graph shows the area of sediment deposited from the right of the basin as a function of time. The heavy horizontal dark line indicates that no sediment is deposited from the right for this particular simulation run. When sediment is deposited, dots represent shale, crosses represent sand, and diamonds represent a potential third clastic material.
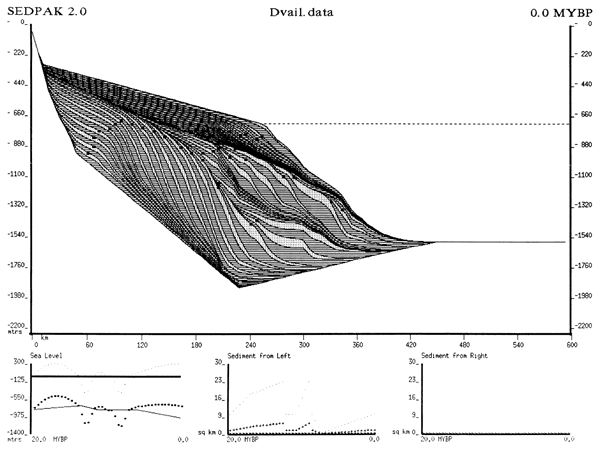
The output of the simulation using the Dvail data set shows three sequences. The first sequence contains only a transgressive and highstand system tract that corresponds to the first rise in eustatic sea level; the later two sequences are complete, reflecting the later two falls and rises in eustatic sea level. The three sequences extend about the same distance into the basin. The overall volume of each sequence decreases with time. This reflects the transported sediment volume specified by the inputs. The three sequences are separated by a type 1 unconformity (Vail and Todd, 1981; Van Wagner et al., 1987) formed during the low eustatic sea-level stands.
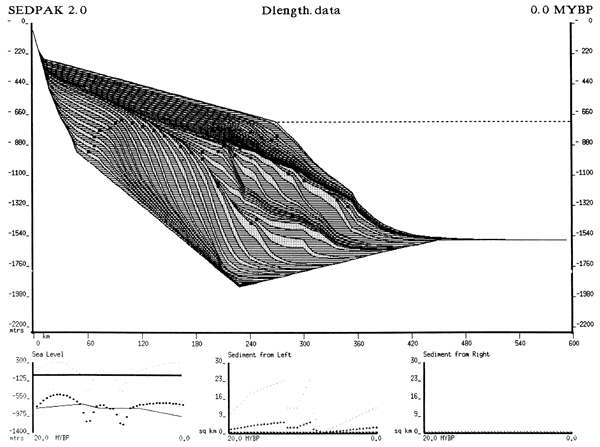
A variation of the Dvail data set (Dlength) was run to model the different distances that sediments penetrate into the basin (fig. 3). The distance that sediments were allowed to penetrate into the basin was never held constant over time; rather, sediment penetration was allowed to vary by as much as 10% more than the sediment penetration in the Dvail run. However, during the first third of the simulation (fig. 3), sediment penetration distances were kept at the same level as those in the Dvail run to make the comparison of the two data sets easier (overlay figs. 2 and 3). The increases in the distance that sediments penetrate into the basin resulted in increased volumes of sediments transported into the basin (fig. 3). Not unexpectedly, the first sequences from Dvail and Dlength match fairly well; however, in the next two sequences, although the overall geometry of the two sequences is the same, probably because the same eustatic sea-level curve was used, the sediments penetrate further into the basin in the Dlength run, and there is a much stronger sense of sediment progradation than in the Dvail run. This increased penetration is due to the user-specified greater penetration into the basin. The greater amount of progradation in the Dlength run is due to the increased sediment supply matching the increased penetration of sediments into the basin (compare figs. 3 and 2).
Figure 3--Output of the Dlength data set in which the proscribed distance that the sediments penetrate into the basin varies for many of the time steps. See fig. 2 for an explanation of the symbols.
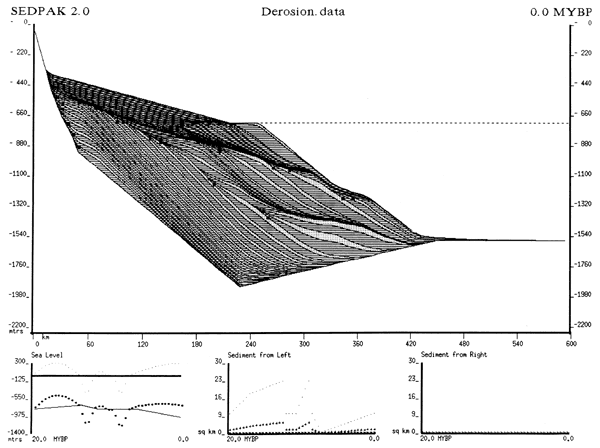
Another data set (Derosion; fig. 4) that uses the same sea-level curve, subsidence rates, sediment supply, and sediment penetration as the Dvail data set (fig. 2) was run. However, in this run the erosion rates on the margins were increased and the angles of repose of the sediments were decreased. By decreasing the erosion tolerance, the user can see the erosional surfaces more easily (fig. 4). Furthermore, erosion is a controlling factor on the resultant geometry. The angle that sediments erode to, not the angle of the alluvial and submarine depositional surfaces of the Dvail run (fig. 2), controls the upper surfaces of the alluvial and submarine fans (fig. 4). In addition, the thickness of the first sequence in the Derosion run (fig. 4) is less than that of the Dvail run (fig. 2) and the thickness of the second sequence of the Derosion run is greater than that of the Dvail run. This is due to the addition to the second sequence of sediments eroded from the surface of the first sequence. The third sequence remains unchanged with regard to sediment volume, in part because erosion exerts more control than geometry when the third sequence begins deposition. This increases the stability of the sediments lying on the basin margin.
Figure 4--Output of the Derosion data set showing how the amount of sediment eroded per time step can be modified and how variation in the repose angle to which sediments are eroded affects the geometry of the simulation. See fig. 2 for an explanation of the symbols.
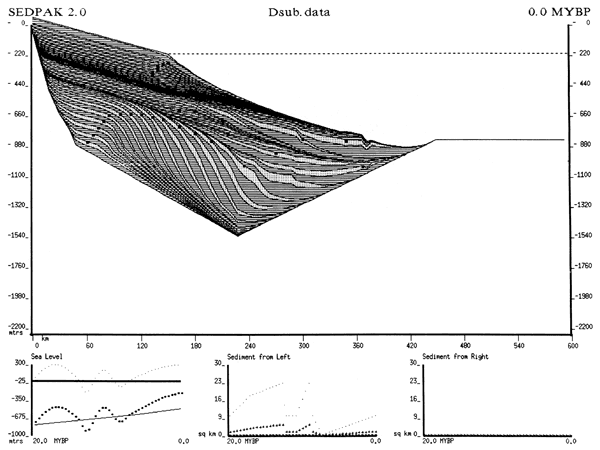
A test case (Dsub; fig. 5) was run in which the data set differed from the Dvail data set (fig. 2) by not having any regional subsidence. To use this data set, we had to modify the eustatic sea-level curve by the adding a long-term rise, but the essential sense of the sea-level curves between these two runs remains the same. In this run the accommodation of the basin is controlled by eustatic sea level. Without the benefit of regional subsidence, accommodation in the basin is significantly less. The decrease in accommodation leads the resultant geometries of the three sequences to be more uniformly thick, with the maximum thickness much less than that in the Dvail run. The overall volume of each sequence is approximately the same, however, and the penetration distance of the sediments into the basin is essentially equal.
Figure 5--Output of the Dsub data set showing a simulation with no regional subsidence. See fig. 2 for an explanation of the symbols.
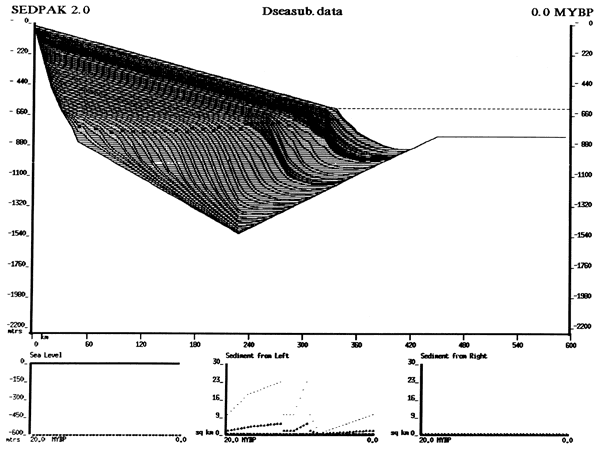
A test case (Dseasub; fig. 6) was run to examine how the simulation would respond to constant sea level and no regional subsidence using the same sediment supply and penetration values of the Dvail run (fig. 2). The resulting geometries of this data set show a gradually prograding and aggrading sequence of sediments. In particular, it is easy to see the controlling influence of the alluvial and submarine repose angles on the developing sediment geometries. The only way that the three sequences can be readily distinguished or separated from each other is by the periods of low or no deposition that mark the beginning of each sequence. When a low volume of sediments is transported into the basin, a condensed sequence package is formed on the slope part of the basin.
Figure 6--Output of the Dseasub data set showing a simulation that models constant eustatic sea level and no regional subsidence. See fig. 2 for an explanation of the symbols. Note that the sea-level graph in the lower left-hand comer exhibits a horizontal line, indicating that sea level did not vary for this simulation.
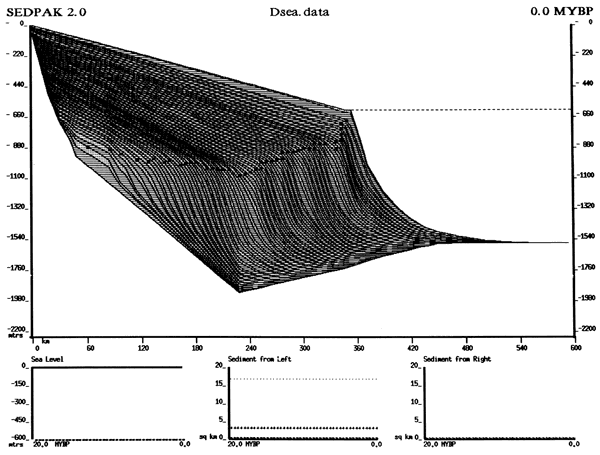
Another test (Dsea; fig. 7) was run on a variation of the Dvail data set (fig. 2) in which the eustatic sea level and sediment supply were held constant and the regional subsidence rate was varied over time. The subsidence rate was modeled to increase and decrease over the time of the simulation. The effect of the varying subsidence rate was to increase or decrease the accommodation in the basin. During periods of higher subsidence and correspondingly greater accommodation, a greater thickness of sediments was deposited on the shelf of the basin, causing a greater rate of aggradation and a smaller rate of progradation of the basin margin. Although the rate of progradation increased, during periods of lesser basinal subsidence, more sediments were deposited on the slope and basinward areas of the simulation because there was less accommodation on the basin shelf. Once more, this test shows the controlling influences of the alluvial and submarine repose angles on the evolving sedimentary geometries.
Figure 7--Output of the Dsea data set in which eustatic sea level and sediment supply are held constant and basin subsidence rate varies over time. See fig. 2 for an explanation of the symbols. Note that the sea-level graph in the lower left-hand comer exhibits a horizontal line, indicating that sea level did not vary for this simulation. Also note that the sediment input was kept constant.
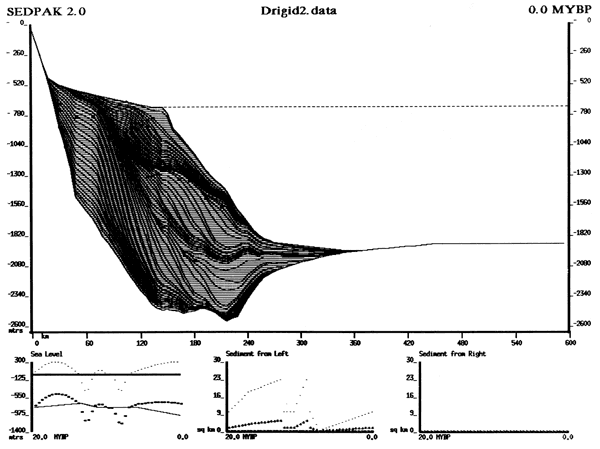
Two test cases [Drigid (fig. 8) and Drigid2 (fig. 9)] were run to see what effects were involved with modeling an Airy isostatic model (Airy, 1855). The major effect of the mantle being perfectly elastic is to increase the accommodation on the shelf and slope of the basin. As the accommodation for the sediments being transported into the basin is increased on the shelf areas of the basin, the distance that the sediments penetrate into the basin is decreased and the thickness of the sediment deposits on the shelf increases greatly. When the crust is modeled to be perfectly elastic (Drigid2; fig. 9), the deposited sequences have a greater chance of lying upon each other than when a greater rigidity is assumed. This is due to the greater lack of sediment penetration and the increased accommodation on the shelf areas, which leads to thicker deposits on the shelf.
Figure 8--Output of the Drigid data set showing partially elastic crustal response to sediment loading. See fig. 2 for an explanation of the symbols.
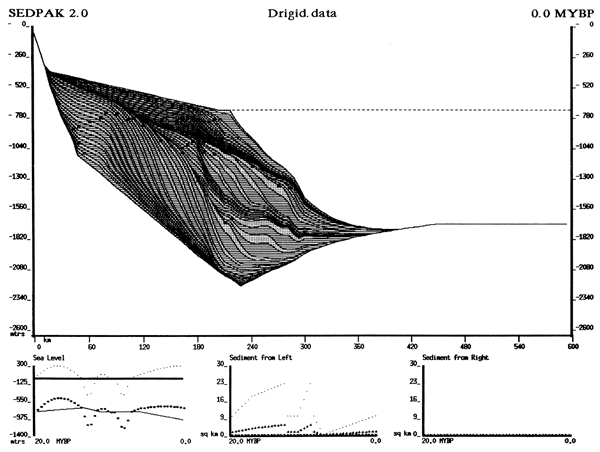
Figure 9--Output of the Drigid2 data set showing a perfect Airy (1855) elastic response to sediment loading. See fig. 2 for an explanation of the symbols.
Some tests (Djudy and Djudy-atoll; figs. 10 and 11) were carried out to examine the flexibility of the carbonate algorithm. Figure 10 examines how the carbonate algorithm responds to quick rises in eustatic sea level and to periods of stable eustatic sea level. The simulation responds by prograding the carbonate platforms seaward over their talus deposits during periods of stable eustatic sea level and by backstepping the carbonate margins during jumps in the rate of rise of eustatic sea level. Figure 11 examines the effects of increasing the rates of lagoonal damping in restricted areas, maintaining all other variables at their fig. 10 levels. Not surprisingly, the simulation responds to this change in the inputs by creating an atoll-like feature as the reef areas outpace the lagoonal areas in terms of carbonate accumulation. This effect becomes more pronounced over time as water depth begins to reduce the accumulation rate in the lagoonal areas. In the areas seaward of the reef the simulation behaves in an identical fashion with the Djudy output.
Figure 10--Output of the Djudy data set showing a carbonate simulation demonstrating backstepping of the margins of a carbonate platform during sharp rises in eustatic sea level. See fig. 2 for an explanation of the symbols.
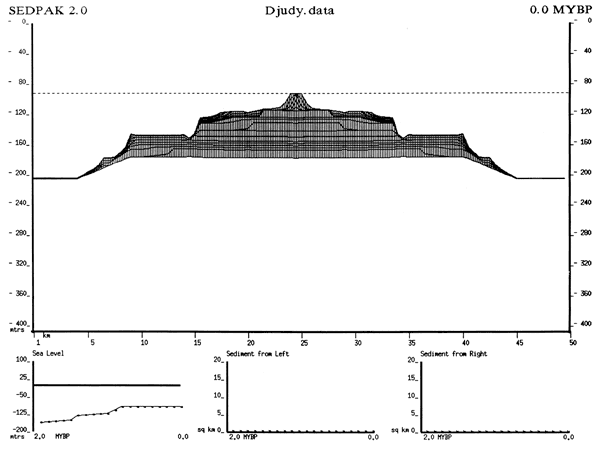
Figure 11--Output of the Djudy-atoll data set showing a carbonate simulation demonstrating lagoonal lag of carbonate accumulation in the center of a carbonate platform. See fig. 2 for an explanation of the symbols.

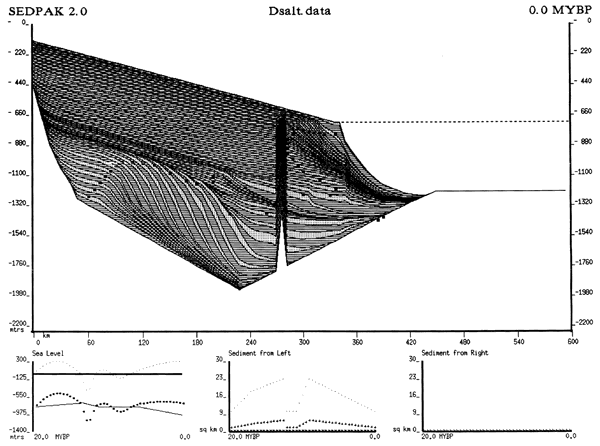
Finally, a simulation was run on several data sets to show how different features could be handled by the simulation. Dtwo (fig. 12) shows the results of a basin being filled from both sides. Sediments come into the basin from the left and the right at varying rates, as eustatic sea level fluctuates several times. The Dblock (fig. 13) data set shows how the simulation handles offshore topographic relief and models drape. The tolerance level for offshore topographic relief is a user-supplied input. The Dblock output shows how the simulation first fills the depression behind the offshore topographic relief and then proceeds to deposit sediments past the relief once it has been topped. Dfaulting (fig. 14) and Dsalt (fig. 15) show that features such as vertical faults and salt ridges can be incorporated into the simulation. Faulting and salt movement are modeled only within the vertical plane; thus the simulation gives a sense of the general relationships but does not handle salt withdrawal or the development of rim synclines. In addition, the user can model varying slip rates for the vertical vector of faults and the varying rate of the vertical vector for the uplift for salt ridges.
Figure 12--Output of the Dtwo data set showing how our simulation models a two-sided basin. See fig. 2 for an explanation of the symbols. Note in the lower right-hand graph that a constant, even supply of shale is deposited from the right-hand side of the basin, whereas the left-hand side supplies both sand and shale in varying amounts.
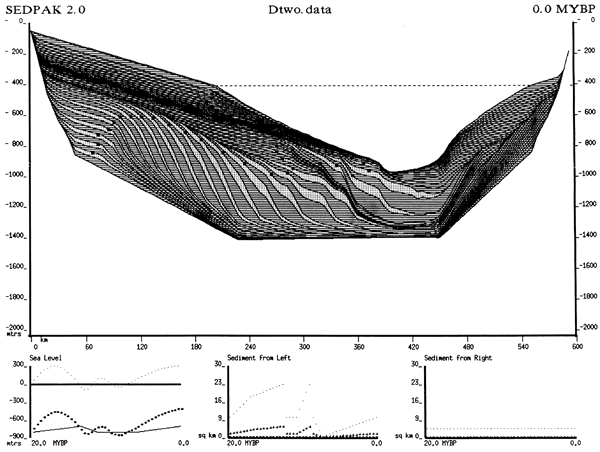
Figure 13--Output of the Dblock data set showing how our simulation can model offshore topographic relief. See fig. 2 for an explanation of the symbols.
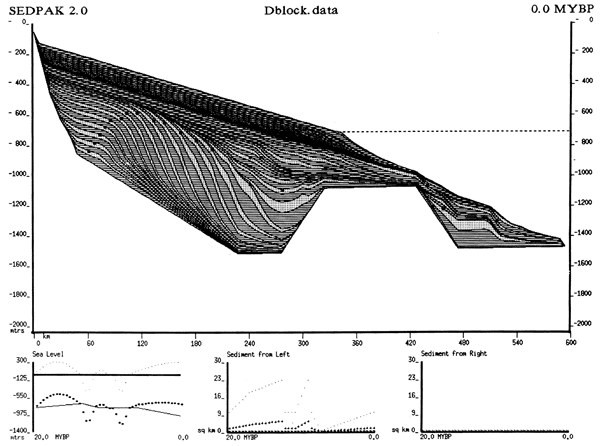
Figure 14--Output of the Dfaulting data set showing how our simulation models vertical faulting within a basinal environment. See fig. 2 for an explanation of the symbols.
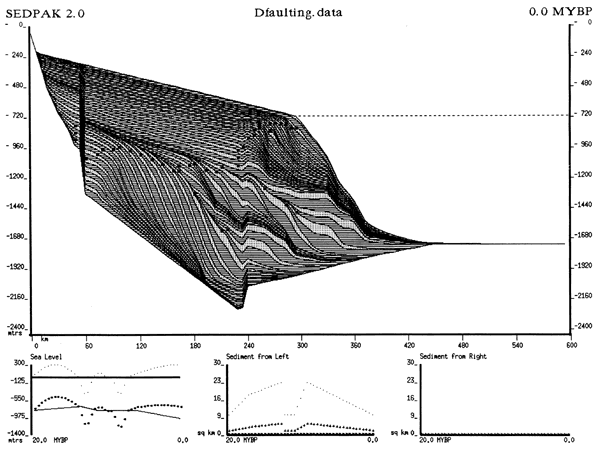
Figure 15--Output of the Dsalt data set showing how the simulation can model salt diapir features within a basinal environment. See fig. 2 for an explanation of the symbols.
To further test the SEDPAK algorithm, we modeled several geologic examples, including the Upper Permian Guadalupian sediments of West Texas and New Mexico (Kendall, Strobel et al., 1989; Kendall, Harris et al., 1989; Kendall, Moore et al., 1989) (fig. 16) and the sedimentary fill of the Sichuan basin of China by Upper Permian coals and carbonate sequences (Tang et al. 1989a,b) (fig. 17).
Figure 16--Output of the Permian data set showing the simulation reproducing the geometries of the Upper Permian Guadalupian of the West Texas Permian basin. See fig. 2 for an explanation of the symbols.
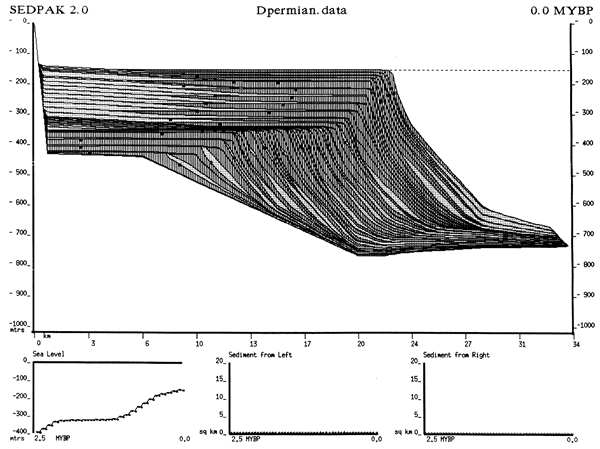
Figure 17--Output of the Sichuan data set showing the simulation reproducing the geometries of the Upper Permian of the Sichuan basin. See fig. 2 for an explanation of the symbols.
The sediments of the West Texas Upper Permian are composed of carbonate and clastic materials (Kendall, Strobel et al., 1989; Kendall, Harris et al., 1989). The geometries that were being duplicated were the cross sections of the Upper Permian Capitan margin of the northern Delaware basin made by King (1942) and Garber et al. (1989). These cross sections show a mixed carbonate-clastic sequence prograding from 4 km to 19 km (2.5-12 mi) into a basin at least 400 m (1,300 ft) deep over a period of 2.5 m.y. The geometries of this margin reflect changes in eustasy, low crustal subsidence, and carbonate shelf margin production rates of approximately 8 m of carbonate sediments per 1,000 yr (30 ft/1,000 yr); these sediments were transported downslope. Locally, the Seven Rivers Formation carbonate margin aggrades 140 m (460 ft) with little progradation; then it moves seaward over its debris 3-7 km (1.9-4 mi), aggrading 10 m (30 ft). The carbonate margin of the Yates and Tansill Formations aggrades 140 m (460 ft) with a progradation of 3 km (2 mi). Throughout carbonate deposition, siliciclastic sediments accumulated on the shelf, forming 10% of the sediment of the Seven Rivers Formation, 60% of the Yates Formation, and 10% of the Tansill Formation. Basin equivalents contain up to 80% siliciclastic sediments bypassed from the shelf at sea-level lows.
By using the simulation, we reproduced the present geometries of the sediments of the Permian basin Capitan shelf margin by having a rapid third-order sea-level rise upon which 3-10-m (10-30-ft) fourth-order sea-level fluctuations were superimposed. Experimentation suggests that the 3-m (10-ft) cycles produced the most realistic response in the simulation. Because of the limitations of the array that can be handled by the program, only 50 fourth-order sea-level variations over the deposition of the Carlsbad group were modeled, but the results produced geometries that match the cross sections (fig. 16). Third-order sea-level cycles were assumed to be similar to those recognized by Ross (1989), and sea level was modeled as rising rapidly at the beginning of Seven Rivers time, causing the sequence to aggrade. This rise then slowed, reducing the accommodation and causing progradation. In Yates and Tansill time sea level was modeled as rising rapidly, accompanied by aggradation.
Most of the carbonate sediment was modeled as having formed in less than 20 m (66 ft) of water at the basin margin, with most of the carbonate produced being transported downslope to form the prograding clinoforms of the margin. The margin was allowed to develop a stable carbonate slope of up to 20° (a response to active cementation) and a siliciclastic slope of 1.6°. The siliciclastic sediments were modeled by trapping them updip during sea-level highstands and having them bypass the margin at lowstands to collect in the basin. The models developed with the simulation generally match the geometries seen in outcrop and in the subsurface, confirming that the Permian basin was rapidly filled by the prograding carbonate margin and clastic bypass.
The Upper Permian Sichuan basin of China was also modeled (Tang et al., 1989a, b). The Upper Permian Sichuan basin is underlain by basaltic lava flows. A transgressive aggrading clastic sequence was deposited over these basaltic lava beds. As the clastic sediments onlapped shelfward, deep-water carbonates began to be deposited in the clastic-starved distal basin. As the sea-level rise continued, clastic sedimentation in the basin decreased and the deep-water carbonates began shoaling upward, finally reaching sea level to prograde into the basin. The simulation was able to capture the geometries of the Sichuan Upper Permian.
SEDPAK is written in the C programming language (Kernighan and Ritchie, 1978) under the Unix operating system and the X window system environment (Scheifler and Gettys, 1986). Portability of the software to many system types results from work within this environment. The system types supported at this time are the SUN-3, SUN-4, SUN-386i, Apollo, DEC 3100, Convex, and Iris workstations. The simulation can also be run as a client on a Unix system and displayed over a network on Macintosh or PC systems using appropriate server software packages for these machines.
The program is run interactively by the user. The program is provided with a set of initial numerical inputs. Once the inputs have been entered, the user runs the simulation. After each time step the simulation can display sediment geometries. The program can be run to completion, or it can be interrupted to allow the user to change the inputs. The input data sets can be saved for later use.
Clastic deposition values, which are related to cross-sectional area, can be determined from local well logs, cores, and seismic data. The distance that sediments penetrate into the basin is directly derived from the user's seismic or well data.
The clastic simulation algorithm creates sediment fans and erodes and deposits sediment in a natural fashion. In particular, clastic sediments are prevented from being deposited directly upslope so that the filling of topographic lows in a basin model is realistic.
The simulation's carbonate algorithm handles carbonate accumulation plausibly; however, it requires the user to provide a great deal of information that may not be readily available. We realize that in many locations information may be incomplete, inaccurate, or simply lacking (Scaturo et al., 1989) partly because of the unavailability of published data on carbonate production rates as a function of depth, carbonate production rates in lagoons or epeiric settings, damping of carbonate growth as a result of the presence of clastic sediments, and the depth to which carbonate production is suppressed by wave energy (Scaturo et al., 1989). As a consequence, some of the default values are no more than educated guesses.
The simulation allows rates of tectonic subsidence or fluctuating amplitude and frequency of eustatic sea level to vary irregularly as a function of time. In contrast, most published descriptions of carbonate simulations are for one-dimensional models and cover small amounts of time (<1 m.y.). This is because most carbonate models are designed to recapture eustatic sea level from the carbonate sedimentary record and are not used in a predictive manner. These simplifications are valid for simulations that cover relatively small amounts of geologic time. For a simulation that encompasses a larger amount of geologic time (>1 m.y.), however, these simplifications are no longer valid.
The simulation algorithm treats the basin's response to sediment loading either by proscribing subsidence from crustal subsidence curves or by treating the basin as if it were perfectly elastic (which we recognize is unrealistic, so we usually proscribe the subsidence).
Although the simulation handles the reduction of porosity resulting from sediment loading, it does not address the migration of fluids within the pore space and hence burial diagenesis. To extend its functionality to include the fluid history of the basin, we need to alter the program to allow the overpressure of fluids and the occurrence of sedimentary seals for fluids within the area being modeled. Finally, with respect to whether the evolving sediment geometry of the basin allows the existence of hydrocarbons, the thermal history, rock type, and organic content of the basin would have to be incorporated into the simulation.
Experimental results confirm that the simulation provides a good two-dimensional picture of the sedimentary geometries created by filling a basin with clastic, carbonate, and mixed sediments. Various tectonic features and the basin's response to the filling sediments are also incorporated into our model. In situ carbonate sediments are deposited in a process-driven fashion, and the carbonates grow directly as a result of the basin's shape and water depth. Clastic sediments require users to provide information on the total cross-sectional area of the sediment type and the extent to which the sediment extends into the basin. After the amount of clastic sediment is known, the deposition of this sediment follows general geologic rules.
Although SEDPAK is a unique simulation in only a few features (wave energy, faulting, capability for irregularly varying frequency and magnitude of eustatic sea level, and rates of tectonic subsidence), it appears to be one that encompasses most of the features included in sediment modeling and thus can be used in a predictive mode.
We would like to thank Macomb Jervey, who explained his ideas about two-dimensional geologic simulations to Christopher Kendall and sparked our work, and Rande Burton, Elvira Camino, Richard Slater, Kazuo Nakayama, Ian Lerche, David Scaturo, William Helland-Hanson, Freddy Soewito, and Phil Moore, all of whom contributed either their programming skills or ideas about the simulation. We express our appreciation to the Union Petroleum Company of California, the Japanese National Oil Corporation, Amoco, British Petroleum, Texaco, and Mobil Oil for partial financial support for development of the SEDPAK simulation.
Agterberg, F. P., and Gradstein, F. M., 1988, Recent developments in quantitative stratigraphy: Earth Science Reviews, v. 25, p. I73
Aigner, T., Doyle, M., and Lawrence, D. T., 1987, Isostatic controls on carbonate platform development (abs.): American Association of Petroleum Geologists, Bulletin, v. 71, p. 524
Airy, G. B., 1855, On the computation of the effect of the attraction of the mountain masses as disturbing the apparent astronomical latitude of stations at geodetic surveys: Philosophical Transactions of the Royal Society of London, v. 1, p. 5-20
Angevine, C. L., and Turcotte, D. L., 1981, Thermal subsidence and compaction in sedimentary basins-application to Baltimore Canyon trough: American Association of Petroleum Geologists, Bulletin, v. 65, p. 219-225
Baldwin, B., and Butler, C. O., 1985, Compaction curves: American Association of Petroleum Geologists, Bulletin, v. 69, p. 622-626
Bethke, C. M., Harrison, W. J., Upson, C., and Altaner, S. P., 1988, Supercomputer analysis of sedimentary basins: Science, v. 239, p. 261-267
Bice, D., 1988, Synthetic stratigraphy of carbonate platform and basin systems: Geology, v. 16, p. 703-706
Bitzer, K., and Harbaugh, J. W., 1987, Deposim--a Macintosh computer model for two-dimensional simulation of transport, deposition, erosion and compaction of clastic sediments: Computers and Geosciences, v. 13, p. 611-637
Bosence, D., and Waltham, D., 1990a, Computer modeling the internal architecture of carbonate platforms: Computers and Geosciences, v. 10, p. 10-20
Bosence, D., and Waltham, D., 1990b, Computer modeling the internal architecture of carbonate platforms: Geology, v. 18, p. 26-30
Bridge, J. S., 1975, Computer simulation of sedimentation in meandering streams: Sedimentology, v. 22, p. 3-43
Bridge, J. S., 1979, A Fortran IV program to simulate alluvial stratigraphy: Computers and Geosciences, v. 5, p. 335-348
Bridge, J. S., and Leeder, M. R., 1979, A simulation model of alluvial stratigraphy: Sedimentology, v. 26, p. 617-644
Burton, R., Kendall, C. G. St. C., and Lerche, I., 1987, Out of our depth---on the impossibility of fathoming eustasy from the stratigraphic record: Earth Science Reviews, v. 24, p. 237-277
Cisne J. L., 1985, Depth-dependent sedimentation and the flexural edge effect in epeiric seas-measuring water depth relative to the lithosphere's flexural wavelength: Journal of Geology, v. 93, p. 657-576
Cisne, J. L., Gildner, R. F., and Rabe, B. D., 1984, Epeiric sedimentation and sea level-synthetic ecostratigraphy: Lethaia, v. 17, p. 267-288
Cloetingh, S., 1986, Intraplate stresses--a new tectonic mechanism for fluctuations of relative sea level: Geology, v. 14, p. 617-620
Cloetingh, S., and Wortel, R., 1986, Stress in the Indo-Australian plate: Tectonophysics, v. 132, p. 49-67
Cloetingh, S., McQueen, H., and Lambeck, K., 1985, On a tectonic mechanism for regional sea-level variations: Earth and Planetary Science Letters, v. 75, p. 157-166
Cross, T. A., 1987, Genetic controls on distribution of coals in transgressive-regressive cycles, Upper Cretaceous, Western Interior, USA: Proceedings of the Workshop on Quantitative Dynamic Stratigraphy (QDS), Colorado School of Mines, p. 34-37
Demicco, R. V., and Spencer, R. J., 1989, MAPS--a Basic program to model accumulation of platform sediments: Computers and Geosciences v. 15 p. 95-105
Dromgoole, E., Kendall, C. G. St. C., Lerche, I., Scaturo, D., and Walter, L. M., 1986, Simulation of carbonate depositional response to nutrient supply, sunlight, temperature, salinity, oxygen, sea level and tectonism (abs.): American Association of Petroleum Geologists, Bulletin, v. 70, p. 584
Eberli, G. P., and Ginsburg, R. N., 1989, Cenozoic progradation of northwestern Great Bahama bank--a record of lateral platform growth and sea level fluctuations; in, Controls on Carbonate Platform and Basin Development, Wilson, J. L. , Crevello, P., and Read, F., eds.: Society of Economic Paleontologists and Mineralogists, Special Publication 44, p. 339-351
Eberli, G. P., Kendall, C. G. St. C., Perlmutter, M., Moore, P., Cannon, R., Biswas, G., and Bezdek, J. C., 1990, Simulation of the response of carbonate sequences to eustatic sea level changes (Tertiary, northwest Great Bahama Bank) (abs.): American Association of Petroleum Geologists, Bulletin, v. 74, p. 647
Fischer, A. G., 1964, The Lofer cyclothems of the Alpine Triassic; in, Symposium on Cyclic Sedimentation, Merriam, D. F., ed.: Geological Survey of Kansas, Bulletin 169, p. 107-150 [available online]
Flemings, P. B., and Jordan, T. E., 1990, Modeling sedimentary sequences in clastic sedimentary basins (abs.): American Association of Petroleum Geologists, Bulletin, v. 74, p. 654
French, J. A., and Watney, L. W., 1990, Computer modeling of midcontinent cyclothems and its application to the prediction of hydrocarbon reservoirs (abs.): American Association of Petroleum Geologists, Bulletin, v. 74, p. 657
Garber, R. A., Grover, G. A., and Harris, P. M., 1989, Geology of the Capitan shelf margin-subsurface data from the northern Delaware basin; in, Subsurface and Outcrop Examination of the Capitan Shelf Margin, Northern Delaware Basin, Harris, P. M., and Grover, G. A., eds.: Society of Economic Paleontologists and Mineralogists, Core Workshop 13, p. 3-269
Goldhammer, R. K., 1988, Superimposed platform carbonate cycles--eustatic response of an aggradational carbonate buildup, Middle Triassic of the Dolomites (abs.): American Association of Petroleum Geologists, Bulletin, v. 72, p. 190
Goldhammer, R. K., and Harris, M. T., 1989, Eustatic controls on the stratigraphy and geometry of the Latemar buildup (Middle Triassic), the Dolomites of northern Italy; in, Controls on Carbonate Platform and Basin Development, Crevello, P. M., Wilson, J. L., Sarg, F. J., and Read, J. F., eds: Society of Economic Paleontologists and Mineralogists, Special Publication 44, p. 323-338
Goldhammer, R. K., Dunn, P. A., and Hardie, L. A., 1987, High-frequency glacio-eustatic sea-level oscillations with Milankovitch characteristics recorded in Middle Triassic platform carbonates in northern Italy: American Journal of Science, v. 287 p. 853-892
Gradstein, F. M., Agtergerg, F. P., Aubry, M. P., Berggren, W. A., Flynn, J. J., Hewitt, R., Kent, D. V., Klitgord, K. D., Miller, K. G., Obradovich, J., Ogg, J. G., Prothero, D. R., and Westermann, G. E. G., 1988, Chronology of fluctuating sea levels since the Triassic--a critique: Science, v. 241, p. 599-601
Graus, R. R., Macintyre, I. G., and Herchenroder, B. E., 1988, Computer simulation of the Holocene facies history of a Caribbean fringing reef--Galeta Point, Panama: Proceedings of the Fifth International Congress on Coral Reefs, v. 3, p. 317-322
Grotzinger, J. P., 1986, Cyclicity and paleoenvironmental dynamics, Rocknest platform, northwest Canada: Geological Society of America, Bulletin, v. 97, p. 1,208-1,231
Hallock, P., 1981, Algal symbiosis--a mathematical analysis: Marine Biology, v. 62, p. 249-255
Haq, B., Hardenbol, J., and Vail, P. R., 1987, Chronology of fluctuating sea level since the Triassic (250 million years to present): Science, v. 235, p. 1,156-1,167
Harris, M. T., 1990, Modeling carbonate progradation geometry and sediment accumulation rates--a comparison of MARGIN results with outcrop data (abs.): American Association of Petroleum Geologists, Bulletin, v. 74, p. 671
Harris, M. T., and Goldhammer, R., 1987, Platform/foreslope facies and buildup geometry resulting from short-term and long-term eustatic sea-level fluctuations--Latemar buildup (Middle Triassic), Dolomites, northern Italy: American Association of Petroleum Geologists, Bulletin, v. 71, p. 564-565
Helland-Hanson, W., Kendall, C., Lerche, I., and Nakayama, K., 1988, A simulation of continental basin margin sedimentation in response to crustal movements, eustatic sea-level change and sediment accumulation rates: Journal of Mathematical Geology, v.20, p. 777-802
Helland-Hanson, W., Steel, R., Nakayama, K., and Kendall, C. G. St. C., 1989, Review and computer modeling of the Brent Group stratigraphy; in, Deltas--Sites and Traps for Fossil Fuels, Whately, M. K. G., and Pickering, K. T., eds.: Geological Society of America, Special Publication 41, p. 237-252
Hinnov, L., and Goldhammer, R. K., 1988, Identification of Milankovitch signals in Middle Triassic platform carbonate cycles using a super-resolution spectral technique (abs.): American Association of Petroleum Geologists, Bulletin, v. 72, p. 197
Humphrey, J. D., and Quinn, T. M., 1989, Coastal mixing zone dolomite, forward modeling, and massive dolomitization of platform-margin carbonates: Journal of Sedimentary Petrology, v.59, p.438-454
Jervey, M. T., 1989, Quantitative geological modeling of siliciclastic rock sequences and their seismic expression; in, Sea-Level Changes-An Integrated Approach, Wilgus, C. K., Hastings, B., Kendall, C. G. St. C., Posamentier, H., Ross, C., and Van Wagoner, J. C., eds.: Society of Economic Paleontologists and Mineralogists, Special Publication 42, p. 47-70
Jordan, T. E., and Flemings, P. B., 1989, From geodynamic models to basin fill-a stratigraphic perspective; in, Quantitative Dynamic Stratigraphy, Cross, T. A., ed.: Prentice Hall, Englewood Cliffs, New Jersey, p. 149-164
Kendall, C. G. St. C., and Lerche, I., 1989, The rise and fall of eustasy; in, Sea-Level Changes--An Integrated Approach, Wilgus, C. K., Hastings, B., Kendall, C. G. St. C., Posamentier, H., Ross, C., and Van Wagoner, J. C., eds.: Society of Economic Paleontologists and Mineralogists, Special Publication 42, p. 318
Kendall, C. G. St. C., Lerche, I., and Nakayama, K., 1986, Simulation of continental margin sedimentation (abs.): American Association of Petroleum Geologists, Bulletin, v. 70, p. 606
Kendall, C. G. St. C., Moore, P., Strobel, J., Cannon, R., Bezdek, J., and Biswas, G., 1989, Simulation of sedimentary fill of basins; in, Sedimentary Modeling-Computer Simulation of Depositional Sequences, Franseen, E. K., and Watney, W. L., eds.: Kansas Geological Survey, Subsurface Geology Series 12, p. 1-4
Kendall, C. G. St. C., Harris, P. M., Strobel, J., Cannon, R., Moore, P., Bezdek, J., and Biswas, G., 1989, Simulation of the West Texas, New Mexican Permian Guadalupian basin margin--a response to eustatic change, an example of SEDPAK: Abstracts of the 28th International Geological Congress, Washington, DC, v. 2, p. 174
Kendall, C. G. St. C., Strobel, J., Tang, J., Moore, P., Cannon, R., Bezdek, J., and Biswas, G., 1989, Simulation of the West Texas, New Mexican Permian Guadalupian basin margin--a response to eustatic change, an example Of SEDPAK; in, Subsurface and Outcrop Examination of the Capitan Shelf Margin, Northern Delaware Basin, Harris, P. M., and Grover, G. A., eds.: Society of Economic Paleontologists and Mineralogists, Core Workshop 13, p. 423-426
Kernighan, B. W., and Ritchie, D. M., 1978, The C programming language: 2d ed., Prentice Hall, Englewood Cliffs, New Jersey, 278 p.
King, P. B., 1942, Permian of West Texas and southeastern New Mexico: American Association of Petroleum Geologists, Bulletin, v. 26, p. 535-763
Koerschner, W.F., III, and Read, J. F., 1989, Field and modeling studies of Cambrian carbonate cycles, Virginia Appalachians: Journal of Sedimentary Petrology, v. 59, no. 5, p. 654-687
Lawrence, D. T., 1988, Simulation of depositional sequences in clastic, carbonate, and mixed clastic-carbonate regimes: Proceedings of the Workshop on Quantitative Dynamic Stratigraphy (QDS), Colorado School of Mines, p. 12-13
Lawrence, D. T., Doyle, M., and Aigner, T., 1989, Calibration of stratigraphic models in exploration settings: American Association of Petroleum Geologists, Bulletin, v. 73, no. 3, p. 379-380
Lawrence, D. T., Doyle, M., and Aigner, T., 1990, Stratigraphic simulation of sedimentary basins--concepts and calibration: American Association of Petroleum Geologists, Bulletin, v. 74, no. 3, p. 273-295
Lawrence, D. T., Doyle, M., Snelson, S., and Horsfield, W. T., 1987, Stratigraphic modeling of sedimentary basins (abs.): American Association of Petroleum Geologists, Bulletin, v. 71 p. 582
Lerche, I., Dromgoole, E., Kendall, C. G. St. C., Walter, L. M., and Scaturo, D., 1987, Geometry of carbonate bodies-a quantitative investigation of factors influencing their evolution: Carbonates and Evaporites, v. 2, p. 15-42
Matthews, R. K., and Frohlich, C., 1987, Forward modeling of bank-margin carbonate diagenesis: Geology, v. 15, p. 673-676
Matthews, R. K., and Frohlich, C., 1990, Orbital forcing of glacioeustasy--evaluation of alluvial clastic source/sink term (abs.): American Association of Petroleum Geologists, Bulletin, v. 74, p. 714
McCormack, J., 1985, X Toolkit Intrinsics--C Language X, Interface X, Window System X, version 11, Release 2: Digital Equipment Corporation, Boston, Massachusetts
Nakayama, K., and Kendall, C. G. St. C., 1989, A simulation of basin margin sedimentation to infer geometry and lithofacies--a carbonate example; in, Sedimentary Facies in the Active Plate Margin, Taira, A., and Masuda, F., eds.: Terra Scientific Publishing Company, Tokyo, p. 17-31
Paola, C., 1989, A simple basin-filling model for coarse alluvial systems; in, Quantitative Dynamic Stratigraphy, Cross, T. A., ed.: Prentice Hall, Englewood Cliffs, New Jersey, p. 363-374
Pinter, N., 1990, Passive margin synthetic stratigraphy--eustatic control on deposition and preservation potential on the continental shelf (abs.): American Association of Petroleum Geologists, Bulletin, v. 74, p. 741
Quinn, T. M., 1989, Forward modeling of bank margin carbonate diagenesis-results of sensitivity tests and initial applications; in, Quantitative Dynamic Stratigraphy, Cross, T. A., ed.: Prentice Hall, Englewood Cliffs, New Jersey, p. 445-455
Read, J. F., and Goldhammer, R. K., 1988, Use of Fischer plots to define third-order sea-level curves in Ordovician peritidal cyclic carbonates, Appalachians: Geology, v. 16, p. 895-899
Ross, W. C., 1989, Modeling relative base level surfaces; in, Quantitative Dynamic Stratigraphy, Cross, T. A., ed.: Prentice Hall, Englewood Cliffs, New Jersey, p. 387-400
Ross, W. C., May, J. A., Watts, D. E., and French, J. A., 1990, Quantitative stratigraphic modeling-the role of stratigraphic data sets (abs.): American Association of Petroleum Geologists, Bulletin, v. 74, p. 654
Scaturo, D. M., Strobel, J. S., Kendall, C. G. G. St. C., Wendte, J. C., Biswas, G., Bezdek, J., and Cannon, R., 1989, Judy Creek--a case study of a two-dimensional sediment deposition simulation; in, Controls on Carbonate Platform and Basin Development, Wilson, J. L., Crevello, P., and Read, F., eds.: Society of Economic Paleontologists and Mineralogists, Special Publication 44, p. 64-76
Scheifler, R. W., and Gettys, J., 1986, The X Window System: Association of Computing Machinery Transactions on Graphics, v. 5, no. 2, p. 79-109
Slingerland, R. L., and Furlong, K. P., 1990, Shoreline position in clastic wedges of marine foreland basins--a modeling study (abs.): American Association of Petroleum Geologists, Bulletin, v. 74, p. 765
Spencer, R. J., and Demicco, R. V., 1989, Computer models of carbonate platform cycles driven by subsidence and eustasy: Geology, v. 17, p. 165-168
Strobel, J., Cannon, R., Kendall, C. G. St. C., Biswas, G., and Bezdek, J., 1989, Interactive (SEDPAK) simulation of clastic and carbonate sediments in shelf to basin settings: Computers and Geosciences, v. 15, p. 1,279-1,290
Strobel, J., Kendall, C. G. St. C., Biswas, G., Bezdek, J. C., and Cannon, R., 1987, Preliminary description of the program SEDFIL with carbonate module added; in, Proceedings of Denver GeoTech Computer-Aided Methods and Modeling in Geology and Engineering, Peters, D. C., and Krajewski, S. A., eds.: Denver GeoTech, Denver, Colorado, p. 341-349
Strobel, J., Soewito, F., Kendall, C. G. St. C., Biswas, G., Bezdek, J., and Cannon, R., 1989, Interactive simulation (SEDPAK) Of clastic and carbonate sediments in shelf to basin settings; in, Quantitative Dynamic Stratigraphy, Cross, T. A., ed.: Prentice Hall, Englewood Cliffs, New Jersey, p. 433-444
Syvitski, J. P. M., 1990, Numerical prediction of the sediment characteristics, including carbon content of basin fill: American Association of Petroleum Geologists, Bulletin, v. 74, p. 774-775
Takao, I., Yamamura, T., Suinouchi, H., and Miyata, Y., 1990, Three-dimensional computer simulation system of deltaic sedimentary sequences: American Association of Petroleum Geologists, Bulletin, v. 74, p. 682-683
Tang, J., Kendall, C. G. St. C., Strobel, J., Cannon, R., Moore, P., Bezdek, J., and Biswas, G., 1989, Simulation of the sedimentary fill of the Sichuan basin by Upper Permian coals and carbonate sequences--an example of the use Of SEDPAK (abs.): American Association of Petroleum Geologists, Bulletin, v. 73, no. 3, p. 418
Tetzlaff, D. M., 1986, Computer simulation model of clastic sedimentary processes (abs.): American Association of Petroleum Geologists, Bulletin, v. 70, p. 655
Tetzlaff, D. M., and Harbaugh, J. W., 1989, Simulating clastic sedimentation: Van Nostrand Reinhold, New York, 202 p.
Thorne, J., 1988, Numerical modeling of shelf facies--bridging the gap between oceanography and sedimentology: Proceedings of the Workshop on Quantitative Dynamic Stratigraphy (QDS), Colorado School of Mines, p. 19
Thorne, J., and Swift, D. J. P., 1990, A theoretical model for sequence geometry-simulation of the US Western Interior Cretaceous foreland (abs.): American Association of Petroleum Geologists, Bulletin, v. 74, p. 779
Turcotte, D. L., and Bernthal, M. J., 1984, Synthetic coral-reef terraces and variations of Quaternary sea level: Earth and Planetary Science Letters, v. 70, p. 121-128
Turcotte, D. L., and Willemann, R. J., 1983, Synthetic cyclic stratigraphy: Earth and Planetary Science Letters, v. 63, p. 8996
Vail, P. R., and Todd, R. G., 1981, North Sea Jurassic unconformities, chronostratigraphy and sea level changes from seismic stratigraphy; in, Petroleum Geology of the Continental Shelf of Northwest Europe, Proceedings: Heydon and Sons, London, p. 216-235
Vail, P. R., Mitchum, R. M., Jr., Todd, R. G., Widmier, J. M., Thompson, S., III, Sangree, J. B., Bubb, J. N., and Hatlelid, W. G., 1977, Seismic stratigraphy and global changes of sea level; in, Seismic Stratigraphy--Applications to Hydrocarbon Exploration, Payton, C. E., ed.: American Association of Petroleum Geologists, Memoir 26, p. 49-212
Van Wagner, J. C., Mitchum, R. M., Posamentier, H. W., and Vail, P. R., 1987, Key definitions of seismic stratigraphy: American Association of Petroleum Geologists, Atlas of Seismic Stratigraphy, v. 1, p. 11- 14
Walker, K. R., Shanmugan, G. S., and Ruppel, S. C., 1983, A model for carbonate to terrigenous clastic sequences: Geological Society of America, Bulletin, v. 94, p. 700-712
Kansas Geological Survey
Comments to webadmin@kgs.ku.edu
Web version March 2010. Original publication date 1991.
URL=http://www.kgs.ku.edu/Publications/Bulletins/233/Kendall/index.html