| Original published in D. W. Steeples, ed., 1989, Geophysics in Kansas: Kansas Geological Survey, Bulletin 226, pp. 31-52 | ||
Kansas Geological Survey
The article is also available as an Acrobat PDF file.
First published in University of Missouri--Rolla Journal in 1982; reprinted with permission.
As petroleum-exploration efforts in the midcontinent become directed toward smaller fields and the search for minerals is extended into new areas, the edges of the Salina and Forest City basins will become of increased interest to industry. The principal boundary feature between the two basins is the Nemaha Ridge, a linear feature that extends from near Omaha, Nebraska, to near Oklahoma City, Oklahoma. Recent seismic studies at the Kansas Geological Survey have revealed a complex array of faulted and folded structures in the vicinity of the Humboldt fault zone (the eastern flank of the Nemaha Ridge). Faulting of both normal and reverse types is present, including horsts and grabens. Although some Permian-age faulting is present, most of the Permian deformation occurred as monoclinal draping at the flanks of the Nemaha Ridge. Recent microearthquake activity suggests that some of the faults are slightly active along a zone 400 km (240 mi) long (north-south) and 50 km (30 mi) wide (east-west) coincident with the Nemaha Ridge from southeastern Nebraska to north-central Oklahoma. Seismic-reflection evidence suggests that either uplift along the Nemaha occurred contemporaneously with Pennsylvanian deposition or uplift and peneplantation occurred during a period of exposure between the deposition of Mississippian sediments and Pennsylvanian sediments. Analyses of boundary structures and intrabasin structures are not complete without knowledge of basement rock history and basement structure. Microearthquake-arrival and deep-reflection data recently obtained from the Consortium for Continental Reflection Profiling (COCORP) in Kansas reveal intrabasement structures in the 1O-35-km (6-21-mi) depth range. Data from aeromagnetic studies and basement drilling reveal block-faulting patterns and several episodes of Precambrian intrusive and/or extrusive vulcanism. Much of the data presented in this paper is not yet fully analyzed, but preliminary results suggest that the integrated assistance is expanding the scientific knowledge of the earth's crust and upper mantle in the midcontinent. Specifically, it is hypothesized that petroleum deposits are related to localized heating in the upper crust and are associated with igneous intrusions and ascension of mantle fluids into the crust probably during Cretaceous time. This hypothesis is consistent with the existence of known deposits of petroleum.
Kansas has been one of the major oil-producing areas of the United States for more than 60 yrs. The first oil was discovered in 1860, with truly major production beginning just after discovery of the El Dorado field in 1915. Fig. 1 shows areas within Kansas that have produced or are producing oil and/or natural gas; fig. 2 shows areas that have produced or could produce coal. Coal production peaked at about 7 million tons per year during World War I and then declined gradually until the mid-1970's, when about one-half million tons per year were mined (Brady et al., 1977).
Figure 1--Oil and gas fields of Kansas that have produced commercial quantities of hydrocarbons (from digitized data in Kansas Geological Survey files).
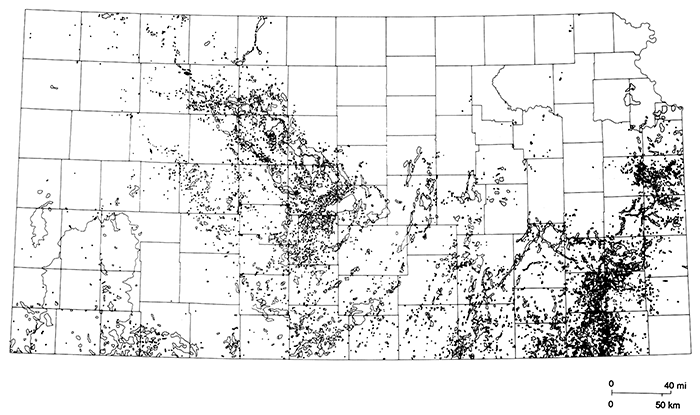
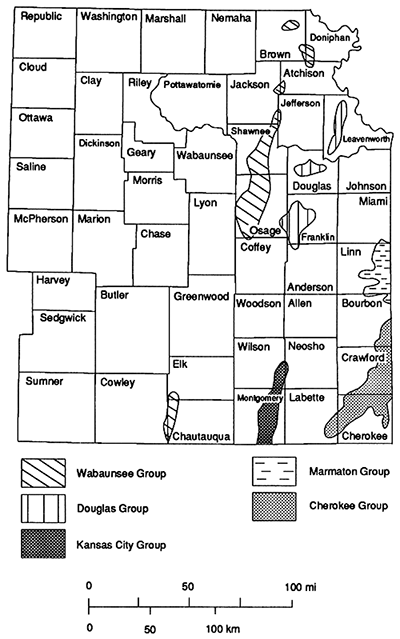
Figure 2--General distribution of strippable coal reserves by geologic group for coals under 100 or less ft (≤30 m) of overburden (from Brady et al., 1977, with permission).
It is my intent to review the underground resources that have been exploited in Kansas and briefly examine the geologic framework that has endowed those underground resources. Recent geophysical surveys in Kansas have provided additional detail in terms of fine structural analysis (seismic reflection surveys along the Nemaha Ridge), while producing new regional insights (statewide aeromagnetic survey, microearthquake recordings, and deep-crustal and upper-mantle seismic studies). An attempt will be made to put the geophysical surveys into geologic perspective and to suggest possible future directions for resource exploration in Kansas, particularly along the interbasin boundary between the Salina basin and the Forest City basin.
Cumulative oil production in Kansas through 1980 was approximately 4.9 billion barrels. Peak production was 124 million barrels in 1956 (DeGolyer and McNaughton, 1978). Production in 1979 was about 57 million barrels (State Corporation Commission of Kansas, 1979).
Correlation between fig. 1 (oil-production areas) and fig. 3 reveals that major production has come from areas in the Hugoton embayment of the Anadarko basin in southwestern Kansas and from the Central Kansas uplift in northwestern and central Kansas. In southeastern Kansas, the Pennsylvanian shoestring sands (so-called because of their linear or curvilinear traces) now provide mostly stripper production rates from wells 150-300 m (500-1,000 ft) deep. In addition to these major oil-producing areas, gas is produced from the huge Hugoton field in southwestern Kansas and from many small shallow Pennsylvanian fields in eastern Kansas. It is also contemporaneously produced with oil in many parts of the state.
Figure 3--Upper Paleozoic structural features in the midcontinent uplifts: 1) Cambridge, 2) Central Kansas, 3) Nemaha, 4) Bourbon, 5) Las Animas; Basins: a) Hugoton, b) Cherokee, c) Forest City, d) Salina, e) Denver (modified from Snyder, 1968).
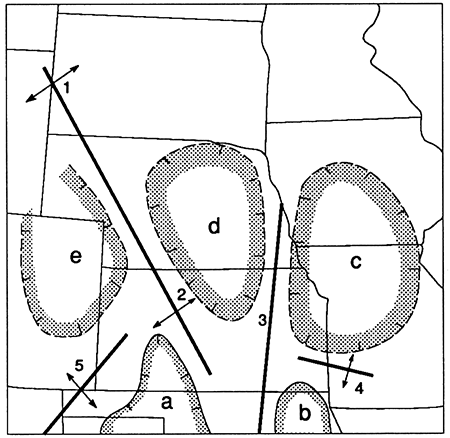
The Salina and Forest City basins have been very disappointing in terms of hydrocarbon production. If there were no production at all in these basins, it would be rather simple to merely write them off as possible hydrocarbon provinces and look elsewhere. The problem is that just enough oil has been found to tease explorationists into looking for more. This area will be discussed in more detail in the section on exploration prognosis.
The coal resources of Kansas lie primarily within Pennsylvanian units. The areas that have been or could be reasonably exploited are depicted in fig. 2. Coal seams found in Kansas are typically less than 1 m (3.3 ft) thick. Some very minor coal (or lignite) deposits have been mined from units of Cretaceous age in central Kansas. Most of the coal in Kansas has a medium to high sulfur content (commonly 3-5% sulfur). For a comprehensive discussion of Kansas coal, see Brady et al. (1977).
In addition to the energy resources mentioned above, the Tri-State lead-zinc district extends into southeastern Kansas, where it has been exploited primarily in Cherokee County with both surface and underground mining. Indeed, the mining town of Galena, Kansas, takes its name from the mineral concentrations beneath it.
Assistance and information for this paper were provided to me by many persons certainly not limited to those mentioned here.
Several graduate students assisted in some of the original research reported here, notably Tom Stander and Roger Hahn. Valuable discussions with my able colleagues at the Kansas Geological Survey were helpful, especially those with Harold Yarger, Lynn Watney, Frank Wilson, Ralph Knapp, Larry Brady, and Pieter Berendsen. John Logel of the Iowa Geological Survey and Ray Burchett of the Nebraska Geological Survey kindly provided information and references for their states. Thanks are extended to Esther Price and Cari Lillis for typing and retyping the manuscript, to Renate Hensiek, Pat Acker, Bruce Bandle for preparation and reproduction of many excellent figures, and to Dave Kvam and Anne Sheehan for searching out references and assembling the manuscript.
Within the past 20 yrs, the earth-science community has recognized that movement of material in the mantle is necessary for the formation of sedimentary basins. Geosynclines do not primarily form by the change of mineral phases to denser forms caused by pressure from deep burial. The movement of material in the mantle is evidenced by deep earthquakes, mantle hot-spot traces such as Hawaii and Yellowstone, intrusion of mafic and ultramafic rocks containing high-pressure mineral phases, and by the subduction of tectonic plates at oceanic trenches. Geosynclines and large basins are formed as responses to large-scale tectonic deformation of the crust and upper mantle. In order to comprehend basin formation and structure fully, then one must begin to examine the structure of the crystalline crust and upper mantle on the one hand and continue to examine eustatic changes in sea level and sedimentary processes on the other.
Kansas is part of the Central Stable Region (Snyder, 1968). In addition to the basins shown in fig. 3, several major geologic structures are present in the vicinity of the Salina and Forest City basins as shown in fig. 4. The Nemaha Ridge is a buried Precambrian uplift of mostly cataclastically deformed granitic rocks (Bickford et al., 1979) that extends from near Omaha, Nebraska, to near Oklahoma City, Oklahoma, and forms the division between the Salina and Forest City basins. The sedimentary rocks of the Nemaha anticline are draped over the buried ridge, as discussed in detail in this paper in the section on seismic-reflection studies. The ridge presence has been known since the early 1900's as a result of drilling (Moore and Haynes, 1917). The Central Kansas uplift forms the southern and western boundary of the Salina basin and is similar to the Nemaha Ridge in age and structural importance.
Figure 4--Structural features in the basement around the boundaries of the Salina and Forest City basins. The numbers 1-4 denote Kansas Geological Survey drilling locations for holes where geothermal gradients were measured.
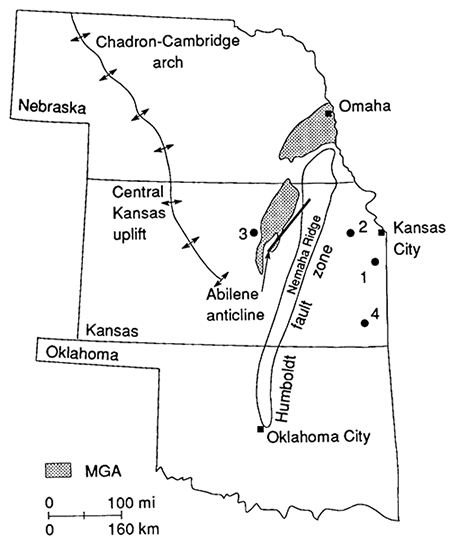
More recently, the Midcontinent Geophysical Anomaly (MGA; fig. 4) has been recognized as a representation of an important Precambrian structural feature in the Central Stable Region. The MGA extends from the Lake Superior, Minnesota, region southwestward to central Kansas and probably Oklahoma (King and Zietz, 1971; Chase and Gilmer, 1973). Yarger (personal communication, 1980), who has performed second vertical derivative calculations on his aeromagnetic data for Kansas, compiled a second vertical derivative map which shows quite clearly that the MGA continues southwestward into Oklahoma, probably as mafic dikes intruded parallel to the general strike of the northern Kansas section of the MGA. The MGA marks a thick sequence of mafic igneous rocks emplaced within a zone of major late Precambrian rifting (Ocola and Meyer, 1973). The structure is bounded by faults at the surface in the Lake Superior region, and similar bounding faults are inferred from geophysical data in the area to the south where the structure is deeply buried below younger sedimentary rocks (King and Zietz, 1971).
There are surface structures associated with the MGA in the Manhattan area. The Abilene anticline (Jewett, 1941) parallels its southeast flank (fig. 4), and the Upper Cretaceous Riley County kimberlite intrusive rocks (fig. 19) (Brookins, 1970) lie along the same structural trend. Chelikowsky (1972) believed the locations of kimberlitic emplacement are controlled by or related to right lateral strike-slip movement on a buried fault along the east flank of the Abilene anticline. The direction of movement is inferred from the rotation of rock joints in the area of the possible fault.
The relation of the kimberlites to this strike-slip hypothesis is in doubt because the long axis of the intrusions is oriented northwest-southeast, perpendicular to the axis of the Abilene anticline (Cook, 1955). This indicates that the direction of least-horizontal compressive stress was perpendicular to the Abilene anticline at the time the kimberlites were emplaced, a condition incompatible with strike-slip parallel to the Abilene anticline. The fact that directions of elongation of the kimberlite bodies are identical suggests that all emplacements occurred under similar tectonic stress conditions, possibly contemporaneously.
There are four major pre-Mesozoic unconformities and five major structural events in both the Salina and Forest City basins.
Precambrian erosional surface--In the Salina basin, the crystalline basement contact is with either the Arbuckle Dolomite or the Lamotte Sandstone (also called Reagan Sandstone to the south and west, or simply "granite wash"). In the Forest City basin, the contact is with either the Lamotte Sandstone or the Bonneterre Dolomite. Contact with the Precambrian on top of the Nemaha Ridge is generally made by Missourian rocks.
After deposition of the Arbuckle, the Arbuckle was deformed and in some places eroded, providing a beveled depositional surface for the St. Peter Sandstone. The Southeast Nebraska arch was uplifted during this deformational episode that spatially corresponded roughly with the location of the northern end of the Nemaha Ridge.
Mid-Ordovician Unconformity--In the Salina basin, the unconformity is between the Arbuckle Dolomite and the younger St. Peter Sandstone member of the Simpson Group. In the Forest City basin, the unconformity is between the undifferentiated Jefferson City Dolomite and the younger St. Peter Sandstone member of the Simpson Group.
Between the deposition of the Ordovician St. Peter Sandstone and the later deposition of Mississippian units, deformation followed quite a different scheme than that which took place after the Cambrian. What had been the southeast Nebraska arch was down warped as much as 350 m to become part of the North Kansas basin. Also during this time, the initial development of the ancestral Central Kansas uplift occurred.
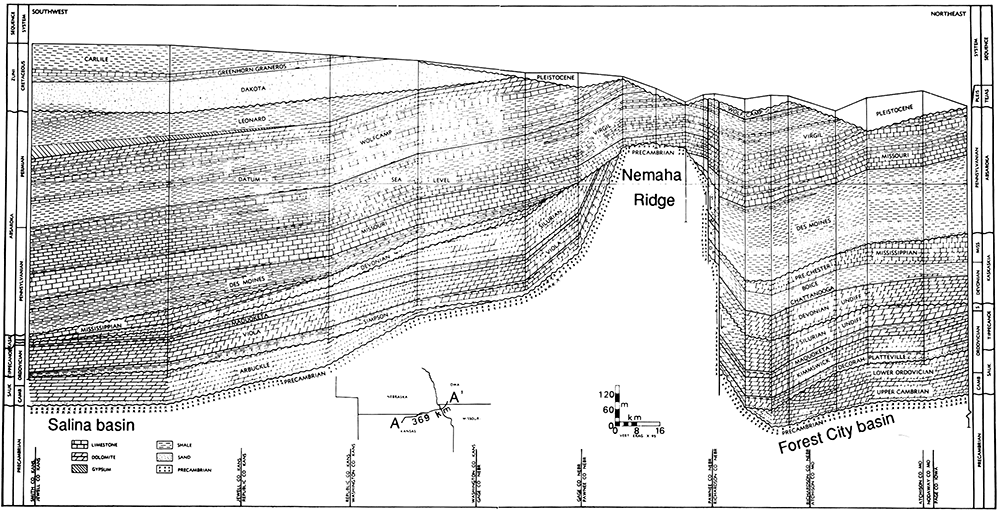
Unconformity between the Silurian and Devonian systems in Kansas--The units in contact vary from place to place, but a major unconformity is present throughout both basins. Beginning in Early Mississippian and continuing into Late Mississippian, the Nemaha Ridge was uplifted, giving rise to the development of the Forest City and Salina basins (fig. 5). Deformation and uplift continued at a much slower rate through the Pennsylvanian and the first half of the Permian. Renewed movement on the Central Kansas uplift to the west coincided with the uplift of the Nemaha Ridge.Figure 5--Cross section from north-central Kansas to southwestern Iowa (modified from Wells, 1971). (Larger version available as an Acrobat PDF).
Unconformity developed at the base of the Pennsylvanian System--This is probably the most distinctive and important unconformity in both basins; it defines the main structural elements shown in fig. 4, because uplift occurred in Late Mississippian-Early Pennsylvanian in both basins. The unconformity overlying and flanking the structural uplifts brings basal Pennsylvanian units directly into contact with rocks older than Mississippian but younger than Precambrian. Along the axis of the Nemaha Ridge and the Central Kansas uplift, Pennsylvanian units lie directly on the Precambrian surface. Subsequent structural events in much of eastern Kansas have been obscured by erosion so there is little record of them between Late Permian time and the Early Pleistocene.
Post-Cretaceous Deformation--In the Salina basin, evidence of post -Cretaceous deformation is shown by the gentle northwestward dip of the Dakota Sandstone. The late Paleozoic rocks dip gently (generally a small fraction of a degree) to the west or northwest in the Forest City basin and west and southwest in the Salina basin. This attitude is a reflection of general westward tilting maintained since these rocks were deposited.
The deep crust and upper mantle in the midcontinent have, in the absence of sufficient geophysical data, generally been assumed to be simple homogeneous media devoid of intrabasement structure. Although data-gathering and analyses are very preliminary, geophysical evidence is beginning to suggest that heterogeneities are present in the deep crust and upper mantle beneath much of Kansas.
In a preliminary analysis of a deep crustal seismic-refraction profile extending from north-central Kansas to eastern Colorado, Steeples (1976) found that the crust-mantle interface (Moho) dips about 1° to the west. The interpretation of dip on the Moho is supported by an observed linear gravity gradient of 0.25 mgal/km (gravity increasing to the east) parallel to the line of the refraction profile. The result of simultaneous interpretation of the seismic-refraction data and the gravity data is that the crust thins by about 10 km (6 mi) from about 45 to 48 km (27-29 mi) in eastern Colorado to about 34-38 km (20-23 mi) in north-central Kansas. The crustal-model interpretation derived from the refraction and gravity data is supported by travel times of microearthquake P-waves that travel eastward from southwestern Nebraska to northeastern Kansas and westward from southwestern Nebraska to near Denver, Colorado.
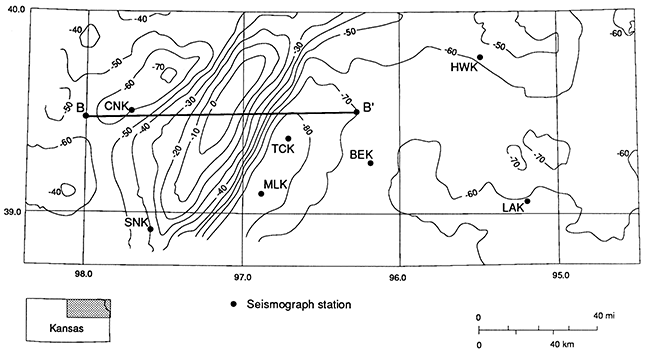
A recent study of earthquake P-wave arrivals in Kansas from events in South and Central America and Alaska and Japan (Hahn, 1980; Hahn and Steeples, 1980) suggests that a body of material in the mantle that has a lower than normal seismic P-wave velocity is present in northeastern Kansas. Fig. 6 shows a schematic cross section of this low-velocity body as deduced by Hahn (1980). Fig. 7 is a Bouguer gravity map of the general area. Although the interpretation in fig. 6 assumes that the low-velocity body is genetically related to the MGA, there may be other alternative explanations that do not relate to the formation of the MGA.
Figure 6--Crustal and upper-mantle cross section approximately along B-B'. Basalt in the upper crust is from the modeling of Yarger (1980; from Hahn, 1980).
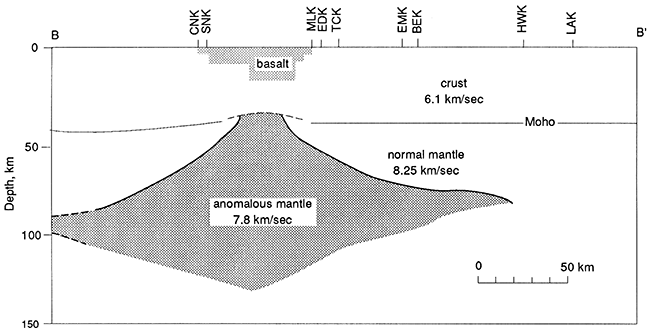
Figure 7--Bouguer gravity map with 10-mgal contours modified from Yarger et al. (1980). Seismograph stations are designated by three-letter names. Line B-B' is approximately the line of section shown in fig. 6 (from Hahn, 1980).
However, Lui (1981) has shown that microearthquake waves arriving in eastern Kansas from southwestern Nebraska along the top of the mantle are delayed as they cross the MGA, suggesting that low-velocity material is present at the top of the mantle within the MGA. Hahn and Lui reached their conclusions entirely independently of one another, so there is little question that a low-velocity body is present in the upper mantle beneath the MGA.
Preliminary interpretation of unpublished data from the deep crustal-reflection survey at Atchison and Jackson counties, Kansas, reveals reflectors in the deep crystalline basement at times of 4-6 secs and 8-10 secs, corresponding to a depth of about 12 to 15 km (7-9 mi) and 25 to 35 km (15-21 mi), respectively. These data were gathered by the Consortium for Continental Reflection Profiling (COCORP) as part of the initial phase of a set of spatially continuous deep crustal reflection surveys between Atchison County and Cloud County, Kansas. When this survey is completed, significant new data will be available to help answer detailed structural questions about the Nemaha Ridge and the MGA.
The seismic-reflection method is currently the best method of determining geological profiles along vertical planes in the earth without extensive drilling. For a very readable, non-mathematical description of exploration seismic techniques, the reader is referred to Cofeen (1978). For a more technical discussion, Dobrin (1976) or Payton (1977) are excellent. Only a very basic discussion is presented here so that the reader will be familiar with what information the seismic-record sections can convey. The records were obtained from echoes of sound energy that penetrated from a controlled source on the earth's surface downward to rock-layer interfaces and back to the surface. At the surface, the sounds were detected by low-frequency geophones and recorded on digital computer tape in a recording truck. Data were arranged and enhanced for display by modern digital signal-processing techniques (see, for example, Robinson and Treitel, 1980). The index map (fig. 8) and the data are displayed in standard seismic record-section format (figs. 9-12 and fig. 14).
Figure 8--Index map for seismic lines A, B, C, D of figs. 9-12 with traces of major faults shown. Location is in east-central Nemaha County, Kansas, along east flank of Nemaha Ridge.
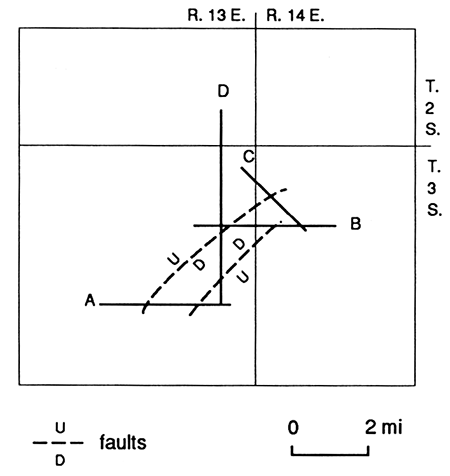
Figure 9--A, Seismic-record section of line A, fig. 8. B, Interpretation of record section of fig. 9A. Note graben in center third of seismic line.
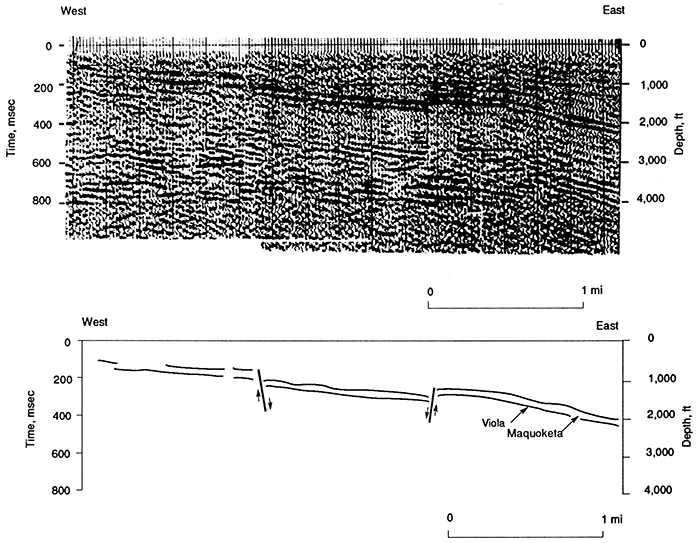
Figure 10--A, Seismic-record section of line B, fig. 8. B, Interpretation of record section of fig. 10A. The fault at the center of this figure is of indeterminant direction of movement. Note that the three prominent basal reflections at the east end of the line are reduced to two reflectors west of the indeterminant fault.
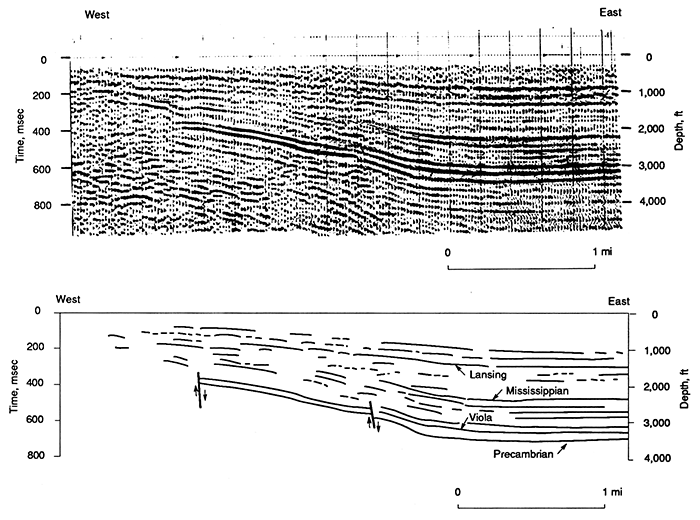
Figure 11--A, Seismic-record section of line C, fig. 8. B, Interpretation of record section of fig. 11A.
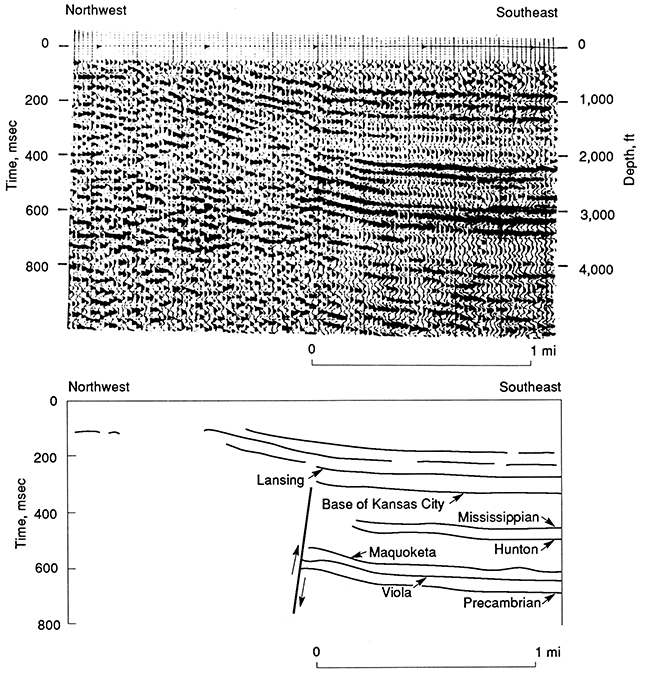
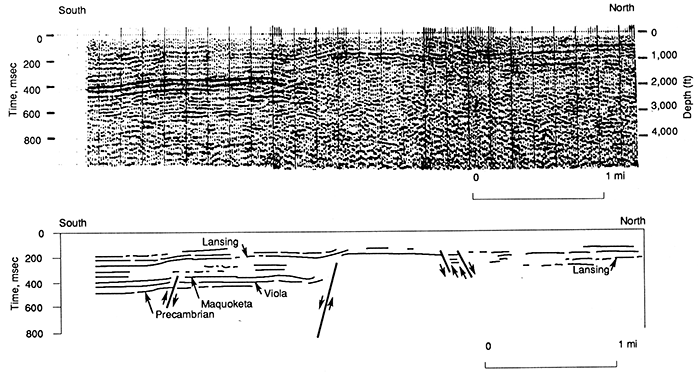
Figure 12--A, Seismic-record section of line D, fig. 8. B, Interpretation of record section of fig. 12A.
For the reader who may not be experienced in the interpretation of seismic-record sections, a brief explanation follows. One simple way to regard such sections is to think of them as pseudo-roadcut. In other words, when one looks at a record section, it is analogous to going to the field and looking at rocks in cross section in a road cut. In the case of the record sections in this paper (figs. 9-12 and fig. 14), the pseudo-roadcut analogy involves a roadcut a few miles long and 2,500-5,000 ft (750-1,500 m) deep. High-amplitude positive reflections are enhanced with the data-plotting system by blackening the peaks. This result is that the tops of limestones and dolomites are represented by black bands in much of the section (Viola, Mississippian, Lansing, for example). Whether the top of a particular rock unit is represented by a rightward (positive) reflection kick blackened on the records or by a leftward (negative) reflection kick not blackened on the records is determined by the density and velocity (i.e. acoustic impedance) of that particular rock unit relative to the rock unit above it.
With the above explanation in mind, interpretation then becomes a matter of tracing out continuous blackened peaks that represent geologically significant units (in this case, limestones). Judging what is a geologically significant reflection is something of an art best learned by experience. On some record sections, however, it is not difficult for an inexperienced interpreter to detect faults or changes in dip by using the pseudo-roadcut analogy. Let us use the roadcut imagination technique to interpret the seismic-record sections in this paper.
Figs. 8 and 13 show the general location in east-central Nemaha County of seismic profiles A, B, C, and D shown in figs. 9-12. Also shown in fig. 8 are the traces and directions of throw of faults interpreted from the seismic profiles. These data were gathered by a Vibroseis and have been processed by modern computer techniques prior to plotting in roadcut-type record sections.
All of the record sections are accompanied by my interpretation of their more obvious features. The attachment of formation names to particular reflectors was made possible by the use of synthetic seismograms calculated by Stander (1981) for his thesis. The synthetic seismograms were generated from geophysical logs at the Edelman #1 well in Nemaha County, Kansas, and they show what a theoretical reflection seismogram should look like, given the physical parameters of rocks as measured in the borehole. Visual correlation was made between the theoretical reflection seismograms where formation names were known and the observed seismograms of figs. 9-12 where formation names were unknown.
Several features permeate all four of the profiles:
Pertinent features of the four profiles are discussed individually in the following paragraphs.
Profile A (fig. 9A) shows the previously mentioned graben better than any other profile. The Viola shows a generally eastward dip of about five degrees along the length of the profile. The Humboldt fault does not seem to be present on this record section.
Profile B (fig. 10A) is very instructive with respect to deformation of the Nemaha during Pennsylvanian time. Note in particular that as one progresses from east to west, the time between the Lansing reflection and the reflection from the top of the Mississippian deceases by about 60 msec. This implies thinning of the rock section by roughly 100 m between the top of the Mississippian and the Lansing. There are three ways for this thinning to have occurred:
I prefer a combination of the second and third possibilities because there does not appear to be evidence of a major erosional unconformity during the Pennsylvanian. For the third possibility to be valid, uplift would have to be concentrated in a very short time period just prior to the beginning of Pennsylvanian deposition. There is apparently a nearly flat-lying layer resting unconformably on the top of the Mississippian at a depth of about 1,000 ft starting 1 1/4 mi (2 km) west and ending 1 1/2 mi (2 1/2 km) west of the east end of profile B. This certainly implies onlapping beds, if not deposition of sandy or cherty gravel from nearby from the top of the Late Mississippian or Early Pennsylvanian Nemaha Ridge to the west. The lack of similar onlapping layers in other areas of the four profiles suggests uplift contemporaneous with deposition of Pennsylvanian sediments. Continuous or sporadic uplift during the Pennsylvanian also is suspected because of the draped Pennsylvanian sediments over the Nemaha Ridge that do not display extensive faulting. There also are channel sands in the Pennsylvanian section in the Nemaha-Pottawatomie County area (locally known as Indian Cave Sandstone Bed) that may represent outwash from the Nemaha Ridge.
Another significant area can be noted near the center of profile B at a depth of 2,500-3,000 ft (750-900 m). Note that three continuous black reflectors at a depth of 3,000-3,300 ft (900-2,490 m) at the east end can be followed westward to near the center of the profile, at which point the continuation only contains two black reflectors. A fault is obviously at that location. It is impossible without either drill evidence (preferably) or additional seismic profiling to tell which of the three reflectors was not deposited or, alternatively, was eroded away. It is also impossible to tell which side of the fault moved up and which side moved down. If one chooses to match the bottom reflector, the west side apparently moved up. On the other hand, if one chooses to match the top two reflectors, the west side moved down. The presence of the graben on two other profiles and its location in fig. 8 would suggest downward movement to the west. The arrow in fig. 10B for this particular fault should be viewed with suspicion and, in fact, is inconsistent with the direction of movement implied by the graben. (The presence of the graben is not in question.) The inconsistent direction of the arrow is a reminder of the questionable interpretation.
Profile C (fig. 11A) shows the existence of a nearly vertical fault with a throw exceeding 1,500 ft (450 m). This is a beautiful example of lower Paleozoic sediments truncating abruptly against the Precambrian granite of the Nemaha Ridge. The interpretation shown suggests reverse faulting, although it is possible that a vertical brecciated zone is present in the vicinity of the fault rather than a true reverse fault. It would be difficult to try to interpret this fault as anything other than high-angle reverse or vertical. Again, we see draping of the Pennsylvanian sediments over the granite in the Nemaha Ridge.
Profile D (fig. 12A) shows the graben very clearly as well as the draping of the Pennsylvanian units over the top of the Nemaha Ridge. Again, a substantial throw of more than 1,000 ft is present at the edge of the ridge. A small horst is interpreted to be present about 2 mi (3 km) south of the north end of this profile. There is clearly some structure in that area, although the horst interpretation is not indisputable.
Fig. 13 is an index map for Nemaha County and for the seismic-record section displayed in fig. 14A. Both figures are from Stander (1981). These data were gathered by students from the geophysics program at the University of Kansas with support and supervision from the Kansas Geological Survey. The data were recorded with a MiniSOSIE recording system, a technique that adds signals from 1,000 or more impacts from an engine-driven earth compactor. The energy input to the ground was sufficient to detect reflections from 400 msec representing penetration depths of about 2,000 ft (600 m).
Figure 13--Index map for fig. 14 seismic-record section northeast of Bern, Nemaha County, Kansas.
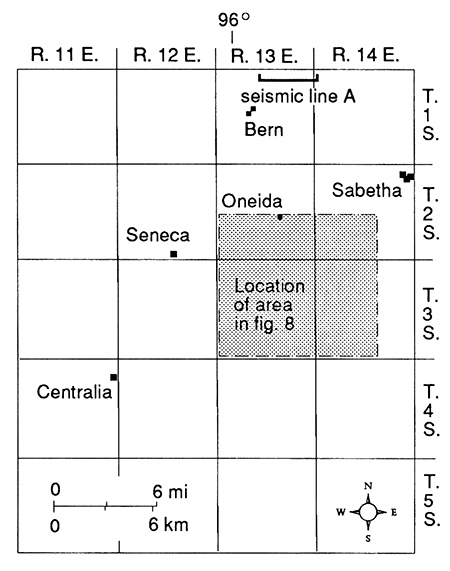
Figure 14--AHigh-resolution shallow seismic-record section of the east flank of the Nemaha anticline, 1 mi (1.6 km) south of the Nebraska Border in Nemaha County, Kansas (from Stander, 1981). B, Interpretation of seismic-record section of fig. 14A (from Stander, 1981).
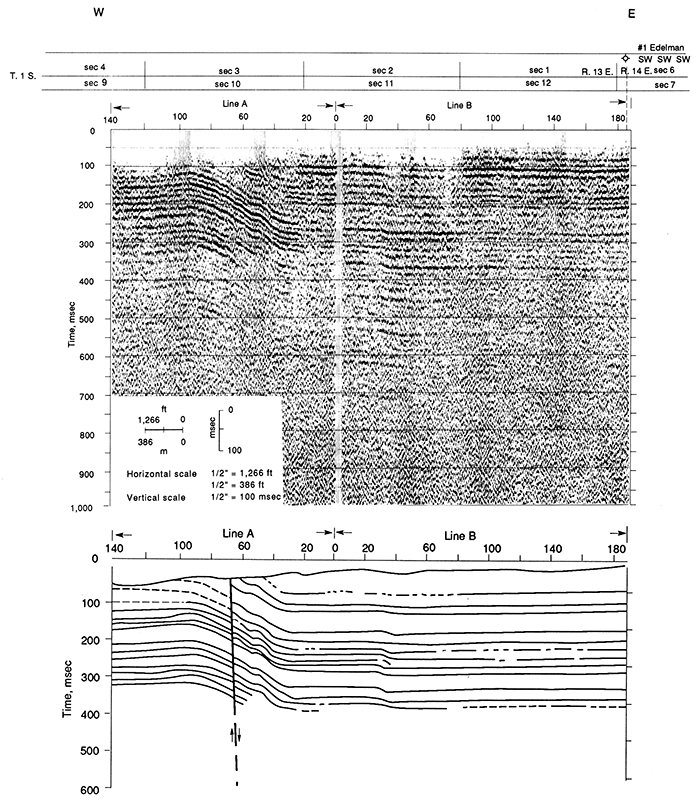
Fig. 14B shows Stander's (1981) interpretation of the seismic data displayed in fig. 14A. Note that the Pennsylvanian sediments are draped over the edge of the Nemaha Ridge. Note also the energy penetration was not sufficient to show the Humboldt fault which runs beneath the western third of the area represented in fig. 14A.
The interpretation of the line in fig. 13 is divided into three sections: Forest City basin, Humboldt fault zone, and Nemaha Ridge. In fig. 14B the shotpoint locations for lines A and B are listed along the top of the figure. The interpretation is tied to these shotpoint numbers and is based on discussion by Stander (1981). He prepared synthetic seismograms for the Edelman #1 well at the east end of line B and identified specific units by name and correlation between the synthetic seismograms and the actual seismograms.
Stander identified four principal reflections at the east end of line B: 1) Admire Group at 105 m (346 ft), 2) Tecumseh Shale Group at 180 m (594 ft), 3) the Drum-Dennis Limestones at 285 m (940 ft), and 4) top of the Cherokee Group at 375 m (1,237 ft). In addition to these units, nearly 40 other limestone and shale units averaging about 15 m (49 ft) in thickness are resolved on the section. The rock units are nearly flat-lying between shotpoints 187 and 35 on line B. A small monocline with about 12 m (40 ft) of vertical offset is present between shotpoints 24 and 35. Looking to the west of shotpoint 25 (line B), the rock units are again flatlying until one reaches shotpoint 25 of line A at the west edge of the basin.
The Humboldt fault zone begins near shotpoint 25 on line A and ends near shotpoint 95 on line A. For the 1.1 km (.7 mi) distance between these two shotpoints, the rock units above the base of the Kansas City Group have an average apparent dip of 11° eastward. At the east side of the fault zone, between shotpoints 40 and 50, an apparent dip of 23° permeates the entire section cropping out at the surface where DuBois (1978) measured 19° of dip on Permian rocks in the Council Grove Group. Westward from shotpoint 50, a flat bench is present until one reaches shotpoint 55 where an eastward dip of 12° begins and continues smoothly up to the crest of the ridge at shotpoint 95, interrupted only by a small vertical fault. At the crest of the ridge, gentle dips are present throughout the section, and DuBois (1978) measured dips of 2° on ledges of the Wakarusa and Reading limestones.
The small fault interpreted at shotpoint 68 has about 7 msec of time offset, corresponding to about 12 m (40 ft) of throw. DuBois (1978) estimated 50-75 m (165-250 ft) of throw in the Permian section, depending upon the actual dip at depth. It is entirely possible that field recording and processing with multi-fold common depth point (CDP) methods have obscured part of the faulting and explain part of this apparent discrepancy in throw.
Without question DuBois made a correct estimate of the surface trace of the fault, based on her surface mapping. When members of the KGS seismic-reflection crew were doing some earlier reconnaissance work in the vicinity of the fault, they discovered a discontinuity of several meters in the water table while drilling shot holes within the area where DuBois postulated the fault trace to be. Closer investigation of the water table revealed that the fault trace runs north-south just a few meters west of the drainage axis (marked by a culvert on the road) of a small valley in the center of DuBois' postulated area.
To the west of shotpoint 95 of line A, the Pennsylvanian rocks lie unconformably on the granite of the Nemaha Ridge. In actuality, the rocks probably dip slightly to the east at the west end of line A, but the data-processing techniques probably introduced the gentle apparent westward dip.
In summary, interpretation of lines A and B reveals one primary zone of displacement perhaps 200 m (660 ft) wide over the Humbolt fault zone. To the east and west of the fault zone, the sediments are relatively undisturbed and flatlying. There is no question that post-Permian movement occurred in the Humboldt fault zone, although the displacement (less than 75 m [250 ft]) is minor compared to displacement that occurred between the Late Mississippian and Early Permian.
The structure associated with the east flank of the Nemaha anticline is extremely varied and complex as shown in figs. 8-14. I present here only a very small amount of the seismic data from surveys that have been performed by industry and the Kansas Geological Survey. Yet this small amount of data has indicated grabens, horsts, monoclines, normal and possibly reverse faulting, and in general a very revealing insight into the structural diversity along the west edge of the Forest City basin.
Although the best tool presently available (except for drilling) for site-specific evaluation of hydrocarbon potential generally is seismic reflection, other geophysical tools can be extremely useful in regional evaluations. Other geophysical studies underway at the Kansas Geological Survey include the early stages of the statewide gravity survey, a geothermal energy evaluation, microearthquake recording, and the latter stages of statewide aeromagnetic analyses.
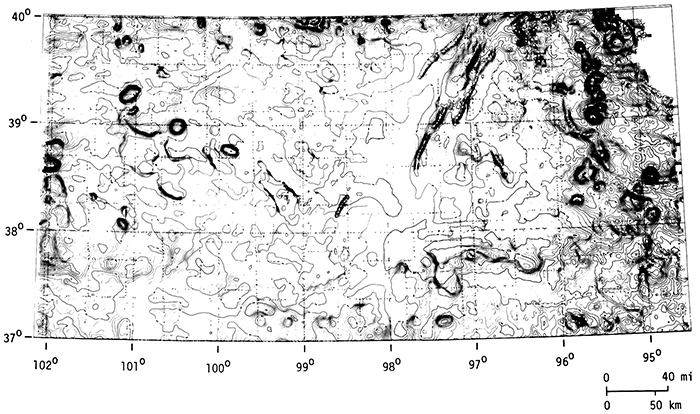
The aeromagnetic map (Yarger et al., 1980; fig. 15) was produced from east-west flight lines spaced 2 mi (3.2 km) apart with north-south tie lines spaced 20 mi (32 km) apart. This aeromagnetic map is a powerful tool in the indirect study of basement rocks in Kansas. Brief discussion of the more prominent features is included in the following paragraphs. Because this map is, in a crude sense, an estimate of magnetite content in the crust, strong magnetic gradients infer either geologic structure or changes in mineral composition, usually in the crystalline basement. The map may, therefore, be used to guide exploration of the basement and often to infer the approximate trace of faults.
Figure 15--Aeromagnetic map of Kansas; computer contoured at Kansas Geological Survey with 50-gamma contour interval (from Yarger et al., 1980).
In the northeastern part of the state, several intense circular magnetic highs are present, collectively called the Big Springs anomaly. They are about 10 mi (16 km) across and commonly have positive magnetic signatures of about 1,000 gammas. Holes have been drilled to the basement, and Precambrian-age cores have been recovered from two of these circular anomalies (Steeples and Bickford, 1981). Bottom-hole cores from both localities are granites that contain substantial magnetite (roughly 2% by weight). The granite from the Miami County locality is course-grained, whereas the granite from the Douglas County hole is medium-grained. Both rocks are substantially younger than the surrounding Precambrian crust, which is primarily composed of cataclastically deformed granite approximately 1,630 m.y. old (U/Pb ratios in zircons, Bickford et al., 1979). The rock in the Miami County core is 1,361 ± 6 m.y. old, and the rock in the Douglas County core is 1,339 ± 12 m.y. old, based on U/Pb ratios measured by Bickford (Steeples and Bickford, 1981). These two drill holes, together with other samples now being analyzed by Bickford, suggest a suite of previously unrecognized igneous intrusions that occurred in Kansas after most of the present Precambrian surface had crystallized.
More than a dozen circular anomalies are present with size and shape similar to the two drilled localities. The intrusion of granitic material at several or all of these sites is probable; they are likely to be favorable localities for deposition of ore minerals or even the formation of petroleum. This will be discussed more fully in the exploration prognosis section. Preliminary analyses of COCORP data gathered over the top of one of these anomalies in Atchison County do not reveal any significant deep basement structure that is detectable by seismic methods.
Another prominent feature on the aeromagnetic map is the MGA which enters Kansas from the northeast in Marshall and Washington counties and extends southwestward through Clay and Riley counties into Saline and Dickinson counties. As discussed earlier, the MGA is a rift system that extends both northeast and southwestward from the above-mentioned counties.
In Sedgwick, Butler, and Greenwood counties is a large magnetic low called the Wichita low (Yarger, 1981). The source of the Wichita low is not yet known, although drill evidence suggests it must be at a lower elevation than the Precambrian surface (Bickford et al., 1979). The low could be caused by reversely magnetized rock, by non-magnetic intrusions such as anorthosite, or by a basin filled with Precambrian sediments and overlain by volcanic material of Precambrian age. The second vertical derivative aeromagnetic map prepared by Yarger (personal communication, 1980) suggests that the Wichita low is part of an east-west trend of lows that runs all the way across Kansas and into Colorado and Missouri. Yarger (1981) has discussed the possibility that this trend of lows represents an important Precambrian crustal-plate boundary. A series of seismic-refraction and reflection lines run across the Wichita low in the future could narrow the number of alternative explanations, although these experiments are not explicitly planned at this writing.
There are numerous circular anomalies in western Kansas and linear trends that parallel the Central Kansas uplift. The basement is substantially deeper in western Kansas, and magnetic signatures are less striking. There is a magnetic low that trends northwest from Smith County through Phillips County into Nebraska. It is not presently known what the feature represents or how far it extends into Nebraska.
One interesting feature that suggests possible block faulting in the basement is the trend of strong magnetic gradient that extends from east-central Wabaunsee County past the southwest corner of Shawnee County into central Osage County where it makes a right-angle turn toward the southwest. This "Osage elbow" then extends southwestward through Osage County and into Coffee County where it dies out against the northeastern part of the Wichita low. This feature may have some exploration potential as discussed later.
Yarger (personal communication, 1980) has noted that both the Salina basin and the Forest City basin have rather large circular magnetic highs near their centers. In the Salina basin, a 400-gamma high 60-80 km (35-50 mi) in diameter is present in Cloud, Mitchell, Jewell, and Republic counties. In the Forest City basin, a 600-gamma high 50-60 km (30-35 mi) in diameter is present in Atchison, Brown, and Doniphan counties, possibly extending slightly into Nebraska and Missouri. It is not presently known what, if any, structural significance can be attributed to the magnetic highs near the centers of the basins.
The gravity map in fig. 16 is a preliminary version of a map by Yarger et al. (1980) that does not show gravity-station locations. The map shows the MGA in a very conspicuous fashion, along with the gravity lows that border the MGA on both flanks for almost its entire length. As discussed earlier, the MGA itself is caused by extensive mafic intrusions. The flanking gravity lows are caused by the presence of the Precambrian Rice Formation, a thick section (as much as 10,000-15,000 ft [3,000-4,500 m]) of clastics whose deposition was associated with erosional processes during and after the major rifting episode. The thickness and extent of the Rice Formation will be more tightly constrained by the interpretation of the COCORP seismic line within the next couple of years.
Figure 16--Gravity map of northeast Kansas with Kansas Geological Survey microearthquake locations plotted to show relation of seismicity to bounding faults of MGA (from Yarger et al., 1980).
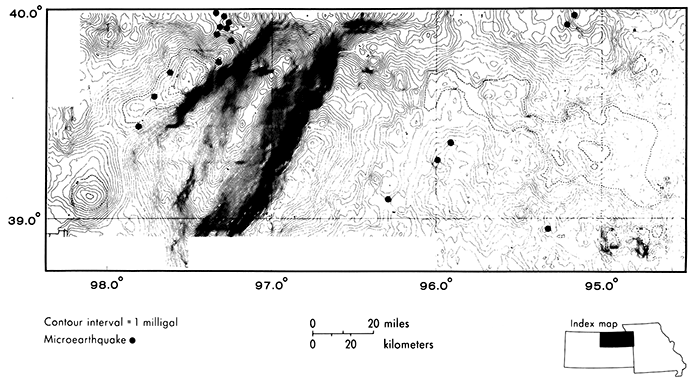
There is some evidence that the Humboldt fault zone is related to the very strong gravity gradient at the Kansas-Nebraska border (400N latitude) between 95.9° and 96°W longitude. That particular high-gradient trend swings to the west about 10 km (6 mi) south of the Nebraska border, suggesting either that the Humboldt fault zone has a branch, which swings to the west, or that the high-gravity gradient is only indirectly related to the Humboldt fault zone.
There is a gravity low of unknown origin that extends from about 29.1°N latitude by 94.8°W longitude to 39.7°N latitude by 96.0°W longitude. It is noteworthy that the high-amplitude aeromagnetic anomalies (i.e. Big Springs anomaly) that were drilled to basement do not have positive gravity signatures. As mentioned previously, these anomalies were caused by the unusually high magnetite content in the granite rather than by a mafic rock with both high density and high magnetic susceptibility.
It is expected that a statewide gravity map of Kansas contoured at 1-mgal level will be available by about 1989. The map will be a valuable asset in analyses of basement structure and tectonic features.
Recent efforts have been made at the Kansas Geological Survey to evaluate the geothermal regime within the state. Initial steps have been taken to construct a geothermal map of Kansas from oil- and gas-well geophysical log temperatures combined with thermal logs run by members of the Survey and the personnel in Dr. David Blackwell's laboratory at Southern Methodist University. Although the map is not yet complete, some data are available, which are representative of typical geothermal gradients.
As part of a hydrological study of the Arbuckle Formation, the Kansas Geological Survey participated in the drilling of four holes to the Arbuckle at locations noted in fig. 4. Preliminary thermal logging has been performed on all four holes by personnel from Blackwell's laboratory. The thermal logging equipment was not capable of reaching the bottom of the holes, so these data should be considered preliminary pending results from deeper logging. Samples of core or well-cuttings have been sent to Blackwell's laboratory for thermal-conductivity measurements. The following geothermal gradients have been measured to date in the four holes drilled on this project (table 1).
Table 1--Geothermal gradients.
| Location | Gradient (°C/km) | Depth logged (m) |
|---|---|---|
| Douglas County | 30.3 | 565 |
| Labette County | 28.5 | 520 |
| Miami County | 36.0 | 395 |
| Salina County | 30.7 | 565 |
Preliminary data from Blackwell indicate an unusually high rate of radioactive-heat generation, about 11 heat-generation units--1 HGU = 1 x 10-13 cal/gm/sec--in the core from the Miami County hole, compared to 5-6 HGU for typical granites. These heat-generation data imply the presence of higher than normal concentrations of uranium, thorium, and potassium, or at least one or two of these elements.
During the period from 1867 to 1977, there were at least 25 earthquakes felt that had their epicenters in Kansas (DuBois and Wilson, 1978). These earthquakes are an indication that some tectonic features in Kansas are still slightly active. In order to better evaluate present-day tectonic activity, a microearthquake earthquake network was established by the Kansas Geological Survey in 1977. (A microearthquake is defined as an earthquake that is too small to be felt by humans. This is generally a Richter magnitude of less than 3.)
The station locations are shown on the base map of Kansas (fig. 17). Microearthquakes recorded between October 1, 1977, and October 1, 1980, are plotted on a basement fault map of Kansas in fig. 18. A total of 58 microearthquakes are plotted with magnitudes ranging from 1.3 to 3.3. In general, the locations correspond to zones of major structural deformation in the basement.
Figure 17--Base map of Kansas with county names. Dots show locations of Kansas Geological Survey seismograph stations.
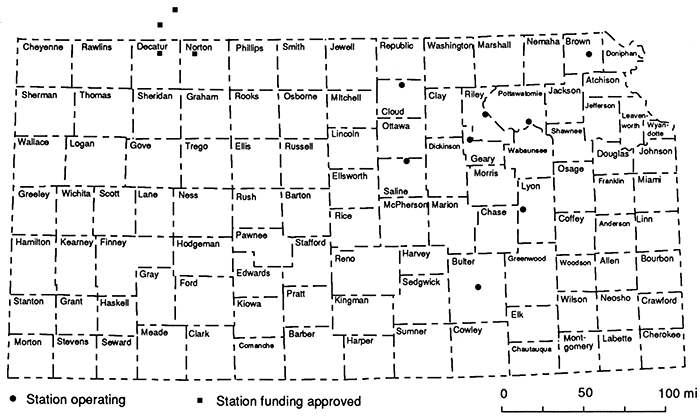
Figure 18--Microearthquakes and faults located by Kansas Geological Survey between December 1977 and October 1980. Riley County kimberlites shown by stars. (Thousand-foot structural contours on basement and faults after Cole, 1976.)
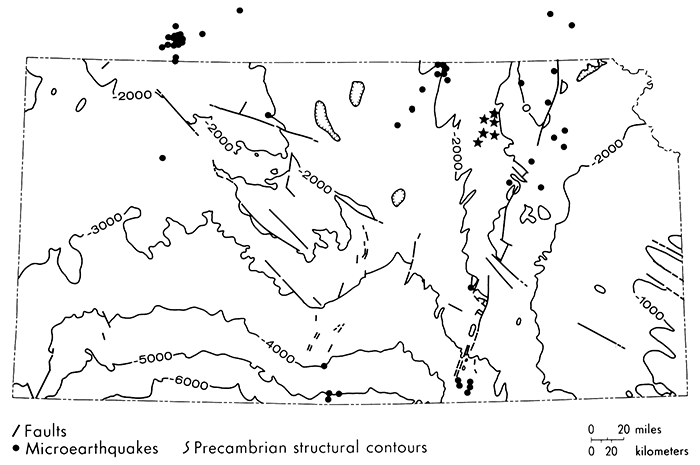
Several microearthquakes have occurred along the Nemaha Ridge during the recording period. The pattern of epicenters shows that many faults have experienced slight movements rather than the earthquakes being confined to a single fault. These data further support the idea that there is a zone of deformation around the Nemaha Ridge(the Humboldt fault zone) and that many faulted structures are present in the vicinity of the ridge.
Some of the faults of the Central Kansas uplift also have shown activity during the recording period. Several of the events clustered just across the Nebraska border from Decatur and Norton counties have been felt with Modified Mercalli intensities as high as MM IV. The area of activity is coincident with the Sleepy Hollow oil field, the largest producing field in Nebraska. It is not yet clear whether the structures are oriented in a direction and location favorable to present-day tectonic earthquake activity or if the earthquakes may for some reason be induced by secondary oil recovery by water-injection. If the water-injection is causing the earthquakes, then one could ask why similar injection operations in Kansas do not induce earthquakes. These questions will not have answers until more detailed recording is done along the Central Kansas uplift to establish reliable focal depth and better magnitude versus frequency of occurrence plots.
Another interesting set of microearthquakes has occurred in Washington, Republic, and Cloud counties. These events are also plotted in fig. 16 to show their genetic relationship to the MGA. Cole (1976) did not show any basement faults in this three-county area on the Precambrian basement map of Kansas, but he did show a northeast-southwest-trending anticlinal feature. The combination of microearthquakes and aeromagnetic and gravity modeling by Yarger (1980) demonstrates that there are basement faults in this area.
There also are several events plotted in Barber County. These events, combined with the events along the MGA and the basement faults between them, form an apparent linear structural trend 130-150 km (80-90 mi) west of and parallel to the Nemaha Ridge. The genetic relationship of these two structural trends is not yet clear, but previously mentioned aeromagnetic evidence by Yarger (personal communication, 1980) suggests that the western trend is related to southward extension of the MGA into Oklahoma.
In summary, the microearthquakes show that tectonic activity in the midcontinent continues today and that most of the major fault-related structures can be outlined by plotting microearthquake activity for a few years. The trends of microearthquake activity also define zones in the basement, where sufficient fault-related permeability might exist to allow the circulation of fluids from the deep crust. I believe that this may be an important key to evaluation of mineral and petroleum potential in relatively unexplored areas in the midcontinent.
In the exploration for both petroleum and other minerals, there is often a gray area in defining whether one has discovered a resource or not. In other words, something might not be considered a resource at two dollars per barrel (or ton or whatever), but at $50 per barrel, it might be considered an attractive resource. As mentioned earlier, the Salina and Forest City basins have produced just enough oil to make industry look for more. Let us examine some of the possibilities concerning the presence or absence of oil in these two basins and what might be done to search for an increasingly attractive resource.
There appear to be three possibilities to explain the nonexistence of petroleum resources in the basins in the geologic present: 1) The resource has formed at some other place but has not migrated to the basins. In other words, the basins have never had a resource. 2) The resource formed in the basins, but migrated away horizontally and/or vertically. 3) The resource has not yet had the proper physiochemical conditions to form in the basins even though favorable initial conditions are present.
I will discuss these possibilities for the Salina and Forest City basins. In addition, I will propose a new hypothesis to explain the existence of small petroleum deposits in both basins as follows: the petroleum was formed locally within the basins and the formation was controlled by local increases in the geothermal gradient, probably during the Cretaceous. This hypothesis also has ramifications for future exploration for metallic minerals.
In a classic paper, Walters (1958) presented convincing evidence that much of the petroleum in the central and southern parts of Kansas migrated northward from a source area in Oklahoma. He pointed out that if the migration process is slow enough for oil to segregate by density in structural traps between repeated episodes of structural tilting, the high-density (low API gravity) oil would be the first to spill out from beneath structural traps. This provides gas accumulations in southern Kansas, with gas-oil combinations in central Kansas and heavier oils on the southwest flanks of the Central Kansas uplift.
He suggested that the oil never migrated northward into the Salina or Forest City basins. This is not a complete answer for the basins, however, because some commercial petroleum production has occurred. If the petroleum never migrated into the basins, as proposed by Walters, then the above second and third possibilities must be considered.
Some petroleum has been produced from lower Paleozoic rocks in the basins, but I am not aware of evidence suggesting that major petroleum resources formed in either basin and then migrated away. There is no nearby petroleum province that has a gas-light, oil-heavy oil progression pointing back to either basin. However, it is possible that major amounts of petroleum could have been totally flushed out and washed away during one of the erosional episodes of the Paleozoic era. The basins have never been subjected to the deep burial that was experienced by the Anadarko basin in Oklahoma. It is likely that the small deposits of petroleum found in the early Paleozoic-age rocks in the two basins formed as a result of locally favorable conditions within the basins themselves and that part of the oil was lost from the structures with subsequent tilting events, because the early and mid-Paleozoic oil-bearing structures in the Forest City basin typically are only about 60% full to structural closure (Lynn Watney, oral communication, 1980).
I believe that all of the observed oil production in the two basins can be explained by the third possibility. It is well established in the literature that formation of petroleum deposits requires the heating of hydrocarbon-bearing sediments for periods of 10 m.y. to 100 m.y., depending upon the degree of heating and chemical makeup of the sediments. It is generally thought (for example, see Tissot and Welte, 1978) that the majority of petroleum is formed at temperatures of 50°-70°C, temperatures normally found in the midcontinent at depths of 1.0-1.5 km (3,000-5,000 ft).
Many of the early and middle Paleozoic sediments and most of the late Paleozoic sediments have probably never experienced burial deep enough to encounter normal geothermal-gradient temperatures high enough for the formation of petroleum. However, there are likely to have been episodes of localized heating in the upper crust caused by fluid circulation upward from depths sufficient to provide the necessary heat for considerable periods of time. This may sound like a radical suggestion for the midcontinent and Central Stable Region, so it is necessary that I present some evidence to support the hypothesis of localized heating.
Most importantly, there is no question that some sort of thermal event occurred in Kansas after the deposition of Permian sediments, probably during the Cretaceous. The Riley County kimberlites were probably intruded about 100 m.y. ago (Brookins, 1970). Even though kimberlites are a relatively low-temperature type of igneous intrusion, they establish a path for hot fluids from the mantle. While the kimberlites themselves probably do not bring along sufficient heat from the mantle to cook large amounts of petroleum, no one knows how much hot fluid entered the crust during the few million years following kimberlite intrusion. The intrusion of kimberlites implies high fluid pressures for a period of time in the mantle prior to the actual intrusion. For a period of time after the intrusion, fluid flow must occur within the mantle to reestablish equilibrium. This allows for fluid penetration into the crust for some indeterminate length of time following initial intrusion.
Kimberlite swarms worldwide typically occur as groups of dozens of intrusions rather than as a small group like the six known occurrences in Riley County. This suggests that there may be many more kimberlites in the north-central and northeastern parts of Kansas that have not yet been discovered. There is potentially a large amount of heat in isolated localities that could have come into the upper crust episodically during the Cretaceous.
Further evidence of a thermal event in Kansas during Cretaceous time comes from two sources. The Rose dome in Woodson County has an occurrence of Precambrian granite intruded into Pennsylvanian sediments, indicating high-pressure intrusion in the solid state. The nearby Hills Pond peridotite, which is intruded into the same sediments, again represents mantle-type material that is intruded into the upper crust. These events are also thought to be Cretaceous in age (Zartman et al., 1967).
Possible indirect evidence for a larger thermal event in the area of the basin comes from a proposed mantle hot spot traced west to east across North America (Crough et al., 1980). They proposed that most, if not all of the world's kimberlites are related to the passage of the emplacement area over the top of a mantle plume (hot spot). They believe that the kimberlites in North America become generally younger to the east because of the westward passage of the continent over the top of a hot spot or plume (Morgan, 1972) that is fixed in place in the deep mantle. The proposed hot spot is now beneath the Bermuda area in the Atlantic ocean.
The passage of a mantle hot spot beneath eastern Kansas would have taken on the order of 10 m.y., depending upon the effective diameter of the hot spot and the tectonic velocity of the North American continent relative to the hot spot. While the Riley County kimberlites are concrete evidence of the thermal event, the proposed hot-spot track should be considered as intriguing but tentative evidence at this point.
The hydrocarbons of the basins have been studied in a very preliminary manner by A. C. Cook, who examined vitrinite reflectance of some well samples in the two basins as well as in other parts of Kansas. The oil-generation zone for vitrinite reflectance is commonly thought to be 0.5-1.0%, although some oil has been found in both Germany and Australia where vitrinite reflectances as high as 1.3% were present in rock samples. Cook had samples from limited vertical extent of the rock section, so no indication of vertical rank is available. The following quote sums up the preliminary work of Cook (1977): "From preliminary information obtained on vitrinite reflectivity, it appears probable that a large part of the Pennsylvanian succession in northeast Kansas is too immature for oil to have been generated."
Again, we come back to the fact that some oil has been generated and produced in the two basins. I have proposed above that localized heating during a Cretaceous thermal event formed some small deposits of petroleum. Let us look at the ramifications of this proposed explanation in terms of future oil exploration.
To some degree, the hypothesis set forth in the previous section is testable in practice. It suggests that oil should be found in or near localities where permeability (or at least fractured rock) exists in the crystalline basement, providing pathways toward the surface for fluids from the crust and upper mantle. We should then expect to find oil associated with kimberlites and/or major fault zones, at least in the general sense.
That is, in fact, exactly the case as can be seen on the oil-field map of fig. I. There are several small fields in southeastern Clay County within 15 km (9 mi) of the known kimberlites of Riley County (shown in fig. 19). The boundary faults of the MGA are also in the same vicinity (Yarger, 1980). The oil fields of Nemaha, Brown, Pottawatomie, Jackson, and Wabaunsee counties are all located within 15 km (9 mi) of the Humboldt fault zone. The pattern of microearthquakes (fig. 18) certainly shows that faults are present that have not yet been mapped. Also, the seismic record sections in figs. 9-12 show that there is plenty of complex structure present, rather than a single Humboldt fault. The microearthquake data suggest that a zone of deformation 40 or 50 km (25-30 mi) wide is present along the east flank of the Nemaha Ridge. I propose that faults in this whole zone of deformation have the potential to have assisted in the movement of hot fluids to the surface, possibly producing isolated deposits of petroleum.
Some sizable oil fields are present in central and south-central Saline County. These oil fields exactly overlie strong aeromagnetic gradients (compare figs. 1 and 15). These strong gradients are in the area where the boundary faults of the MGA penetrate deeply into the basement. Furthermore, the north-northeastwardly trending grain of the oil fields extending from Harper and Barber counties points northeastward to Saline and Clay counties. The second vertical derivative of the aeromagnetic map (Yarger, 1980, personal communication) shows grain direction identical to the oil fields.
With these observations in mind, I propose the following general locations as possibly favorable for petroleum accumulation:
At the present time, the extent and importance of the Cretaceous thermal event is unknown. Modern geothermal-gradient data suggest a rather uniform temperature field in the upper crust in Kansas. The time required to reach thermal equilibrium after the end of the Cretaceous thermal event is of the order of about 10 million years, and present-day tectonic activity is minor, so the relatively uniform thermal conditions are not surprising. However, the areal extent of thermal disturbance during the Cretaceous is unknown. It may be limited to a very small area around the kimberlites, in which case the ideas presented in this section are suspect, or if Crough et al. (1980) are correct, the thermal event could have importance on exploration strategy in Iowa, Nebraska, and Missouri. In the latter case, structural closures near basement faults could be desirable exploration targets within the Salina basin and the Forest City basin rather than just along the boundary between them.
The implementation of the strategy proposed here would best be done by evaluation of aeromagnetic and gravity data to select sites for high-resolution seismic-reflection surveying similar to those for which the results are shown in fig. 14. All of this must be tied to existing drill information and in the final analysis, to new drill information. From a more scientific viewpoint, it would be possible to detect the presence of mantle or deep crustal fluids geochemically by isotope ratios of H and O and by higher than normal concentrations of SiO2, Cl, B, Na, K, Li, Rb, Cs, and As (White, 1973; Fournier, 1973; Fournier and Truesdell, 1972).
It has been known for many years that ore deposits often represent the end product of upwelling of geothermal fluids. One of the common present-day geothermal exploration strategies presumes that upwelling of ore-bearing geothermal fluids occurs in basement fault zones. These fault zones are detected by such geophysical means as gravity and magnetic surveys and the recording of microearthquakes. Because ore deposits represent "fossil geothermal areas," it is logical to carry the geothermal-exploration strategy one step further and to prospect for the original basement fault zones that controlled depositional locations of minerals. Again, one comes back to the discussion concerning the possible importance of the thermal event of the Cretaceous and to the question of what defines a resource.
At present, there are no base-metal mines operating in Kansas. In the past, cadmium and germanium were produced as by-products of lead-zinc production in the Tri-state district (Berendsen, 1975). The westward-dipping strata in that district probably hold additional minable resources of lead, zinc, and other by-product metals. In addition, drilling for petroleum occasionally has produced cuttings containing lead and zinc mineralization in several counties outside the Tri-state district (Evans, 1962). Copper mineralization is known to exist in several places in the state in Permian rocks, although no copper has ever been commercially produced (Waugh and Brady, 1974).
Although the potential for many other minerals is relatively unknown, it is reasonable that if one could strip off all of the sedimentary cover from the state of Kansas, the basement would contain mineral diversity roughly equivalent to that of the Front Range of the Rocky Mountains. In effect, the only way we can sample the basement is by drilling, so deepening of petroleum exploration holes into the Precambrian is a very desirable objective from a mineral-exploration viewpoint.
Berendsen, P., 1975, Metal mining potential in Kansas; in, Kansas Mineral Industries Report: Kansas Geological Survey, Mineral Resources Series 3, p. 67-72.
Bickford, M. E., Harrower, K. L., Nusbaum, R. L., Thomas, J. J., and Nelson, G. E., 1979, Preliminary geologic map of the Precambrian basement rocks of Kansas: Kansas Geological Survey, Map M-9, scale 1:500,000, 1 sheet. [available online]
Brady, L. L., Adams, D. B., and Livingston, N. D., 1977, An evaluation of the strippable coal reserves in Kansas: Kansas Geological Survey, Mineral Resources Series 5, 45 p. [available online]
Brookins, D. G., 1970, Kimberlites of Riley County: Kansas Geological Survey, Bulletin 200, 32 p. [available online]
Carlson, M. P., 1971, Eastern Nebraska and north-central Kansas; in, Future Petroleum Provinces of the United States--Their Geology and Potential, I.H. Cran, ed.: American Association of Petroleum Geologists Memoir 15, v. 2, p. 1,103-1,114.
Chase, C. G., and Gilmer, T. H., 1973, Precambrian plate tectonics--the midcontinent gravity high: Earth and Planetary Sciences, Letters, v. 21, p. 70--78.
Chelikowsky, J. R., 1972, Structural geology of the Manhattan, Kansas, area: Kansas Geological Survey, Bulletin 204, pt. 4, 13 p. [available online]
Cofeen, J. A., 1978, Seismic exploration fundamentals: Tulsa, Petroleum Publishing Co., 277 p.
Cole, V. B., 1976, Configuration of the top of the Precambrian rocks in Kansas: Kansas Geological Survey, Map M-7, scale 1:500,000, 1 sheet. [available online]
Cook, A. C., 1977, Vitrinite reflectance measurements: Kansas Geological Survey, Open-file Report 77-17, 4 p.
Cook, K. L., 1955, Magnetic surveys over serpentine masses, Riley County, Kansas: Mining Engineering, v. 7, no. 5, p. 481-488.
Crough, S. T., Morgan, W. J., and Hargraves, R. B., 1980, Kimberlites--their relation to mantle hot spots: Earth and Planetary Sciences, Letters, v. 50, p. 260-274.
DeGolyer, E. L., and McNaughton, L. W., 1978, Twentieth-century petroleum statistics, 1978 (data compiled from U. S. Bureau of Mines, 1935-1977): Dallas, DeGolyer, and McNaughton, 105 p.
Dobrin, M. B., 1976, Introduction of geophysical prospecting: York, Pa., McGraw-Hill Book Co., 630 p.
DuBois, S. M., 1978, The origin of surface lineaments in Nemaha County, Kansas: M. S. thesis, Department of Geology, University of Kansas, 37 p.
Dubois, S. M., and Wilson, F. W., 1978, A revised and augmented list of earthquake intensities for Kansas, 1867-1977: Kansas Geological Survey, Environmental Series 2, 55 p. [available online]
Evans, D. L., 1962, Sphalerite mineralization in deep-lying dolomites of upper Arbuckle age, west-central Kansas: Economic Geology, v. 57, no. 4,p. 548-565.
Fournier, R. O., 1972, Silica in thermal waters--laboratory and field investigations: New York, Pergamon Press.
Fournier, R. O., 1973, An empirical geothermometer based on Na, K, and Ca in natural waters: Geochimica et Cosmochimica Acta, v. 36.
Fournier, R. O., and Truesdell, A. H., 1972, Chemical indicators of subsurface temperature applied to hot spring waters of Yellowstone National Park, Wyoming, USA: Geothermics, special issue 2, v. 2, pt. 1, p. 529-535.
Hahn, R. K., 1980, Upper mantle velocity structure in eastern Kansas from teleseismic P-wave residuals: M. S. thesis, Department of Geology, University of Kansas, 85 p.
Hahn, R. K., and Steeples, D. W., 1980, Upper mantle velocity structure in eastern Kansas from teleseismic p-residuals (abs.): EOS, American Geophysical Union, Transactions, v. 61, no. 46, p. 1,046.
Jewett, J. M., 1941, The geology of Riley and Geary Counties, Kansas: Kansas Geological Survey, Bulletin 39, 164 p. [available online]
King. E. R., and Zietz, I., 1971, Aeromagnetic study of Midcontinent Gravity High of the central United States: Geological Society of America Bulletin, v. 82, p. 2,187-2,208.
Lee, W., 1956, Stratigraphy and structural development of the Salina basin area: Kansas Geological Survey, Bulletin 121, 167 p. [available online]
Lui, C.-Y., 1981, Microearthquakes in Red Willow County, Nebraska: M. S. thesis, Department of Geology, University of Kansas, 62 p., illus. and maps.
Moore, R. C., and Haynes, W. P., 1917, Oil and gas resources of Kansas: Kansas Geological Survey, Bulletin 3, pt. 4, p. 127-212.
Morgan, W. J., 1972, Plate motions and deep mantle convection; in, Studies in Earth and Space Sciences, R. Shagam, ed.: Geological Society of America, Memoir 132, p. 7-22.
Ocola, L. C., and Meyer, R. P., 1973, Central North American rift system--structure of the axial zone from seismic and gravimetric data: Journal of Geophysical Research, v. 78, p. 5, I 73-5, 194.
Payton, C. E., 1977, Seismic stratigraphy-applications to hydrocarbon exploration: Tulsa, The American Association of Petroleum Geologists, 516 p.
Robinson, E. A., and Treitel, S., 1980, Geophysical signal analysis: Englewood Cliffs, N. J., Prentice-Hall, Inc., 450 p.
Snyder, F. G., 1968, Tectonic history of midcontinental United States: University of Missouri at Rolla, Journal I, p. 65-77.
Stander, T. W., 1981, Structural nature of the Humboldt fault zone in northeastern Nemaha County, Kansas: M.S. thesis, Department of Geology, University of Kansas, 24 p. (excluding illus. ).
State Corporation Commission of Kansas, 1979, annual report.
Steeples, D. W., 1976, Preliminary crustal model for northwest Kansas (abs.): EOS, American Geophysical Union, Transactions, v. 57, p. 961.
Steeples, D. W., and Bickford, M. E., 1981, Piggy-back drilling in Kansas--an example for the continental scientific drilling program: EOS, American Geophysical Union, Transactions, v. 62, no. 18, p. 473-476.
Tissot, B., and Welte, D. H., 1978, Petroleum formation and occurrence: New York, Springer Verlag, 538 p.
Walters, R. F., 1958, Differential entrapment of oil and gas in Arbuckle dolomite of central Kansas: American Association of Petroleum Geologists, Bulletin, v. 42, no. 9, p. 2,133-2,173.
Waugh, T. C; and Brady, L. L., 1974, Copper occurrences associated with Permian rocks in south-central Kansas (abs.): Geological Society of America, Abstracts with Programs, v. 5., no. 2, p. 129.
Wells, J. S., 1971, Forest City basin; in, Future Petroleum Provinces of the United States-their Geology and Potential, I. H. Cran, ed.: American Association of Petroleum Geologists, Memoir 15, v. 2, p. 1,098-1,103.
White, D. E., 1973, Characteristics of geothermal resources; in, Geothermal Energy Resources, Production, Stimulation, Paul Kruger and Carel Otte, eds.: Stanford, California, Stanford University Press, p. 69-94.
Yarger, H. L., 1978, Diurnal drift removal from aeromagnetic data: Geophysics, v. 43, no. 6, p. 1,148-1,156.
Yarger, H. L., 1980, Aeromagnetic analysis of the Keweenawan rift in Kansas (abs.): EOS, American Geophysical Union, Transactions, v. 61, no. 48, p. 1,192.
Yarger, H. L., 1981, Aeromagnetic survey of Kansas: EOS, American Geophysical Union, Transactions, v. 62, no. 17, p. 173-178.
Yarger, H. L., Ng., K., Robertson, R., and Woods, R., 1980, Bouguer gravity map of northeastern Kansas: Kansas Geological Survey, scale 1:500,000, 1 sheet.
Yarger, H. L., Robertson, R., Martin, J., Ng, K., Sooby, R., and Wentland, R., 1979, Aeromagnetic map of Kansas: Kansas Geological Survey, Map M-16, scale 1:500,000, 1 sheet.
Yarger, H. L., Robertson, R., Wentland, R., and Zeitz, I., 1976, Recent aeromagnetic and gravity data in northeastern Kansas (abs.): EOS, American Geophysical Union, Transactions, v. 57, no. 10, p. 752.
Zartman, R. E., Brock, M. R., Hey1, A. V., and Thomas, H. H., 1967, K-Ar and Rb-Sr ages of some alkalic intrusive rocks from central eastern United States: American Journal of Science, no. 265, p. 848.
Kansas Geological Survey
Comments to webadmin@kgs.ku.edu
Web version Sept. 12, 2013. Original publication date 1989.
URL=http://www.kgs.ku.edu/Publications/Bulletins/226/Steeples/index.html