| Original published in D. W. Steeples, ed., 1989, Geophysics in Kansas: Kansas Geological Survey, Bulletin 226, pp. 67-80 | ||
GeoData Corporation, Tulsa
The article is also available as an Acrobat PDF file.
The Southwest Kansas basin, encompassing the southwest one-third of Kansas, southeast Colorado, and northwest Oklahoma, was the major structural feature influencing the deposition of the Pennsylvanian rock units in this area. Morrow production here currently is attracting attention. Multiple oil- and gas-producing zones are found in these Pennsylvanian clastics. They were eroded, in part, from the ancestral Rocky Mountain uplift for the upper sequence and from the Amarillo uplift for the basal sequence. The Central Kansas uplift also contributed its share of sediments. Deformation and subsequent erosional processes during Late Mississippian time had a profound effect, especially on Morrowan deposition, in this vicinity. Therefore, paleostructure and stratigraphic studies are essential for delineation of hydrocarbon reservoirs in this region. The use of a datumized Pennsylvanian reflecting horizon helps to correct the effects caused by the variations of the Permian salt beds. This provides the means of defining the erosional channels of the Mississippian surface and the associated deposition of the Morrow sands. The regional seismic program shown is designed to provide high-quality structural and stratigraphic information through the use of innovative near-surface static corrections. The seismic-refraction breaks (first arrivals) of existing 100% data are used in conjunction with uphole velocity surveys to obtain more exact corrections. This near-surface velocity control produces a final seismic section of superior quality.
The Morrow trend of southwest Kansas is considered one of the most attractive areas to explore for petroleum in the United States. Average production of approximately 1,000 bbls/day is encountered from Morrow reservoirs at depths of approximately 6,000 ft (1,800 m) in the Lexington field of Clark County, Kansas. In addition, production may be encountered from at least five other horizons. The Kansas State Corporation Commission has called these wells the best producers drilled in Kansas in the past 20 yrs.
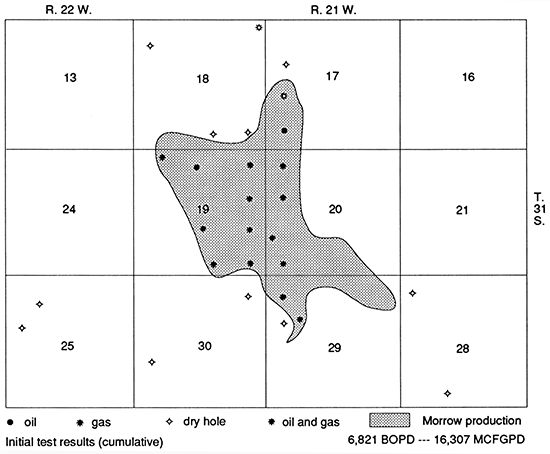
The Morrow production, with specific reference to the Lexington field, will be used as the type area for this discussion. This region is part of the Hugoton embayment of the Anadarko basin (figs. 1 and 2).
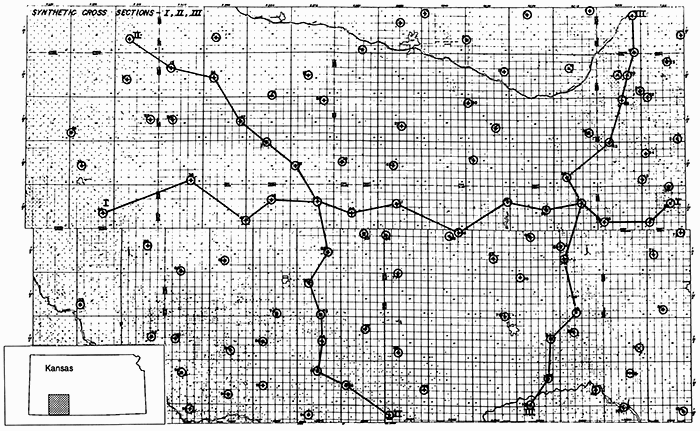
Figure 1--Seismic-l1ne location map for southwest Kansas survey.
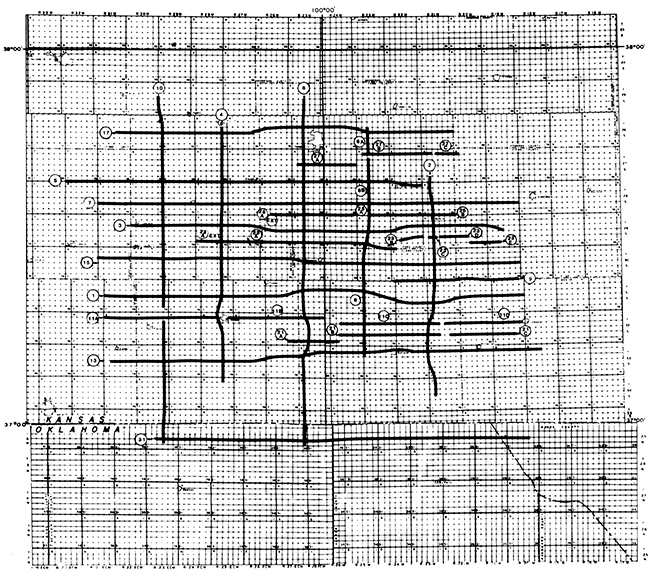
Figure 2--Lexington field location map, Clark County, Kansas.
It is postulated by some that the erosion by rivers originating in Mississippian time from the Central Kansas uplift to the northeast carried sands south. There they were distributed by longshore Pennsylvanian currents to form the basal Morrow sands and conglomerates to which we refer herein (Arro, 1965; Curtis and Ostergard, 1980). Still others suggest that these Pennsylvanian clastics were eroded from the ancestral Rocky Mountain uplift for the upper sequence and the Wichita-Amarillo uplift for the basal sequence of the Morrow (Avis and Boothby, 1982). Some think that the major source of these deltaic clastics is from the Frontrangia-Siouxia area of northeast Colorado and western Nebraska (Swanson, 1979).
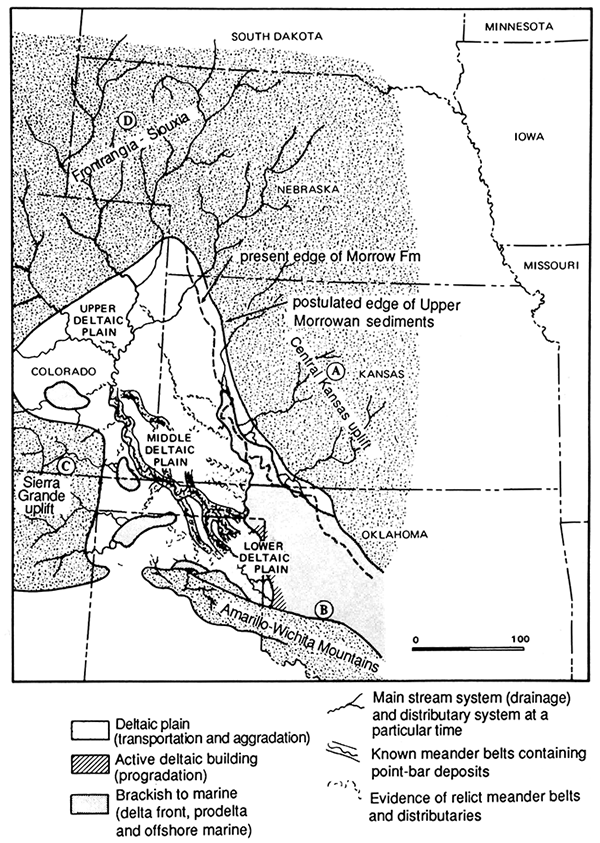
Whatever the source, it is of interest to study the similarity of the Pennsylvanian deposits on top of the eroded Mississippian to the south and west of the referenced area. Also, the development of the nearshore sand deposits of strandline type of the Morrow-Springer trend farther to the south and east in the Anadarko basin, may have a similar type of genesis (fig. 3). Surface beds in this area consist of Quaternary deposits of alluvium, fluviatile, and loess, in addition to outcrops of the Tertiary Ogallala and Upper Permian sediments. The surface elevations are relatively flat but frequently are marked by salt sinks where Permian beds have been leached out.
Figure 3--Paleogeographic map of midcontinent during upper Morrowan time (after Swanson, 1979).
The Permian System contains a considerable amount of salt that varied drastically in its thickness in this area. These variances apparently are due to the presence of Permian epeiric seas and erosion by ground waters. The variance of salt in the Blaine and Cimarron formations can cause large errors of over 300 ft (90 m) in calculating seismic depths in less than 3 mi (5 km), unless proper corrections are made. This factor, not recognized for many years, resulted in the drilling of many dry holes based on seismic pseudo-structures. Further reference to this will be made.
The Pennsylvanian System mainly consists of interbedded deposits of shale, sandstone, and limestone. The many small plane-type folded Pennsylvanian structures encountered are characterized by uplift, believed to be the result of vertical relief caused by tectonic movement transmitted through the rigid crystalline basement. The anticlinal trends apparently remained positive during regional subsidence. Pennsylvanian production is established in three zones of the Lansing-Kansas City group and the Morrow sand (table 1). Regional dip is to the southeast.
Table 1--Regional stratigraphic column for southeast Colorado, southwest Kansas, and panhandle of Oklahoma; emphasis is on Morrowan prospects (after Chenoweth et al., 1984).
| The rock succession in this region includes the following major units: |
||
|---|---|---|
| Quaternary | ||
| Tertiary | Ogallala | |
| Cretaceous | Colorado | |
| Dakota | ||
| Jurassic | Morrison | |
| Permian | Whitehorse | |
| Day Creek | ||
| Blaine | ||
| Nippewalla | ||
| Sumner | ||
| Stone Corral (good seismic marker) | ||
| Cimarron | ||
| Chase* | ||
| Council Grove | ||
| Admire | ||
| Pennsylvanian | Virgil* | |
| Wabaunsee (good datum) | ||
| Heebner | ||
| Toronto | ||
| Douglas | ||
| Missouri* | ||
| Lansing | ||
| Kansas City | ||
| Pleasanton | ||
| Des Moines* | ||
| Marmaton-Cherokee | ||
| Atoka | ||
| Morrow* | ||
| Mississippian | Chester | |
| St. Genevieve | ||
| St. Louis | ||
| Salem* (Spergen) | ||
| Warsaw* | ||
| Osage | ||
| Kinderhook | ||
| Ordovician | Viola* | |
| Simpson* | ||
| Arbuckle* | ||
| Cambrian | Reagan* | |
| *potential pay | ||
The Mississippian system essentially consists of limestone formations. The Upper Mississippian (Chesteran) stage was subject to a very severe environment in which extreme erosional processes and faulting existed. Both pronounced erosion and subsequent deposition took place on the erratic Mississippian topography.
The Viola, Simpson, and Arbuckle beds of the Ordovician System are present in some of the area. Minor faulting of the Arbuckle beds is noted in several areas, and this could be of importance from the viewpoint of forming traps for hydrocarbons. Also, the possible presence of the Reagan sand should be kept in mind as a potential petroleum reservoir.
Morrow sands in the vicinity of the Lexington field average approximately 20 ft (6 m) in thickness, so one of the major considerations involved in this discussion is, from a seismic viewpoint, how thin is a thin bed? That is, how thin a sand bed can one expect to be able to map seismically? Widess (1973) made a comprehensive study of this (table 2):
Table 2--Widess formula for determining width of a thin bed.
| Conclusions: 1) A sand of a wavelength in thickness can be mapped as to its top and bottom sequence. 2) A wavelength is determined from the formula V=f x λ Then λ = V/f Parameters for the Lexington field area λ = 12,000 ft/sec/60 Hz λ= 200 ft Then we can consider 1/4 λ= 50 ft or 1/8 λ= 2S ft Our experience finds 1/10 λ= 20 ft to be practical. |
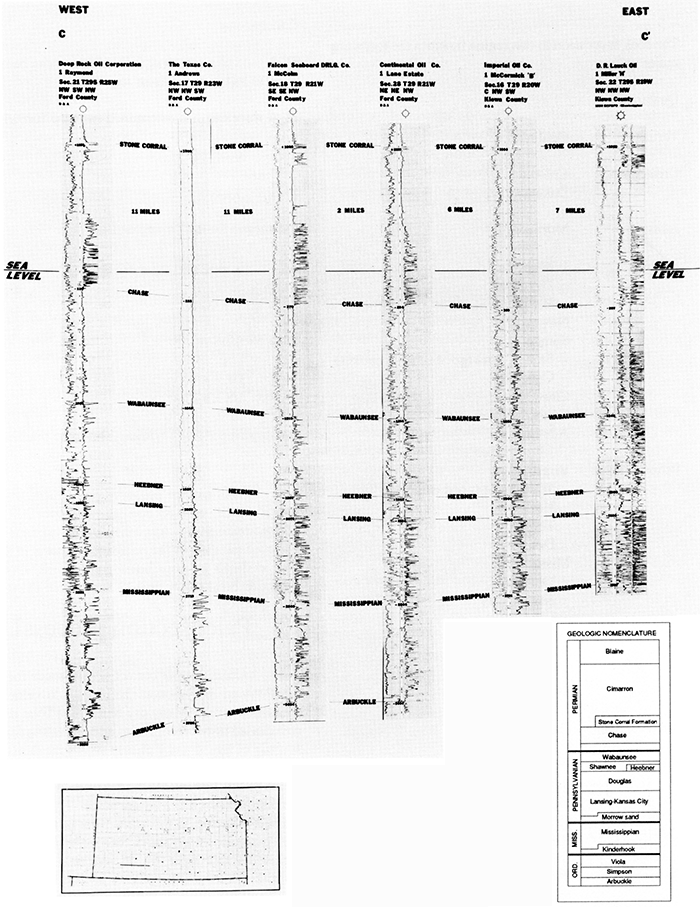
Normally, in mapping in most of Kansas, a datum plane is established by utilizing the large amount of subsurface information and electric logs that are commercially available. The Permian Stone Corral Formation, where present, is often used as a datum plane (fig. 4). A datum plane is formed and the time, or depth, to deeper horizons is seismically measured and the isotime, or isopach, values are then "hung" from this datum. One would expect that the error is less using this method than it would be by using uphole times to correct the seismic sections, and this usually proves to be true. Closely spaced correlation shooting is usually applied in conjunction with the above procedures.
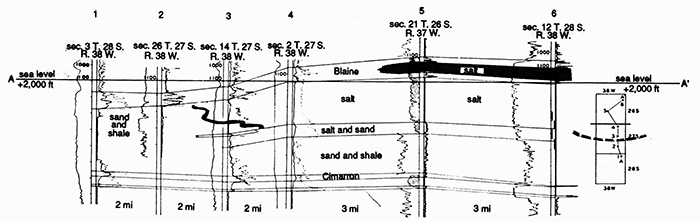
Figure 4--Type well-log cross section for area of study in southwestern Kansas.
In the Morrow trend referred to earlier, different problems are involved due to distortions caused by the variance in thickness of Permian salt beds, combined with the effect of the Mississippian erosional surface and the deposition of basal Pennsylvanian sands.
In another paper by Widess (1952), the variance in the salt bed of the Permian Blaine-Cimarron section is studied. The salt-bearing formations were subject to groundwater activity or dissolution, resulting in a slumping of the overlying section of over 200 ft (60 m). The erosion of the high-velocity salt resulted in a marked change in the interval velocity of the thin section. Note the change in salt thickness between wells four and five shown on the cross section in fig. 5.
Figure 5--Moore's well-log cross section in Grant and Kearny counties, Kansas.
This erosion produces pronounced and relatively abrupt velocity changes and can cause over 300 ft (90 m) of seismic-relief error across a distance of less than 3 mi (5 km). The configuration of the resultant salt basin in this area has been outlined by core holes and seismic shooting using refraction breaks (first arrival) and uphole-velocity surveys.
Unless proper corrections are made for variance in the Permian salt section, large pseudo-velocity seismic anomalies result. Many dry holes have been drilled in the area caused by not recognizing and correcting for this factor. A study of figs. 6 and 7 clearly shows the drastic structural effect of the salt basin. In order to correct for errors introduced by this feature, the Pennsylvanian Wabaunsee reflection has been used as a datum plane. This horizon is one of the best reflectors in this area. That is, the Wabaunsee has been made absolutely flat or "zeroed in" and all dip has been removed at this depth (fig. 7). All beds have been mapped from this datum. This allows a clear-cut analysis of the deeper reflections and, particularly, provides a much better interpretation of the Mississippian paleotopographic map upon which the Morrow sands are deposited. It should be kept in mind that by forming this paleo topographic map from what is called a paleosection, all time structure above and below the Wabaunsee has been altered and at least four other potential reservoirs previously mentioned, other than the Morrow and the Mississippian, should be evaluated with this realization in mind.
Figure 6--Final stack section (undulating seismic cross section).
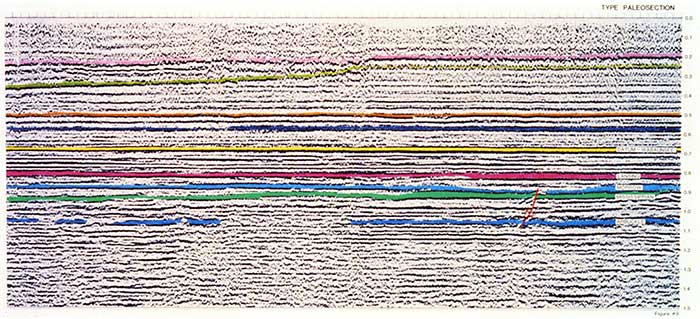
Figure 7--Type paleosection (flattened seismic cross section).
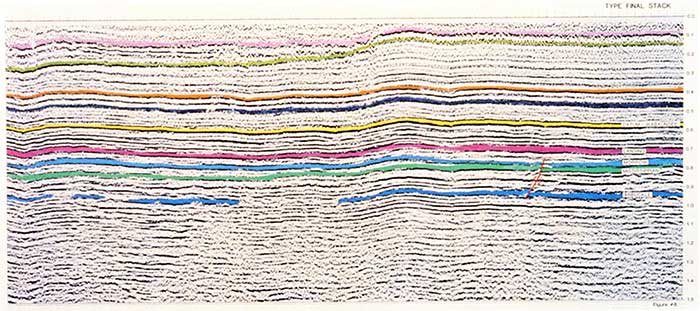
It is possible, by analyzing the corrections made to flatten the Wabaunsee reflection, that additional sections can be processed to allow a study of any existing Pennsylvanian anomalies. Also it is important to keep in mind that one is mapping Mississippian topography, i.e. the erosional surface of the Mississippian section, and if there is Mississippian structure present, one may not be mapping it as such.
In studying the resulting seismic cross section or paleosection across the Lexington field (fig. 8), it can be seen that the Morrow members have been deposited in the erosional remnant or channel formed on the Mississippian surface. The Morrow deposits often vary laterally from sands into shales and, therefore, the individual sands often are difficult to seismically define.
Figure 8--Lexington field paleosection (seismic cross section).
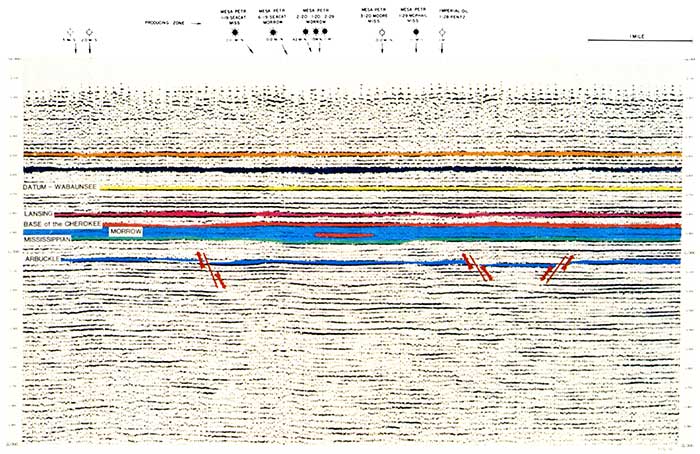
This feature is believed to be evidence of an erosional channel formed by stream or river action. If so, it would be reasonable to expect that this trend might extend in a northerly or southerly direction. It is for this reason a majority of east/west seismic lines were obtained for this program. This helps to give a maximum definition of such channels, if present.
Notice the apparent amplitude anomaly indicated in fig. 8 at Morrow depths in the vicinity of the Lexington field. This could be due to saturation of the Morrow sand by fluids, hopefully hydrocarbons, and if so, could be most valuable in evaluating this and similar areas.
The anomaly also could be due to the "tuning effect" previously mentioned, or by ray-path focusing. In any case, this can be considered a positive factor. It is also of interest to notice the apparent minor faulting (100 ft [30 m]) at Arbuckle depths. This may affect trapping possibilities for petroleum in the Arbuckle section, and the Reagan, if present.
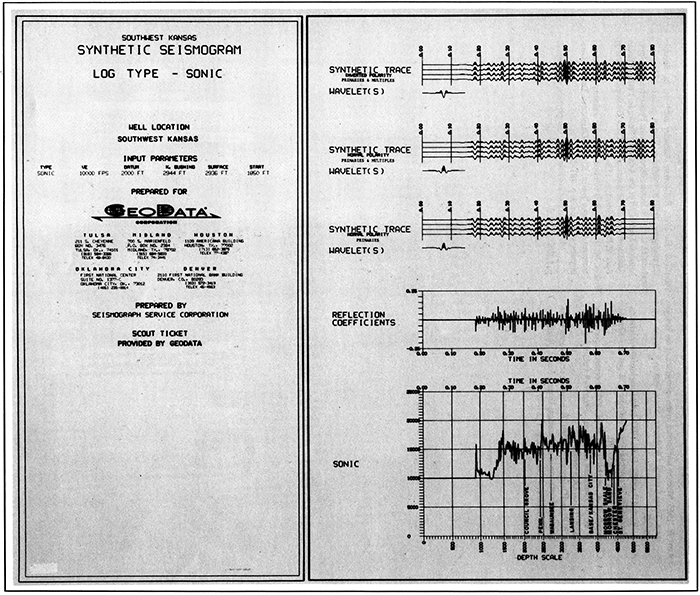
In an effort to provide data to fully study the area, a network of synthetic seismograms from over 100 sonic and resistivity logs was assembled for the general area (fig. 9). Sonic logs are far better for such analysis, but resistivity logs can be used where sufficient sonic logs are not available.
Figure 9--Synthetic seismogram location map.
As shown in fig. 10, these synthetic seismograms tie directly to the geological section and can be quite valuable in relating the presence or absence of seismic reflections to the presence or absence of individual geologic beds, both structurally and stratigraphically. Seismic control between points of well control can help in locating changes in lithology or wedging out of strata.
Figure 10---Synthetic seismogram sample.
Poor reflections and velocity problems were characteristic of this area of southwest Kansas, due in part to the salt dissolution of the Permian evaporites and subsequent collapse or slump of the overlying beds. These phenomena distort, absorb, and disperse the seismic energy, seriously affecting reflections from deeper strata.
To alleviate the above problems in similar areas in southwestern Kansas, a processing technique called paleosection processing was developed. This procedure essentially flattens on the seismic time section a good reflective marine-deposit horizon above a potential hydrocarbon-bearing stratum, assuming that this upper reflective horizon was laid down or deposited horizontally (Late Pennsylvanian time). This technique also implies the assumption that the upper reflective horizon is geologically flat, and to the degree that this assumption is incorrect, errors in interpretation may result. This flattened section, therefore, shows the attitude of the deeper structure (Mississippian-Ordovician) at the time of deposition of the flattened horizon.
Arro, E., 1965, Morrow sandstones in the subsurface of the Hough area, Texas County, Oklahoma: Shale Shaker, v. 16, no. 1, p. 16-30.
Avis, L. E., and Boothby, D. R., 1982, Promising Morrow sandstone discoveries in southeastem Colorado: Oil and Gas Journal, May 31, 1982, p. 163-170.
Chenoweth, P. A., and McBride, M. H., 1983, Formation correlator of the midcontinent and Texas: PennWell Publishing Company, Tulsa, Oklahoma.
Curtis, B. F., and Ostergard, D., 1980, Subsurface stratigraphy of the Morrow Formation in southeastern Texas County, Oklahoma: Shale Shaker, v. 30, no. 5, p. 112-142.
Sheriff, R. E., 1980, Reflection character analysis; in, Seismic Stratigraphy: IHRDC Publisher, Boston, p. 161-183.
Swanson, D. C., 1979, Deltaic deposits in the Pennsylvanian Upper Morrow Formation of the Anadarko Basin; in, Pennsylvanian Sandstones of the Midcontinent: Tulsa Geological Society, Special Publication I, p. 115-168.
Widess, M. B., 1952, Salt solution, a seismic-velocity problem in western Anadarko Basin, Kansas-Oklahoma-Texas: Geophysics, v. 17, no. 3, p. 481-504.
Widess, M. B., 1973, How thin is a thin bed?: Geophysics, v. 38, no. 6, p. 1,176-1,180.
Kansas Geological Survey
Comments to webadmin@kgs.ku.edu
Web version Oct. 9, 2013. Original publication date 1989.
URL=http://www.kgs.ku.edu/Publications/Bulletins/226/Rummerfield/index.html