| Original published in W.W. Hambleton, ed., 1959, Symposium on Geophysics in Kansas: Kansas Geological Survey, Bulletin 137, pp. 357-375 | ||
1Kansas Geological Survey, 2The Eagle-Picher Company
The complete article is available as an Acrobat PDF file.
This paper reviews geophysical exploration for zinc and lead sulfide ore bodies in the Tri-State mining district of Kansas, Oklahoma, and Missouri. The results of magnetic, gravity, electrical, radio, geochemical, and seismic surveys are summarized. Particular attention is given to refraction seismograph work in Cherokee County, Kansas, conducted in 1955 but previously unreported in the literature.
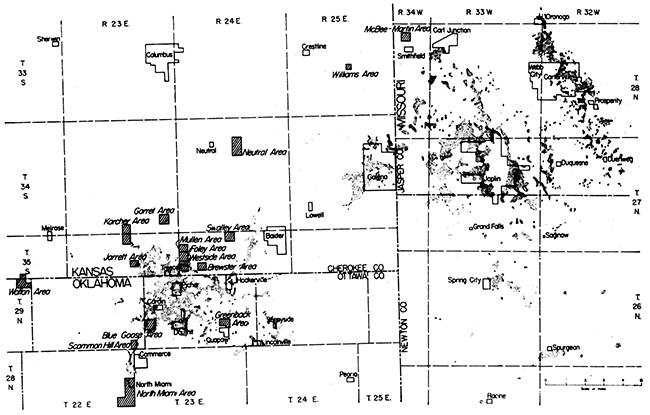
This paper reviews geophysical exploration for zinc and lead sulfide ore bodies in the Tri-State mining district, an area of about 2,000 square miles in southeastern Kansas, southwestern Missouri, and northeastern Oklahoma on the western flank of the Ozark Dome. Most ore has been produced from four areas--(l) Oronogo-Webb City-Duenweg and (2) Joplin fields in southwestern Missouri, (3) Galena field in southeastern Cherokee County, Kansas, and (4) Picher field in the southeastern part of Cherokee County, Kansas, and the north-central part of Ottawa County, Oklahoma (Fig. 1). The rest of the ore has come from numerous small mineralized areas scattered throughout the district.
Figure 1--Map of part of Tri-State mining district showing mineralized areas approximately (stippled) and some areas of local geophysical exploration.
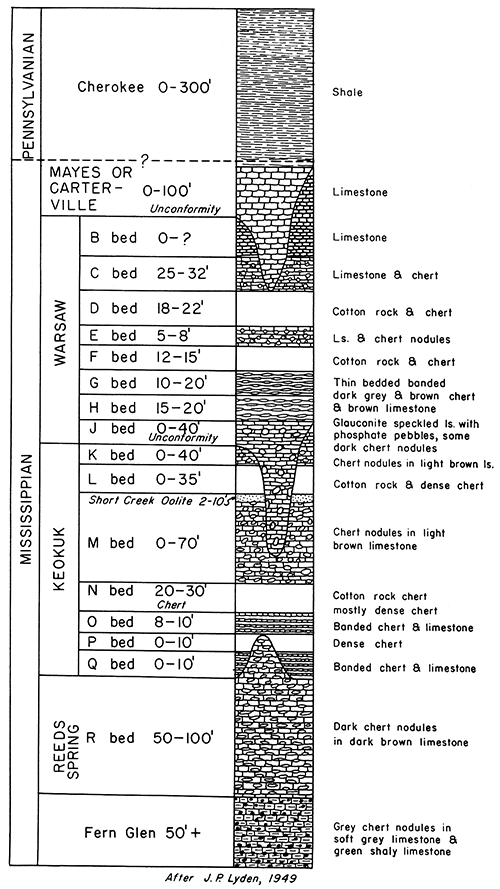
Paleozoic rocks overlie Precambrian granite at a depth of about 1,800 feet. Above the Precambrian, but below ore-bearing beds, is a sequence of pre-Mississippian rocks about 1,400 feet thick. These rocks are overlain unconformably by Mississippian rocks about 350 feet thick consisting of chert, limestone, and some shale and comprising the Kinderhookian, Osagian, Meramecian, and Chesterian Series (Bastin, 1939). Kinderhookian rocks include Chattanooga shale (Kinderhookian?), Compton limestone, and Northview shale. The Osagian Series (Fig. 2) includes Fern Glen, Reeds Spring, and Keokuk formations; the Meramecian Series is represented by Warsaw formation. Osagian and Meramecian rocks locally are called "Boone formation."
Figure 2--Generalized stratigraphic section of post-Kinderhookian rocks of Tri-State district. Capital letters refer to lithologic subdivision of Mississippian rocks.
Unconformably overlying Meramecian rocks are strata of the Mayes (Cartersville) formation of Chesterian age as much as 80 feet thick. The Mayes is variable in thickness and lithology, and is not present everywhere beneath the Cherokee in the Oklahoma-Kansas mining field. The upper part of the formation is composed principally of sandstone or shale, whereas the lower part is limestone.
The Pennsylvanian Cherokee shale (Desmoinesian) lies unconformably upon the Mississippian in the western part of the district. Within the Tri-State district, the eastern boundary of the Cherokee overlap is somewhat west of the Missouri border. The Cherokee consists of clay, shale, and several sandstone units. It reaches a maximum thickness of about 200 feet in the area, but the lower part of rocks generally classified as Cherokee shale may be the upper, shaly part of the Mayes formation. The top of the limestone in the Mayes marks an identifiable lithologic change, although it may not represent the top of the Mississippian.
Locally, deposits of Cenozoic clay and coarse chert gravel overlie the Cherokee shale.
Mississippian and Pennsylvanian rocks in the Tri-State district have an average dip of about 20 feet per mile to the northwest. The most prominent structural feature in the district is the Miami Trough, a series of disconnected structural lows averaging about one-half mile in width, trending northeastward from Commerce, Oklahoma, to Lawton, Kansas, and having a maximum structural relief of about 200 feet. The trough probably resulted from repeated shearing, solution, and slumping.
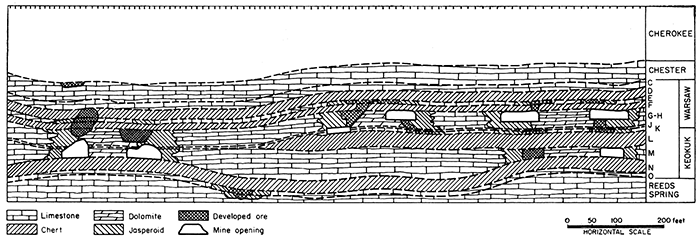
Ore bodies generally occur only in those parts of the district that have been subjected to pre-mineralization flexing, shearing, and brecciation (Bastin, 1939). An example of ore localization is shown in a typical cross-section of the Tri-State district (Fig. 3). The structural conditions most favorable for emplacement of major ore deposits are wide and intensely shattered shear zones contiguous to deformed strata that have open spaces along bedding planes and stylolitic partings. Considerable ore is found in the Warsaw formation, but most ore zones are in the Keokuk and Reeds Spring formations, 100 to 200 feet below the Cherokee shale. The Warsaw and Keokuk formations in the Tri-State district have been subdivided on the basis of minor lithologic variations, as shown in the generalized geologic section (Fig. 2). The main ore-bearing unit is the "M" bed. Sinkholes and caverns are found in the Mississippian limestone throughout the district. In many places there is no general correlation between the occurrence of caverns and ore, but many ore bodies in the "M" bed are associated with collapse breccia structures where the "M" bed is thinned by solution. Two types of ore bodies, called "runs" and "sheet ground", are recognized. "Run" deposits are those having definite horizontal elongation; they range from 10 to 100 feet in height and may be several hundred feed in width. They are related generally to shear zones. "Sheet ground" deposits are tabular and are found in a certain bed or beds. The ore minerals are the sulfides sphalerite and galena; minor amounts of marcasite, pyrite, and chalcopyrite are closely associated with them. Jasperoid, dolomite, chert, calcite, and limestone constitute the gangue and country rock containing the sulfide minerals.
Figure 3--Generalized geologic cross-section showing typical structural and stratigraphic relations of ore deposits in Tri-State district.
The Tri-State Zinc and Lead Ore Producers Association, in cooperation with the Missouri Bureau of Geology and Mines, prepared a map (Grohskopf and Reinoehl, 1933) showing lines of equal vertical intensity at 100-gamma intervals for the Tri-State zinc and lead district. This map includes Jasper, Newton, and Lawrence Counties, Missouri; Cherokee County, Kansas; and Ottawa County, Oklahoma. Magnetic intensity readings were taken at 1-mile intervals on section corners, and show a range of 1,311 gammas. In general, there is considerable range in magnetic intensity in and near the mining fields, but magnetic intensities bear no definite diagnostic relation to locations of zinc and lead ore bodies.
Jakosky, Dreyer, and Wilson (1942) published results of geophysical investigations made cooperatively by the Kansas Geological Survey and the Engineering Experiment Station of the University of Kansas in the Cherokee County, Kansas, and Ottawa County, Oklahoma, portions of the Tri-State district. The areas of investigation are shown on Figure 1 as the Neutral, Mullen, Jarrett, Walton, Karcher, Swalley, Greenback, and McBeeMartin areas. Concerning magnetic investigations, they state, "Regional magnetic work (including the work of the Missouri Bureau of Mines) has shown that prominent magnetic anomalies occur over a wide territory, including some of the ore-producing districts. These anomalies evidently are influenced by magnetic variations, both in basement rocks and in the overlying sediments, the relative effects of which it is impossible to determine from magnetic work alone."
The Missouri Geological Survey (1943) published a vertical-intensity magnetic anomaly map of Missouri on a scale of 8 miles to 1 inch and a contour interval of 100 gammas. The map must be classed as regional, inasmuch as it is based on stations spaced 1 or 2 miles apart. The scale is too small to permit the map to be used as a guide to detailed prospecting in the Missouri part of the Tri-State area.
Dreyer (1947) made a magnetic survey of southeastern Crawford County, Kansas, in an attempt to develop a technique whereby geologic structures could be mapped in detail over large areas; his ultimate objective was to facilitate exploration for a northward extension of the Tri-State district in Kansas. The magnetometer was used successfully to map location and trend of significant structures, which were indicated by magnetic anomalies bearing an inverse relation to structural elevation. Dreyer concluded that inasmuch as zinc and lead ore bodies are found in zones of intense brecciation adjacent to lines of structural deformation, the magnetic survey could indicate places for exploratory drilling.
In 1947, the U. S. Geological Survey published an aeromagnetic map of part of the Tri-State mining district. This map covers the mining districts between Miami, Oklahoma, and Carthage, Missouri. It was made from data obtained from an airborne magnetometer survey flown on north-south lines 1 mile apart. Locally, the anomalies have northwest trends corresponding with the northwest structural trends of the district. These northwest-trending anomalies are common in the mining districts, and although they may have some value in indicating broad areas of lead-zinc mineralization, they have little value as a means of locating ore bodies.
From the magnetic surveys that have been made, the Eagle-Picher Company has concluded that magnetic anomalies are of some value in delineating broad areas (several square miles) in regions favorable for prospecting for zinc ore bodies. The anomalies are of no value, however, for indicating the presence or absence of zinc sulfide mineralization at any particular location in the Tri-State district.
Experiments with the Eötvös torsion balance as an exploration tool were made by North American Exploration Company (George, 1928) in the Duenweg area of Missouri and in the Brewster and Jarrett areas of the Picher field of Oklahoma and Kansas (Fig. 1). Seemingly there was no correspondence between gravity anomalies and ore deposits, although gravity maxima indicated that limestone was closest to the surface and chert farthest from the surface, whereas gravity minima indicated proximity of chert to the surface. These relations suggest that limestone produced higher gravity readings than chert and ore. It seemed possible, therefore, to distinguish between unaltered limestone and silicified, brecciated limestone.
Gravity meter traverses were run for Eagle-Picher Mining and Smelting Company in October 1939, in the Karcher area of Cherokee County, Kansas. These traverses indicated no apparent correlation between gravity anomalies and mineralization. Another gravity meter survey of the Oklahoma-Kansas mining field was made for the Eagle-Picher Company in 1942. At the start of this work, tests were made to determine whether the presence of ore could be revealed by gravity measurements; the results were negative. Also, tests were made to determine whether mine openings would affect gravity measurements; the results showed that mine openings would not affect readings. Other tests were made to determine whether difference in elevation on the shale-limestone contact below the base of the Cherokee could be mapped. One test seemingly showed that gravity meter readings were higher over areas where the top of the limestone is high, but a test in which stations were located on a 400-foot grid did not show a consistent correlation between the gravity measurements and the depth of the limestone. Seemingly, the top of the limestone is too deep in this area to be mapped accurately by gravity meter.
A gravity map, contoured from the survey results, shows that gravity anomalies are high south and southeast of the main Picher field and low north and northwest of the field. Generally, the contours over the Picher field form a nose that pitches northwest and conforms roughly with the area of the Picher field. Seemingly, the map reveals that the mineralized area is a terrace or bench that is subordinate to a basement structure, which lies to the southeast. The map reveals, also, the general configuration of the basement rocks. The mineralized zone shows definite gravitational contrast to the rest of the mapped area. The gravimetric method, therefore, may be a rapid and relatively inexpensive reconnaissance exploration means of outlining Tri-State mining districts; local areas of mineralization still must be identified by exploratory drilling.
Jakosky, Dreyer, and Wilson (1942) made gravity measurements in mineralized parts of the Tri-State area during their program of geophysical investigation. They found that gravity anomalies in the general vicinity of the mineralized zones are smaller than anomalies over structures such as the Miami Trough. In a few places (Walton area, Fig. 1), gravity minima coincide with the location of the mineralized zones. In the Walton, Karcher, and Swalley areas, where the mineralized zones are more extensive, gravity minima are not confined to the trends of mineralization. In the Greenback and McBee-Martin areas, gravity anomalies show no relation to mineralized zones. The authors state that there is close coincidence and similarity between gravity and resistivity anomalies, especially in the Neutral area. This similarity between the gravity and resistivity anomalies indicates that the local gravity anomalies are due primarily to relatively shallow subsurface conditions in the sedimentary section. The authors conclude that: (1) the gravity anomalies mapped in their work are not directly related to ore mineralization; (2) in a few places, gravity minima seem to be due to the effects of brecciation or cavernous conditions, which are related directly to the mineralized zones; (3) presence or absence of gravity minima is not conclusive evidence of the presence or absence of mineralized zones.
The Missouri Geological Survey (1943a) published a Bouguer gravity anomaly map of Missouri at a scale of 1 inch=8 miles and a contour interval of 50 gravity units. The scale is so small that the map is not of great value as a guide to detailed prospecting in the Tri-State area.
Cook (1956) published a map showing results of a regional gravity survey of northeastern Oklahoma and southeastern Kansas made in 1948 by the U. S. Geological Survey in cooperation with the U. S. Coast and Geodetic Survey. The Bouguer anomaly map is based on readings at stations spaced 5 to 10 miles apart; thus the map is not sufficiently detailed to be of use in prospecting.
Gravity anomalies, like magnetic anomalies, are of some value in delineating broad areas (several square miles) in which to prospect for zinc mineralization in favorable regions. They cannot be used to delineate areas of zinc mineralization.
Dreyer (1948) conducted radioactivity surveys in the Mullen, Foley, Westside, and Garrett areas of Cherokee County, Kansas. He concluded that the radioactivity survey was of no value either in locating ore bodies or in delineating major structural features in the Tri-State district.
The first electrical survey in the Tri-State district was made in 1928 for Commerce Mining and Royalty Company on the Scammon Hill and Blue Goose properties, and for the Eagle-Picher Company on the Williams lease located at Crestline, Kansas, and Fortuna, Moniteau County, Missouri. The method employed was the radiore survey, a means of locating electro-conductive materials. The apparatus consists of two parts, an energizing or transmitting set by means of which induced currents are caused to flow in the conductor being sought, and a direction-finding or receiving set by means of which the secondary field surrounding a conductor is found and its axis located accurately.
The radiore survey on the Scammon Hill and Blue Goose properties outlined six features, four of which were recommended for drilling. The indicated features did not correspond with locations of any of the ore bodies, which have since been developed and mined. The locations recommended for the Eagle-Picher Company were checked by drilling. Three churn-drill holes at Fortuna, Moniteau County, Missouri, indicated that anomalies were caused by underground water flowing through broken and fractured rock (termed open ground by miners) that contained very little ore. The Eagle-Picher Company drilling on the Williams land near Crestline, Kansas, also was in open ground along water courses similar to those at Fortuna.
Seemingly the radiore surveys outlined electro-conductive trends, some of which were along water courses in open ground, but none on zinc sulfide ore bodies. Inasmuch as some water courses in open ground are associated with zinc sulfide ore bodies, this method might be be useful in such places.
The Schlumberger Well Surveying Corporation made resistivity surveys for the American Zinc, Lead, and Smelting Company in an area around Aurora, Missouri, in 1929 and 1930. Structure maps were contoured on the shale-limestone contact below the base of the Cherokee or on the surface of unweathered limestone where no shale cover was present. Seemingly there was no correlation between resistivity and mineralization, although subsequent drilling has shown that the determinations of depth to the shale-limestone contact were accurate within 10 feet.
Resistivity surveys were made in 1940 by F. C. Farnham for the Eagle-Picher Company on four east-west lines in sec. 12, 13, and 23, T. 28 N., R. 22 E., near North Miami in Ottawa County, Oklahoma, on a projection of the Miami Fault southwest from the Picher field. Low resistivity values were found on all four lines but no drilling was done to check them.
Resistivity surveys were made by Jakosky, Dreyer, and Wilson (1942) on the Neutral, Mullen, Walton, Karcher, Swalley, Greenback, and McBee-Martin areas in the Tri-State district. They concluded that: (1) resistivity anomalies probably are not directly related to ore mineralization; (2) where the mineralized zones are of sufficient size (as in the Walton and Karcher areas), resistivity lows may be indirectly related to the mineralized zone, owing to the conductive effect of water-saturated zones of brecciation or fracturing in the limestone. Comparison of the gravity and resistivity data indicates that brecciation, fracturing, or caverns of insufficient extent to cause gravity anomalies may be extensive enough to cause detectable changes in resistivity; they are more likely to cause resistivity lows than gravity lows. Presence or absence of resistivity minima is not conclusive evidence of the presence or absence of mineralized zones. They concluded, also, that resistivity methods and so-called potential ratio methods employing a pair of energizing electrodes and a pair of potential electrodes are unsuitable for detection of small subsurface ore bodies. This unsuitability is due chiefly to poor resolving power, caused by the large spreads of the surface electrodes. Well-defined resistivity lows were found to coincide with the Miami Trough and other depressions on the limestone surface, and under favorable conditions the depth of the limestone could be determined.
Natural potential surveys were made in the Tri-State district in the Park, Walton, Karcher, Mullen, and Neutral areas by Jakosky, Dreyer, and Wilson (1942). They report that in the Neutral area, higher potential values were found at locations showing resistivity and gravity minima. In other areas, no apparent correlation was found between natural potential values and either structure or mineralized zones. The following factors probably are mainly responsible for the natural potential anomalies: (1) oxidizing iron disulfides, unrelated to ore mineralization, (2) non-uniform distribution of electrolytes in the subsurface, and (3) irregular distribution of moisture at the surface (perhaps influenced by topography). The suspected causes of anomalies cannot be differentiated unless they are obvious. For these reasons, and the fact that several zinc ore bodies failed to show natural potential anomalies above them, natural potential surveys are of little value in the search for ore bodies.
Cook (1954) conducted a resistivity survey in the Tri-State zinc and lead district for the purpose of testing the feasibility of detecting buried slump structures, which could be sites of ore deposition. An apparent resistivity of 150 ohm-centimeters for the "Boone" limestone and an apparent resistivity of 30 ohm-centimeters for the Cherokee shale provided a resistivity contrast for delineation of shale areas. The author concluded that the method indicates favorable ore targets, but cannot be used as a guide to ore because Cherokee shale also may occur in erosional depressions on the "Boone" surface or as outliers east of the Cherokee overlap. Cook and Van Nostrand (1954) subsequently applied solutions of Laplace equations in prolate and oblate spheroidal coordinates to problems that arise in resistivity surveys over filled hemispheroidal sinks. Study of an area in Cherokee County, Kansas, showed that the resistivity effect of a vertical dike can approximate that of a filled sink of slight width compared to its length and depth, and that the resistivity effect of a vertical fault approximates that of a sink that is large in comparison to electrode separation.
The papers by Cook are preliminary reports of cooperative investigations by the Geophysics Branch, U. S. Geological Survey, and the U. S. Bureau of Mines, conducted from October 1950 to June 1953 in the Badger-Peacock area of Cherokee County, Kansas, about 3 miles north of Galena, Kansas. Brichta and Ryan (1958) report results from nearly 98 miles of resistivity profiles, seismic refraction profiles along 8 traverse lines for an aggregate length of 16',600 feet, and 98 test holes aggregating 17,628 feet of bore hole. The resistivity measurements disclosed 21 low-resistivity anomalies and 1 high-resistivity anomaly. Correlation of resistivity data with results of test drilling shows that low-resistivity anomalies having minimum resistivity of 2,500 to 7,500 ohm-centimeters indicate either slumped shale deposits in limestone sinks or undisturbed deposits of shale lying in erosional depressions in limestone. Anomalies having minimum values of 10,000 ohm-centimeters generally indicate shale outliers or minor structural deformation. The high-resistivity anomaly of 20,000 to 60,000 ohm-centimeters indicates hard, undisturbed limestone at or near the surface. The seismic surveys, made over previously defined shale masses, proved adaptable for locating broad sink structures but were only moderately successful in depicting configuration of the underlying limestone surface. Of 21 low-resistivity anomalies tested by drilling, 9 contained ore averaging 1.5 percent or more combined lead and zinc, either on the flanks of the limestone sinks or in limestone below the shale.
The American Zinc, Lead, and Smelting Company has used resistivity surveys in the Tri-State district in the last few years in an attempt to find ore bodies by locating high-porosity areas and prospecting them. The company reports that it found the Kenoyer "K" bed ore body by prospecting a high-porosity area located by resistivity surveys. The method, however, has had only moderate success because porosity areas, together with depressions on the limestone surface under the shale, are not necessarily related to mineralized areas. Porosity areas related to zinc mineralization are such a small fraction of the total that a prohibitive amount of drilling is required to prospect them. This method has some value, however, where the porosity area or limestone depression is known to be related to zinc mineralization.
In 1948, on recommendation of Dr. Edward L. Clark, then State Geologist of Missouri, the Eagle-Picher Company became interested in radio surveys. Clark indicated that faults could be traced by use of a micro ammeter attached to a portable radio to measure the amount of interference with reception. Subsequently, a portable radio equipped with a microammeter was tested in the Tri-State district over faults and zinc ore bodies. Where the fissures and faults intersected the surface, radio interference was detected; where the faults and fissures did not intersect the surface, no radio interference was detected. It was concluded that so many conditions, other than the cropping out of ore bodies, caused radio interference that the method had no practical value as a means of indicating mineralization in the Tri-State area.
In 1949, an apparatus consisting of a radio transmitting set and a receiving set was tested over known ore bodies. Anomalies that roughly conformed to known ore bodies were found in a few areas, whereas no anomalies were found over other ore bodies. The apparatus was not suitable for location of deep ore.
In 1950, a Radore survey was made in the Tri-State district, but was found to have little practical value in locating zinc ore bodies in the Picher field. The Radore method is similar to radio survey methods previously employed in that radio field intensities are measured to find irregularities in microammeter readings at different locations on the surface. The intensity of the radio waves from the transmitter can be kept constant and the distance of the receiver from the transmitter or oscillator can be varied as desired. The apparatus is built for easy manipulation and more accurate work than any other method using radio waves.
During 1940 and 1941, geochemical surveys were made by the Eagle-Picher Company on leases near Stark City and Wentworth, Missouri. Clay samples below the soil were taken at regular intervals with a hand auger. Spectrographic analyses of the samples were made at the Eagle-Picher Company's Research Laboratory in Joplin. At a location near Stark City, the samples showed greater lead-zinc content over one ore body than around it, but at locations over ore bodies near Wentworth the lead-zinc content of the samples generally was no greater than that of the samples obtained around the ore bodies.
Jakosky, Dreyer, and Wilson (1942) made geochemical surveys on the Neutral, Mullen, Walton, Karcher, Swalley, and Greenback areas. Only in the Karcher area was there any evidence of possible relationship between the mineralized zone and the relative distribution and concentration of metallic elements in the soil. Metallic elements are concentrated in the soil above mineralized areas because part of the ore is exposed at or near the surface, or because mineralizing solutions from the ore body rise through shear or fracture zones in overlying rocks.
Harbaugh (1950) made geochemical studies in the Tri-State district using vegetation as a guide for prospecting. Samples of various plants were collected from areas in Newton, Barry, and Lawrence Counties, Missouri; Cherokee County, Kansas; and Ottawa County, Oklahoma. The samples were analyzed colorimetrically for zinc and copper and analyzed spectrographically for lead, nickel, tin, silver, and cobalt. Greater average zinc concentrations were found in some plants growing near mineralized zones less than 100 feet in depth. Harbaugh concludes that this method of prospecting offers promise in the Tri-State district, especially in areas where the "Boone" limestone is exposed, and that chemical anomalies may give an indication of the occurrence of concealed mineralization.
The geochemical method has some value where ore bodies are near the surface because chances are good that metallic elements from the top of the ore body or from slightly mineralized zones above the ore body remain in the soil. The chances are poor that deep zinc ore bodies in the Tri-State district can be located by geochemical surveys.
Refraction seismograph surveys were made in the Picher field in 1955. The surveys were made to determine whether refractions from below the base of the Cherokee shale could be used to locate and delineate shale depressions and slump areas on the surface of the underlying limestone. Ore bodies are found in association with slump areas in some places, inasmuch as the slumps are related to structures that are favorable locations for the deposition of ore.
In non-mineralized areas, the main ore-bearing bed ("M" bed) may be as thick as 75 feet; in areas of mineralization, the thickness of the main ore-bearing bed may be only 20 to 25 feet thick, owing to solution. Where the areal extent of solution is sufficiently great, the overlying beds collapse to produce a shale slump. However, depressions at the base of the shale are caused also by erosion of the limestone surface and by structural deformation. Erosional depressions are of little interest as places of ore deposition, but structures may be favorable prospecting places.
Preliminary evaluation of the refraction method led to the conclusion that interfaces below the base of the shale, such as the top of the "L" or "N" beds, could not be picked from refraction records. The method would be successful only in areas where the shale was sufficiently thick to permit minimum recording time. In addition, it was suspected that lenticular sandstone units in the Cherokee shale might introduce errors in depth determinations.
It was concluded that the refraction method could be of value in locating ore bodies where the "M" bed had been thinned by solution over a wide enough area to cause collapse of the overlying beds; could trace the Miami Trough, which then could be drilled to locate favorable areas of ore deposition; and could locate broad domal structures, which might be favorable prospecting areas. The surveys probably could not locate ore bodies in-upper beds that show no appreciable thinning and could not indicate the open ground associated with ore bodies in many places.
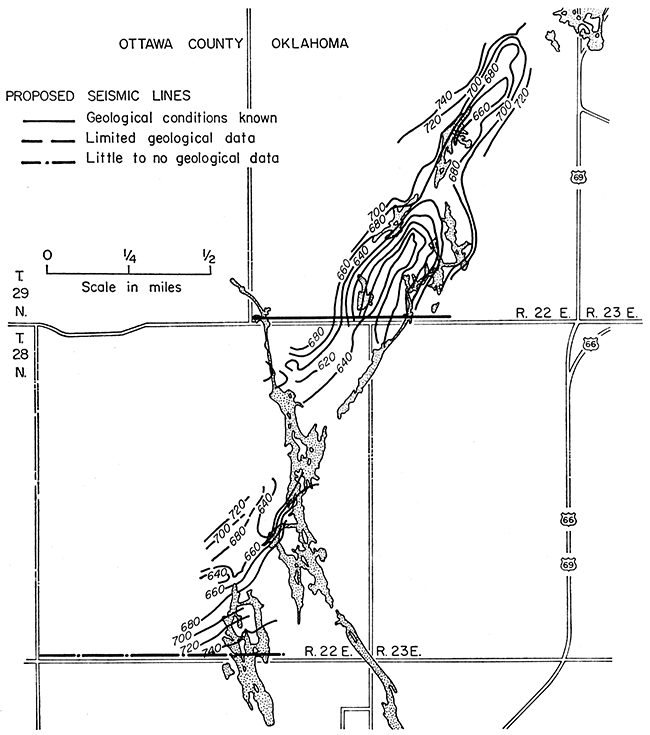
An exploration program was outlined as a test of the method. Seismic surveys were to be run: (1) across the Miami Trough and across a few slump areas where geological conditions were known, (2) across areas where mineralization was knoWn to exist but where there were few geological data available, and (3) in areas thought to be favorable for ore deposition but where little or no information was available. Location of survey lines was based partly on structure maps on the base of the Cherokee shale (Fig. 4, 5, and 6). The structure maps were compared with maps showing mineral concentration, in an effort to find places where mineralization and slump coincide in both mined and unmined areas.
Refraction seismic surveys were made along many of the proposed lines in Cherokee County, and three anomalies (A, B, C, Fig. 4) were thought interesting enough to check by drilling, with the following results: (A)--A seismic anomaly (SW cor. sec. 16, T. 35 S., R. 23 E.) indicated the possibility of a slump having 37 feet of relief. Two test holes were drilled and a depression 41 feet deep was shown to be present. The "M" bed, however, was limy and the Mayes limestone was absent, indicating that the shale depression was erosional in origin and not due to solution thinning of the "M" bed. No sandstone was encountered in the Cherokee shale. Although no ore was found, the position of the shale-limestone contact agreed closely with the position predicted from seismic work. (B)--Seismic work (SW SW SW sec. 4, T. 35 S., R. 23 E.) indicated the presence of a depression 41 feet deep. Two test holes drilled in the area indicated relief of only 5 feet at the base of the shale and the absence of slump between the holes. The seismic anomaly was attributed to a sandstone lens 10 feet thick, which was intersected in one hole only. The interval between the top of the sandstone lens and the shale-limestone interface was 42 feet, checking very closely the indicated 41-foot depression. (C)--The seismic work (SE SW sec. 27, T. 34 S., R. 23 E.) indicated an anomaly of the order of 28 feet. Drilling showed only 1 foot difference in elevation on the shale-limestone contact between two test holes. One of the holes intersected 80 feet of shale containing sandy streaks.
Figure 4--Map showing structure on base of Cherokee shale, contour interval 20 feet, and proposed refraction seismograph lines, northwest extension of Picher field. A, B, and C are lines of surveys that were checked by drilling.
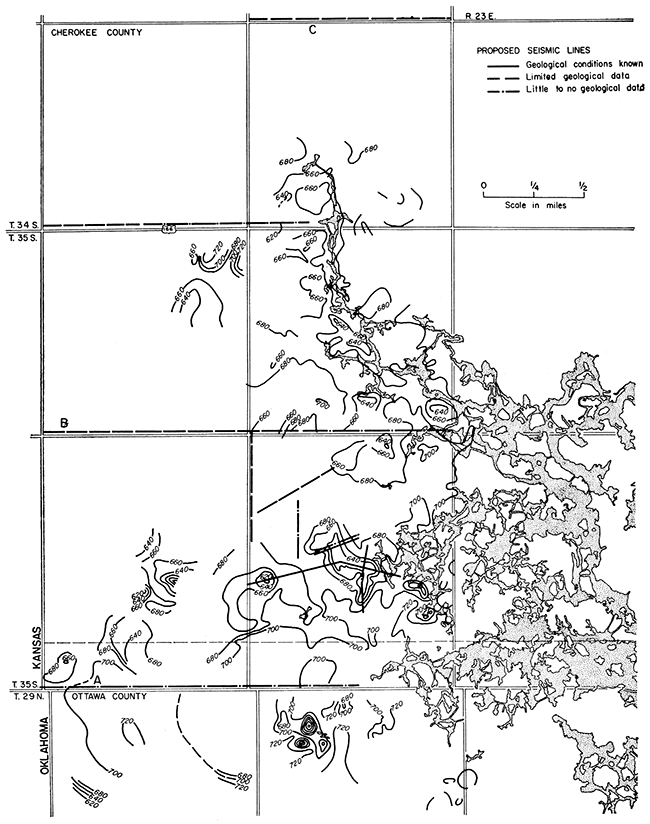
Figure 5--Map showing structure on base of Cherokee shale, contour interval 20 feet, and proposed refraction seismograph lines, southwest extension of Miami Trough in Picher field.
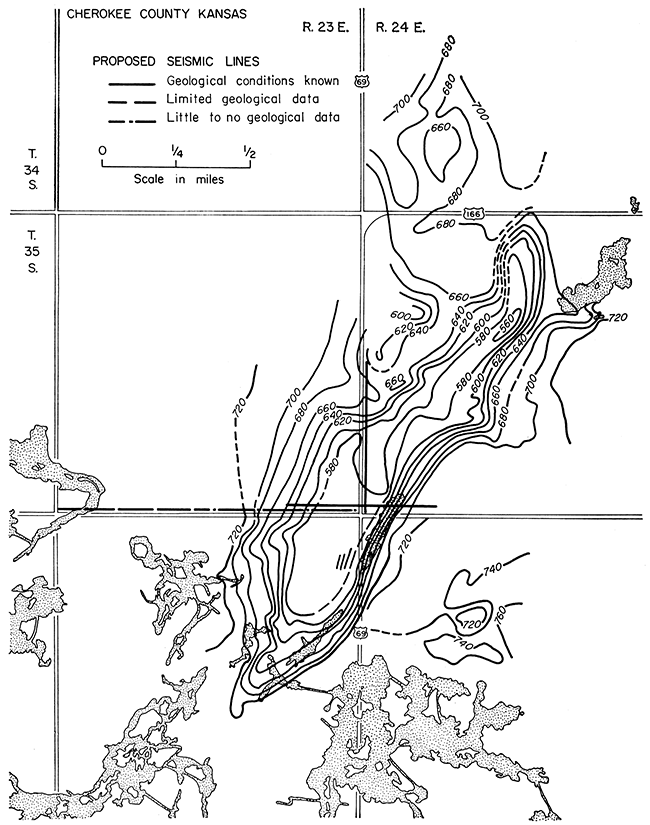
Figure 6--Map showing structure on base of Cherokee shale, contour interval 20 feet, and proposed refraction seismograph lines, northeast extension of Miami Trough in Picher field.
Drilling on the first prospect (A) showed that an erosional low could be identified by the seismic survey. The erosional low was characterized by a sharp, well-defined shale-limestone interface, whereas slump should be less well defined. There is a question whether the seismic survey could be used to identify a slump with any degree of reliability. The surveys in the other prospect areas were not able to reveal true conditions, owing to the effect of sandstone lenses, and the program was abandoned.
To date, no satisfactory geophysical method has been demonstrated that consistently can locate deep zinc sulfide ore bodies that are entirely below the water table in mineralized areas of the Tri-State district. The Eagle-Picher Company has conducted many of these geophysical studies and has used methods that seemingly had the greatest likelihood for success. No systematic geophysical exploration program has been attempted, however, and one might speculate that such a program could meet with success. The refraction seismograph program, for example, did not produce uniformly good results but did verify the geophysical-geological basis for exploration. In short, the geophysical program has had no opportunity to gain stature.
Much of the information in this report has been compiled from unpublished reports of the Eagle-Picher Company. Permission to use these reports is gratefully acknowledged.
Bastin, E. S. [ed.] (1939) Contributions to a knowledge of the lead and zinc deposits of the Mississippi Valley region: Geol. Soc. America, Special Paper 24, p. 1-156.
Brichta, L. C., and Ryan, J. P. (1958) Practical evaluation of electrical-resistivity surveys as a guide to zinc-lead exploratory drilling, Badger-Peacock Camp and vicinity, Cherokee County, Kansas: U.S. Bur. Mines, Report of Investigation 5426, p. 1-91.
Cook, K. L. (1954) Resistivity surveys over slump structures, Tri-State lead-zinc mining district, Cherokee County Kansas (abs): Geophysics, v. 19, p. 631.
Cook, K. L. (1956) Regional gravity survey in northeastern Oklahoma and southeastern Kansas: Geophysics, v. 21, p. 88-106.
Cook, K. L., and Van Nostrand, R. G. (1954) Interpretation of resistivity data over filled sinks: Geophysics, v. 19, p. 761-790.
Dreyer, R. M. (1947) Magnetic survey of southeastern Crawford County, Kansas: Kansas Geol. Survey, Bull. 70, pt. 5, p. 105-115. [available online]
Dreyer, R. M. (1948) Radioactivity surveys in the Kansas part of the Tri-State zinc arid lead mining district, Cherokee County, Kansas: Kansas Geol. Survey, Bull. 76, pt. 5, p. 113-120. [available online]
George, P. W. (1928) Experiments with the Eötvös torsion balance in the Tri-State zinc and lead district: Am. Inst. Mining Metall. Engineers, Geophysical Prospecting Vol., p. 561-571.
Grohskopf, J. G., and Reinoehl, C. O. (1933) Magnetic surveys; Missouri Bur. Mines, 57th Biennial Rep., Appendix 14, p. 10-13.
Harbaugh, J. W. (1950) Biogeochemical investigations in the Tri-State district: Econ. Geol., v. 45, p. 548-567.
Jakosky, J. J., Dreyer, R. M., and Wilson, C. H. (1942) Geophysical investigations in the Tri-State zinc and lead mining district: Kansas Geol. Survey, Bull. 44, p. 1-151. [available online]
Missouri Geological Survey and Water Resources (1943) Magnetic map of Missouri showing anomalies of vertical intensity: 1 sheet.
Missouri Geological Survey and Water Resources (1943a) Gravimetric map of Missouri: 1 sheet.
United States Geological Survey (1947) Aeromagnetic map of part of Tri-State Mining District: Geophys. Inv. Prelim. Map 7, open file, 2 sheets.
Kansas Geological Survey
Comments to webadmin@kgs.ku.edu
Web version Jan. 20, 2014. Original publication date 1959.
URL=http://www.kgs.ku.edu/Publications/Bulletins/137/Hambleton/index.html