Kansas Geological Survey, Bull. 119, part 1, originally published in 1956
Next page--Hydrology, Summary, References
Prepared by the United States Geological Survey and the State Geological Survey of Kansas with the cooperation of the Division of Sanitation of the Kansas State Board of Health, the Division of Water Resources of the Kansas State Board of Agriculture, and the City of Wichita, Kansas.
Originally published in 1956 as Kansas Geological Survey Bull. 119, part 1. This is, in general, the original text as published. The information has not been updated. An Acrobat PDF version (15 MB) is also available; plate available separately.
This report describes an investigation of the availability of ground water in the well field of the city of Wichita within the area known as the Equus beds in south-central Kansas, and the general hydrology of the Equus beds area.
By January 1, 1955, the City of Wichita had pumped 330,000 acre-feet of water from the well field. As of January 1955, the water level had declined a maximum of 32 feet in the well field. The decline of the water table is small, however, compared to the thickness of the saturated deposits. In January 1955, the depth to water in the well field ranged from 5 to 47 feet. The water table is affected by the city's pumping in an area of about 100 square miles, As of January 1955, about 67 percent of the water pumped from the well field by the city of Wichita had come from recharge by precipitation. The primary source of water for recharge to the well field is local precipitation falling on the land surface, and the seasonal rise of the water levels correlates closely with precipitation.
The water-bearing materials consist of unconsolidated deposits of sand, gravel, silt, and clay of Pleistocene age. The hydraulic gradient of the water table in the well field is toward Little Arkansas River, and some water is being discharged into it, although most of the water moving across the well field is intercepted by pumping.
If the Wichita well field is expanded, a larger area will be influenced by pumping, and the perennial yield will be correspondingly larger. If the well field were expanded to include all the Equus beds area, the perennial yield would be many times larger than the amount of water pumped in 1955 by the city of Wichita.
The hydrology and geology may be favorable in parts of the well field for artificial recharge. Additional data must be collected before the best method and the economic feasibility of artificially recharging the well field can be determined.
A map of the generalized geology of the Equus beds area and figures showing the water-table contours, changes in water levels during specific periods, cross sections, pumpage charts, precipitation graphs, and hydrographs of water-level fluctuations are given in this report,
Plate 1--Map of Wichita well field showing location of wells
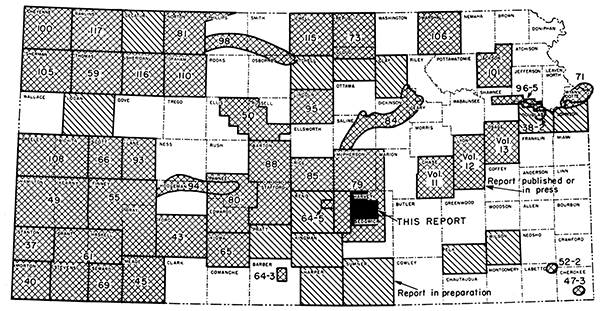
This study of the ground-water hydrology of the Equus beds area has been made as a part of the cooperative program of groundwater investigations in Kansas by the United States Geological Survey, the State Geological Survey of Kansas, the Division of Sanitation of the Kansas State Board of Health, the Division of Water Resources of the Kansas State Board of Agriculture, and the City of Wichita, Kansas. The status of the Kansas cooperative ground-water program is shown in Figure 1.
Figure 1--Map of Kansas showing area covered by this report and other areas for which cooperative ground-water reports have been published or are in preparation.
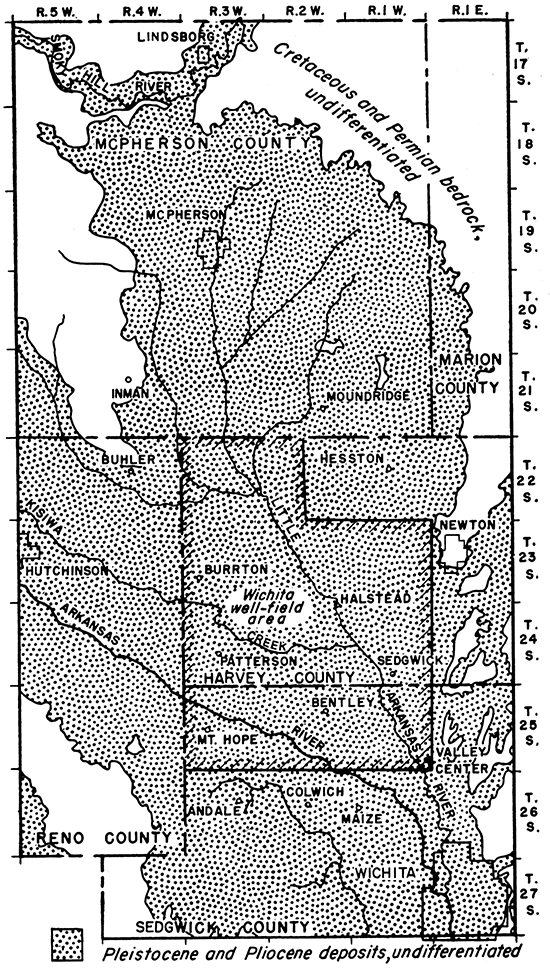
The extent of the Equus beds area is shown in Figure 2. It includes parts of McPherson, Harvey, Reno, and Sedgwick Counties. The area shown in Figure 2 comprises 65 townships or about 2,340 square miles. The deposits now loosely referred to as the Equus beds in this area include all Pliocene and Pleistocene deposits. The Pliocene and Pleistocene deposits are bordered by Permian and Cretaceous rocks. A smaller area comprising 10% townships or about 378 square miles, which contains the municipal wells of the city of Wichita, is referred to in this report as the well-field area.
Figure 2--Generalized geologic map of Equus beds area and outline of well-field area. (Adapted from Williams and Lohman, 1949, pl. 1.)
Williams and Lohman (1947,1949) made an extensive study of the ground-water resources of the Equus beds area. This report presents the progress of studies to determine the effects that pumping by the city of Wichita has had on the water level in the Equus beds area, how much water has been removed from storage, how much water remains in storage, the recharge characteristics of the area, and the long-term yield of the water-bearing deposits.
Appreciation and gratitude are expressed for the interest and personal assistance of R. H. Hess, Director, Water Supply and Sewage Treatment, O. K. Brandon, Water-Supply Supervisor, and S. A. Smith, Well-Field Supervisor, of the Wichita Water Department. The writer is indebted to many farmers who live in the well-field area for their courtesy in supplying information concerning the decline of the water table.
The manuscript of this report has been reviewed by several members of the Federal and State Geological Surveys; by R. H. Hess, Superintendent, Water Supply and Sewage Treatment Divisions, Wichita; by Dwight Metzler, Director and Chief Engineer, and W. O. Hilton, Division of Sanitation, Kansas State Board of Health; and by R. V. Smrha, Chief Engineer, and George S. Knapp, Engineer, Division of Water Resources, Kansas State Board of Agriculture.
The following climatic data are presented to provide a basis for interpreting and correlating water-level fluctuations due to weather phenomena and have been taken from the U. S. Weather Bureau records for the Wichita station. The records of the Wichita weather station have been used because they represent the average weather for the area outlined in this report, and the Wichita station is the only complete meteorological station in the area.
Wichita has a mean annual temperature of 57.0°F. The city lies in the path of masses of warm, moist air moving northward from the Gulf of Mexico, which alternate with currents of cold, dry air moving southward from the polar regions. Consequently, the weather is subject to frequent and abrupt changes. Summers are generally warm; winters are generally mild. The recorded temperatures at Wichita have ranged from 114° on July 12, 1936, to -22° on February 12, 1899. On an average, 51 days a year have temperatures of 90° or above, and 2 days a year have temperatures of 0° or lower.
Average annual precipitation based on a 67-year record is 30.06 inches, the greatest precipitation falling in the spring and summer and the least in the late fall and winter. In 1951, the wettest year on record, 50.48 inches of precipitation fell; in 1954, the driest year on record, 14.53 inches fell. Monthly and annual precipitation data for the Wichita weather station are given in Table 1.
Table 1--Monthly and annual precipitation, in inches, at Wichita, Kansas, 1888-1954.
| Year | Jan. | Feb. | Mar. | Apr. | May | June | July | Aug. | Sept. | Oct. | Nov. | Dec. | Ann. |
|---|---|---|---|---|---|---|---|---|---|---|---|---|---|
| 1888 | 1.04 | 7.77 | 1.89 | 1.36 | 1.29 | 0.71 | |||||||
| 1889 | 0.82 | 0.57 | 2.41 | 5.18 | 3.88 | 7.89 | 4.72 | 3.79 | 2.10 | 2.14 | 1.14 | .03 | 34.67 |
| 1890 | 2.12 | .35 | .14 | 3.36 | 2.17 | 5.05 | .95 | 2.60 | 1.96 | 2.39 | 1.72 | .99 | 24.07 |
| 1891 | 2.66 | 1.95 | 3.36 | 1.26 | 9.15 | 4.90 | 5.59 | .40 | .72 | 2.95 | .47 | 1.12 | 34.53 |
| 1892 | .31 | 2.62 | 4.03 | 2.05 | 5.83 | 1.70 | 2.75 | 4.06 | 2.12 | 2.52 | .24 | 1.71 | 29.94 |
| 1893 | .19 | .80 | 1.09 | .25 | 2.22 | 3.41 | 5.02 | 1.51 | 2.10 | .02 | .91 | .67 | 18.19 |
| 1894 | .78 | 1.01 | .72 | 3.33 | 2.02 | 9.43 | 1.72 | .94 | 9.72 | 2.10 | .01 | .75 | 32.44 |
| 1895 | .57 | 1.19 | 1.81 | .40 | 2.77 | 4.47 | 2.74 | 7.67 | .86 | .81 | 1.80 | 1.37 | 26.46 |
| 1896 | .62 | .37 | 1.58 | 3.26 | 3.02 | 7.10 | 3.40 | .31 | 3.08 | 2.27 | 1.42 | .63 | 27.06 |
| 1897 | 1.23 | 1.31 | 3.34 | 3.66 | 2.48 | 1.99 | 1.49 | 4.33 | 1.22 | 3.89 | .10 | .97 | 26.01 |
| 1898 | 1.97 | 3.04 | .95 | 5.16 | 8.32 | 5.24 | 5.30 | 2.78 | 1.55 | 2.02 | 1.13 | 2.00 | 39.46 |
| 1899 | .38 | .20 | 2.53 | 1.58 | 5.72 | 6.81 | 4.62 | 2.45 | 4.75 | 1.55 | 1.09 | 1.81 | 33.49 |
| 1900 | .10 | 2.10 | .83 | 2.77 | 6.50 | 3.41 | 2.16 | 1.69 | 5.64 | 5.71 | .21 | .73 | 31.85 |
| 1901 | .25 | 1.29 | 1.52 | 5.83 | 1.40 | 3.16 | 3.44 | 2.00 | 3.04 | 3.86 | 1.16 | .52 | 27.47 |
| 1902 | .32 | .75 | 2.79 | .87 | 10.33 | 7.11 | 4.12 | 5.28 | 2.69 | 2.02 | 1.76 | .69 | 38.73 |
| 1903 | .08 | 1.71 | 1.61 | 3.31 | 7.97 | 1.26 | 1.46 | 4.46 | 2.25 | 5.96 | .75 | .26 | 31.08 |
| 1904 | .12 | .04 | 4.23 | 2.65 | 5.74 | 5.69 | 7.46 | 1.42 | 3.10 | .35 | .07 | .24 | 31.11 |
| 1905 | .45 | .64 | 3.67 | 2.14 | 4.24 | 5.53 | 5.39 | 1.34 | 6.70 | 1.63 | 2.59 | .21 | 34.53 |
| 1906 | .53 | .58 | 1.68 | 3.09 | 3.40 | 1.82 | 6.88 | 3.30 | 4.33 | 2.12 | 2.92 | .35 | 31.00 |
| 1907 | 2.97 | 1.53 | .81 | .91 | 4.12 | 3.62 | 3.37 | 5.80 | 1.88 | 4.10 | .79 | 1.61 | 31.51 |
| 1908 | .16 | 2.50 | .80 | 1.77 | 9.28 | 5.85 | 2.96 | 6.57 | 3.21 | 2.24 | 2.34 | .03 | 37.71 |
| 1909 | .27 | .89 | 1.47 | 1.59 | 3.64 | 5.71 | 3.26 | 1.01 | 1.77 | 2.95 | 6.69 | 1.31 | 30.56 |
| 1910 | .55 | .63 | T | .96 | 5.11 | 1.94 | 1.24 | 4.52 | 1.56 | .52 | T | .69 | 17.72 |
| 1911 | .02 | 4.23 | .10 | 2.19 | 4.66 | T | 5.95 | 4.32 | 10.56 | .94 | .87 | 3.05 | 36.89 |
| 1912 | .12 | 2.32 | 3.07 | 3.87 | 5.18 | 3.27 | 1.28 | 3.14 | 3.36 | 2.18 | .50 | .85 | 29.14 |
| 1913 | .41 | 2.43 | .30 | 1.83 | .97 | 1.36 | 1.28 | T | 3.52 | 4.18 | 1.73 | 3.93 | 21.94 |
| 1914 | T | 1.58 | 1.13 | 1.70 | 4.31 | 3.83 | 1.60 | 3.68 | 3.39 | 1.38 | .11 | .61 | 23.32 |
| 1915 | 1.35 | 4.61 | 1.97 | 3.29 | 8.34 | 5.90 | 3.82 | 4.81 | 4.69 | 1.66 | .39 | .40 | 41.23 |
| 1916 | 1.90 | .13 | 1.50 | 3.87 | 5.11 | 8.32 | .10 | 2.12 | .86 | 2.32 | 2.93 | .46 | 29.62 |
| 1917 | .41 | T | .66 | 2.52 | 4.84 | .32 | 1.41 | 4.69 | .92 | .11 | .02 | .21 | 16.11 |
| 1918 | .89 | 1.93 | 2.44 | 4.14 | 5.86 | 1.29 | 2.11 | 5.19 | 1.80 | 5.98 | 3.62 | 3.31 | 38.56 |
| 1919 | T | 2.49 | 2.37 | 4.40 | 4.72 | 2.63 | .71 | 1.61 | .23 | 1.64 | 1.99 | .14 | 22.98 |
| 1920 | .41 | .32 | 1.13 | 1.56 | 2.97 | 3.76 | 4.05 | 4.40 | 4.16 | 2.75 | 2.68 | 1.76 | 29.95 |
| 1921 | 1.30 | .14 | 2.18 | 4.09 | 1.41 | 4.31 | .71 | 4.14 | 4.05 | .52 | T | .52 | 23.37 |
| 1922 | .88 | 1.38 | 3.39 | 6.12 | 5.60 | 3.99 | 8.46 | 2.12 | 2.00 | 2.59 | 5.35 | .06 | 41.94 |
| 1923 | .02 | T | 1.70 | 1.64 | 5.47 | 14.43 | .89 | .42 | 3.26 | 5.52 | 1.26 | .67 | 35.28 |
| 1924 | .31 | .58 | 2.61 | 4.38 | 2.93 | .36 | 3.64 | 1.70 | 2.51 | 1.70 | .80 | 1.21 | 22.73 |
| 1925 | .76 | .10 | .54 | 4.55 | 2.09 | 3.68 | 1.72 | 2.52 | 4.43 | 1.33 | 1.64 | .59 | 23.95 |
| 1926 | .80 | .44 | 2.16 | 1.64 | 2.47 | 3.03 | 3.47 | 2.74 | 5.01 | 5.68 | 1.63 | 1.11 | 30.18 |
| 1927 | .55 | 1.02 | 3.90 | 4.80 | 2.13 | 4.66 | 3.85 | 5.90 | 3.93 | 2.96 | .32 | .83 | 34.85 |
| 1928 | .10 | 1.79 | 2.24 | 5.26 | 2.79 | 12.10 | 3.46 | .70 | .58 | 1.48 | 5.45 | 1.58 | 37.53 |
| 1929 | 2.08 | .65 | .88 | 4.04 | 5.84 | 7.13 | 7.08 | 1.30 | .98 | 3.23 | 1.59 | .04 | 34.84 |
| 1930 | 1.24 | T | .22 | 1.68 | 5.02 | 2.36 | 1.06 | 2.96 | 5.29 | 2.55 | 3.05 | .58 | 26.01 |
| 1931 | .29 | .64 | 2.52 | 2.49 | 2.37 | 5.50 | :97 | 1.91 | 4.58 | 1.19 | 6.21 | .69 | 29.36 |
| 1932 | 1.49 | .94 | .77 | 2.33 | 1.90 | 7.92 | 2.53 | 2.30 | 1.26 | .40 | .18 | 1.67 | 23.69 |
| 1933 | .10 | .34 | 1.72 | .86 | 2.29 | .83 | 2.34 | 8.50 | 1.39 | .74 | .85 | 1.85 | 21.81 |
| 1934 | .72 | 1.03 | 1.16 | 3.10 | 4.14 | 1.78 | 1.77 | .38 | 4.25 | 1.89 | 2.90 | 1.03 | 24.15 |
| 1935 | .87 | 1.39 | .98 | 1.86 | 11.22 | 7.21 | .39 | 1.55 | 3.11 | 4.41 | 2.99 | .25 | 36.23 |
| 1936 | .94 | .02 | T | .58 | 3.30 | 1.04 | .21 | .04 | 4.84 | 3.77 | .01 | .83 | 15.58 |
| 1937 | 1.54 | .73 | 2.80 | .57 | 4.13 | 3.99 | 4.77 | 2.86 | 1.80 | 1.12 | .75 | .58 | 25.64 |
| 1938 | .12 | 2.48 | 1.91 | 2.85 | 8.14 | 4.49 | 2.24 | 5.60 | 2.62 | .16 | 2.05 | .15 | 32.81 |
| 1939 | 1.09 | 1.93 | 1.57 | 2.14 | 3.25 | 8.90 | .72 | 5.84 | .30 | 1.14 | .81 | .95 | 28.64 |
| 1940 | 1.40 | 1.43 | .74 | 6.15 | 5.82 | 4.85 | .94 | 2.87 | 6.14 | 1.05 | 3.82 | 1.56 | 36.77 |
| 1941 | 1.53 | 1.09 | 1.11 | 2.83 | 2.89 | 7.05 | 2.41 | 3.54 | 4.29 | 4.81 | .78 | .92 | 33.25 |
| 1942 | .23 | 1.93 | .88 | 7.08 | 1.67 | 8.69 | 2.34 | 4.51 | 7.21 | 3.77 | .68 | 3.14 | 42.13 |
| 1943 | .27 | .67 | 1.21 | 1:94 | 6.59 | 3.43 | 6.51 | 1.95 | 3.14 | 1.83 | .07 | 2.33 | 29.94 |
| 1944 | 1.01 | 1.34 | 4.55 | 12.42 | 2.04 | 1.60 | 5.49 | 4.77 | 2.20 | 2.20 | 1.93 | 3.98 | 43.53 |
| 1945 | 1.07 | .84 | 1.85 | 6.79 | 1.28 | 4.00 | 5.01 | 4.11 | 10.58 | .51 | .05 | .62 | 36.71 |
| 1946 | 2.21 | 1.23 | 1.81 | 1.87 | 2.11 | 2.71 | .32 | 2.90 | 1.27 | 4.32 | 2.14 | .78 | 23.67 |
| 1947 | .71 | .52 | 2.91 | 5.20 | 4.69 | 2.57 | 2.89 | .82 | .25 | 1.50 | .89 | 2.98 | 25.93 |
| 1948 | 1.00 | 1.19 | 1.51 | 1.65 | 1.86 | 9.76 | 6.39 | 2.72 | 1.05 | .67 | 3.30 | .25 | 31.35 |
| 1949 | 6.29 | 1.80 | 2.01 | 3.85 | 6.15 | 3.16 | 6.97 | 1.13 | 3.62 | 1.91 | .06 | 1.22 | 38.17 |
| 1950 | .52 | 1.61 | .50 | .88 | 2.24 | 4.02 | 13.37 | 5.93 | 1.04 | .48 | .26 | .02 | 30.87 |
| 1951 | 1.03 | 2.58 | 2.69 | 6.33 | 7.60 | 10.07 | 4.45 | 5.38 | 6.59 | 2.05 | 1.47 | .24 | 50.48 |
| 1952 | .41 | .35 | 2.68 | 1.97 | 2.31 | 1.08 | 4.94 | 2.52 | .28 | .00 | 2.40 | 1.09 | 20.03 |
| 1953 | .15 | .82 | 3.35 | .57 | 2.02 | 2.17 | 2.39 | .82 | .53 | 3.77 | 1.46 | 1.06 | 19.11 |
| 1954 | .09 | .57 | 1.30 | 1.54 | 4.84 | .94 | .19 | .96 | 1.09 | 2.83 | T | .18 | 14.53 |
| Average | .85 | 1.21 | 1.80 | 3.05 | 4.35 | 4.52 | 3.28 | 3.12 | 3.10 | 2.28 | 1.54 | 1.04 | 30.06 |
| T indicates trace. not enough to measure. | |||||||||||||
Thunderstorms occur on an average of 52 days a year, most frequently during spring and summer. Measurable snow has fallen between October and April; the greatest average amount, 3.6 inches, falls during February. March and April are the windiest months of the year, the wind velocity averaging 14.9 and 14.7 mph, respectively. August is the least windy, the velocity averaging 11.3 mph. The average annual wind velocity is 12.8 mph. The sun shines in Wichita during 69 percent of the time possible.
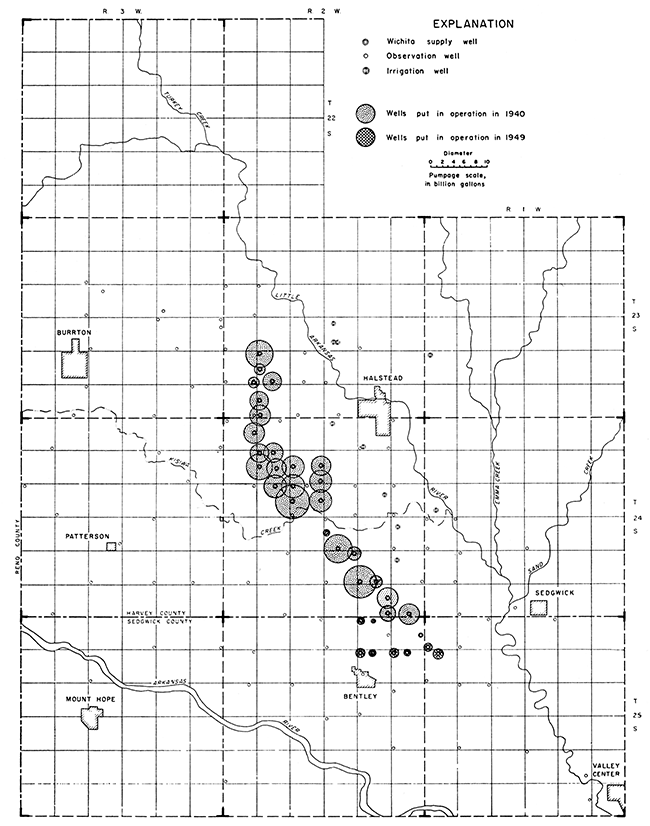
Prior to 1940, the city of Wichita obtained its water supply from wells in the Arkansas River valley near the filtration plant. The city began pumping from the well field in the Equus beds area on September 1, 1940. At that time water was pumped from 25 wells. In 1949, 10 more wells were added to the system. The water from these wells flows through a 48-inch pipeline to the treatment plant at Wichita. The city of Wichita is by far the largest user of water in or near the well field.
A considerable increase in water consumption by the city of Wichita has resulted in a corresponding increase in withdrawal from the well field. From 1940 through 1954 a small quantity of water was pumped from wells near the city filtration plant. The water from these wells is of poor quality, but by mixing this water with water of good quality from the well field, a water of acceptable quality is obtained. Water is pumped from the wells near the filtration plant mostly during the summer when the water demand in Wichita is greater than the quantity of water that can be pumped through the 48-inch pipeline.
The quantity of water pumped from the wells near the filtration plant increased greatly from 1952 through 1954. Figure 3 shows the amount of pumpage by the city of Wichita from the well field, the amount obtained from wells near the filtration plant, and the total amount of pumpage. The quantity of water pumped from the well field is given by months also in Table 2. The quantity of water pumped from each well in the well field during the period 1940-1954 is shown in Figure 4. The largest quantities of water have been pumped from the wells that were put in operation in 1940.
Figure 3--Annual pumpage of water by city of Wichita, 1940-54.
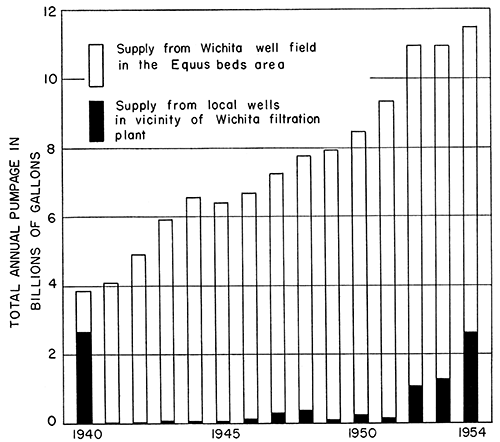
Table 2--Pumpage by city of Wichita from well field, in million gallons, 1940-54.
| Year | 1940 | 1941 | 1942 | 1943 | 1944 | 1945 | 1946 | 1947 | 1948 | 1949 | 1950 | 1951 | 1952 | 1953 | 1954 |
|---|---|---|---|---|---|---|---|---|---|---|---|---|---|---|---|
| Jan. | 277.4 | 317.9 | 393.4 | 542.2 | 505.0 | 4988 | 510.7 | 592.8 | 641.3 | 670.1 | 674.7 | 805.1 | 733.1 | 656.8 | |
| Feb. | 247.9 | 349.9 | 388.5 | 493.2 | 444.2 | 451.4 | 472.6 | 511.8 | 559.3 | 615.4 | 655.9 | 744.0 | 665.7 | 635.8 | |
| Mar. | 269.7 | 337.5 | 422.6 | 516.3 | 514.8 | 489.0 | 507.3 | 521.6 | 507.2 | 630.6 | 732.0 | 794.9 | 722.0 | 653.5 | |
| Apr. | 320.6 | 361.1 | 484.7 | 534.3 | 476.0 | 493.0 | 476.3 | 458.1 | 575.9 | 674.2 | 672.8 | 732.3 | 747.0 | 747.2 | |
| May | 336.4 | 381.5 | 495.9 | 570.1 | 578.5 | 496.9 | 567.8 | 696.2 | 669.9 | 752.0 | 772.9 | 914.7 | 921.8 | 705.6 | |
| June | 415.4 | 444.1 | 543.3 | 597.2 | 566.9 | 623.1 | 880.6 | 686.1 | 745.0 | 819.4 | 806.2 | 897.6 | 941.7 | 788.0 | |
| July | 459.6 | 459:9 | 653.6 | 629.7 | 654.6 | 805.4 | 737.8 | 744.3 | 833.5 | 730.5 | 920.4 | 1,077.3 | 1,034.8 | 993.9 | |
| Aug. | 483.3 | 625.9 | 643.3 | 652.9 | 665.7 | 723.7 | 835.2 | 749.4 | 821.0 | 758.5 | 993.8 | 1,102.7 | 1,027.4 | 975.7 | |
| Sept. | 297.6 | 447.5 | 455.7 | 555.1 | 586.1 | 570.4 | 559.6 | 741.4 | 754.9 | 672.4 | 736.2 | 841.9 | 1,068.3 | 1,001.5 | 866.6 |
| .Oct. | 378.7 | 336.0 | 435.8 | 539.2 | 524.7 | 552.4 | 588.4 | 644.1 | 643.3 | 657.0 | 720.5 | 869.7 | 955.1 | 863.8 | 800.9 |
| Nov. | 316.6 | 345.7 | 384.6 | 517.8 | 496.5 | 479.5 | 494.7 | 549.4 | 562.2 | 617.8 | 693.0 | 779.0 | 1,059.3 | 809.0 | 713.8 |
| Dec. | 286.4 | 320.9 | 408.6 | 510.4 | 498.3 | 490.2 | 514.1 | 459.1 | 504.0 | 576.3 | 730.6 | 832.1 | 672.3 | 755.0 | 708.6 |
| Annual pumpage |
1,279.3 | 4,260.4 | 4,962.5 | 6,149.8 | 6,641.5 | 6,498.3 | 6,738.1 | 7,382.3 | 7,424.7 | 7,876.6 | 8,531.0 | 9,551.4 | 10,823.6 | 10,222.3 | 9,246.4 |
| Average daily pumpage |
10.5 | 11.7 | 13.6 | 16.9 | 18.2 | 17.8 | 18.5 | 20.2 | 20.3 | 21.6 | 23.4 | 26.2 | 29.7 | 28.0 | 25.3 |
| Annual pumpage, in thousand acre-feet |
3.9 | 13.1 | 15.2 | 18.9 | 20.4 | 20.0 | 20.7 | 22.7 | 22.8 | 24.2 | 26.2 | 29.3 | 33.2 | 31.4 | 28.4 |
Figure 4--Water pumped from each well in well field by city of Wichita, 1940-54.
Six municipalities other than Wichita use ground water from the area designated on Figure 2 as the well field. These cities are Burrton, Halstead, Mount Hope, Newton, Sedgwick, and Valley Center. During 1954, the average daily consumption by each municipality was: Burrton, 74,000 gallons; Halstead, 300,000 gallons; Mount Hope, 55,000 gallons; Newton, 2,200,000 gallons; Sedgwick, 250,000 gallons; and Valley Center, 200,000 gallons. The total average use of water by these six municipalities was 3,079,000 gallons per day, or 1,122,000,000 gallons per year (3,460 acre-feet).
The daily use by these cities increased substantially during the decade preceding 1955. The increase in use in these cities was caused by increased domestic and commercial use. In Newton, which is just east of the well field as shown in Figure 2, use of water for ordinary purposes has increased but total usage has increased very little because the Atchison, Topeka and Santa Fe Railway is now using diesel locomotives and does not need the large quantities of water formerly used for the operation of steam locomotives.
About 175,000 gallons of ground water a day, or a total of 64 million gallons, was used during 1954 for rural domestic and stock use in the well-field area.
By the end of 1954, 10 irrigation wells in the well field were in operation or under construction. About 900 acres was being irrigated with water .from wells. Based on estimates by the owners, tenants, and the Soil Conservation Service, the amount of irrigation water pumped from wells during 1954 was about 700 acre-feet (228 million gallons). Some irrigation wells were completed late in 1954 and used only small quantities of water in that year. Three irrigators southeast of Halstead use surface water from Little Arkansas River to irrigate about 120 acres. The quantity of water used in 1954 from the river was about 100 acre-feet.
An observation-well program was started in the Equus beds area in 1937. Some original observation wells have been replaced, and many new wells have been added since 1937. As of January 1955, there were 223 observation wells in the well-field area, most of which are measured monthly. Some wells are measured more frequently than monthly, but others, only quarterly. Three wells are equipped with automatic water-stage recorders, which furnish a continuous record of water-level fluctuations.
The records obtained from these observation wells are published annually by the U. S. Geological Survey in the series of water-supply papers entitled "Water levels and artesian pressures in observation wells in the United States." The numbers of these water-supply papers are as follows:
| Year | Water-Supply Paper No. |
|---|---|
| 1935 | 777 |
| 1936 | 817 |
| 1937 | 840 |
| 1938 | 845 |
| 1939 | 886 |
| 1940 | 908 |
| 1941 | 938 |
| 1942 | 946 |
| 1943 | 988 |
| 1944 | 1018 |
| 1945 | 1025 |
| 1946 | 1073 |
| 1947 | 1098 |
| 1948 | 1128 |
| 1949 | 1158 |
| 1950 | 1167 |
| 1951 | 1193 |
| 1952 | 1223 |
| 1953 | 1267 |
The locations of wells for which data are being collected are shown on Plate 1. These wells include Wichita supply wells, observation wells, and irrigation wells. Data pertaining to the many domestic and stock wells in the area have not been included in this report.
The observation wells, except for the pumped wells of the city of Wichita, are chiefly 1 1/4-inch drive-point wells and are used only for measuring water levels. Near each Wichita supply well are two 1 1/4-inch observation wells, at distances of 100 and 500 feet, respectively.
Excepting 12 wells, the well numbers on Plate 1 are numbers that were originally assigned in the field. These numbers are the same numbers that are used in the annual series of water level reports issued by the U. S. Geological Survey. The numbers of 12 wells have been changed to agree with the numbers used by the city of Wichita. The 12 well numbers formerly used in the annual series of water-level reports and the numbers as changed in this report are as follows:
| Number formerly used in water-supply papers |
Number used by city of Wichita and in this report |
|---|---|
| M-4 | 3 |
| M-3 | 4 |
| M-8 | 7 |
| M-9 | 8 |
| M-11 | 9 |
| M-20 | 11 |
| M-7 | 15 |
| M-15 | 16 |
| M-16 | 17 |
| M-17 | 18 |
| M-18 | 19 |
| M-19 | 20 |
Table 3 correlates the numbers used in this report with the numbers used by Williams and Lohman (1949). On Plate 1, a line below a well symbol indicates that there are 2 or 3 observation wells screened at different depths at that location.
Table 3--Correlation of well numbers used in this report with well numbers used in Bulletin 79, and depths of wells
| Well No. in this report |
Well No. used in Bull. 79 |
Location | Depth of well, feet |
|---|---|---|---|
| *1 | 311 | NW NW sec. 29-23-2 | 222 |
| 1a | 312 | NW NW sec. 29-23-2 | 71 |
| 1b | 313 | NW NW sec. 29-23-2 | 69 |
| *2 | 314 | NW SW sec. 29-23-2 | 234 |
| 2a | 315 | NW SW sec. 29-23-2 | 67 |
| 2b | 316 | NW SW sec. 29-23-2 | 68 |
| *3 | 322 | SE SE sec. 30-23-2 | 234 |
| 3a | 323 | SE SE sec. 30-23-2 | 69 |
| 3b | 324 | SE SE sec. 30-23-2 | 69 |
| *4 | 317 | SE SW sec. 29-23-2 | 238 |
| 4a | 318 | SE SW sec. 29-23-2 | 66 |
| 4b | 319 | SE SW sec. 29-23-2 | 97 |
| *5 | 330 | NW SW sec. 32-23-2 | 237 |
| 5a | 331 | NW SW sec. 32-23-2 | 71 |
| 5b | 332 | NW SW sec. 32-23-2 | 59 |
| *6 | 333 | SW SW sec. 32-23-2 | 257 |
| 6a | 334 | SW SW sec. 32-23-2 | 51 |
| 6b | 335 | SW SW sec. 32-23-2 | 51 |
| *7 | 415 | SE NE sec. 6-24-2 | 257 |
| 7a | 416 | SE NE sec. 6-24-2 | 51 |
| 7b | 417 | SE NE sec. 6-24-2 | 54 |
| *8 | 423 | NW NW sec. 8-24-2 | 248 |
| 8a | 424 | NW NW sec. 8-24-2 | 51 |
| 8b | 425 | NW NW sec. 8-24-2 | 51 |
| *9 | 429 | SW NW sec. 8-24-2 | 227 |
| 9a | 430 | SW NW sec. 8-24-2 | 48 |
| 9b | 431 | SW NW sec. 8-24-2 | 48 |
| *10 | 419 | NE NW sec. 8-24-2 | 259 |
| 10a | 420 | NE NW sec. 8-24-2 | 51 |
| 10b | 421 | NE NW sec. 8-24-2 | 51 |
| *11 | 426 | NW SE sec. 8-24-2 | 248 |
| 11a | 427 | NW SE sec. 8-24-2 | 51 |
| 11b | 428 | NW SE sec. 8-24-2 | 51 |
| *12 | 436 | NW SW sec. 9-24-2 | 236 |
| 12a | 437 | NW SW sec. 9-24-2 | 69 |
| 12b | 438 | NW SW sec. 9-24-2 | 69 |
| *13 | 459 | NW NE sec. 17-24-2 | 245 |
| 13a | 460 | NW NE sec. 17-24-2 | 51 |
| 13b | 461 | NW NE sec. 17-24-2 | 51 |
| *14 | 450 | NW NW sec. 16-24-2 | 102 |
| 14a | 451 | NW NW sec. 16-24-2 | 50 |
| 14b | 439 | SW SW sec. 9-24-2 | 57 |
| *15 | 455 | NW SW sec. 16-24-2 | 122 |
| 15a | 456 | NW SW sec. 16-24-2 | 51 |
| 15b | 457 | SW NW sec. 16-24-2 | 51 |
| *16 | 433 | SE NE sec. 9-24-2 | 193 |
| 16a | 434 | SE NE sec. 9-24-2 | 67 |
| 16b | 435 | SE NE sec. 9-24-2 | 62 |
| *17 | 440 | SE SE sec. 29-24-2 | 193 |
| 17a | 441 | SE SE sec. 29-24-2 | 57 |
| 17b | 442 | SE SE sec. 29-24-2 | 56 |
| *18 | 452 | NE SE sec. 16-24-2 | 185 |
| 18a | 453 | NE SE sec. 16-24-2 | 51 |
| 18b | 454 | NE SE sec. 16-24-2 | 51 |
| *19 | 465 | SE SW sec. 22-24-2 | 158 |
| 19a | 466 | SE SW sec. 22-24-2 | 72 |
| 19b | 467 | SE SW sec. 22-24-2 | 63 |
| *20 | 479 | NE NE sec. 27-24-2 | 145 |
| 20a | 480 | NE NE sec. 27-24-2 | 60 |
| 20b | 481 | NE NE sec. 27-24-2 | 51 |
| *21 | 473 | SW SW sec. 26-24-2 | 80 |
| 21a | 474 | SW SW sec. 26-24-2 | 51 |
| 21b | 475 | SW SW sec. 26-24-2 | 51 |
| *22 | 476 | SW SE sec. 26-24-2 | 82 |
| 22a | 477 | SW SE sec. 26-24-2 | 51 |
| 22b | 478 | SE SW sec. 26-24-2 | 50 |
| *23 | 487 | SE NE sec. 35-24-2 | 204 |
| 23a | 488 | SE NE sec. 35-24-2 | 51 |
| 23b | 489 | SE NE sec. 35-24-2 | 51 |
| *24 | 491 | SE SE sec. 35-24-2 | 97 |
| 24a | 492 | SE SE sec. 35-24-2 | 54 |
| 24b | 493 | SE SE sec. 35-24-2 | 51 |
| *25 | 494 | SW SE sec. 36-24-2 | 189 |
| 25a | 495 | SE SE sec. 35-24-2 | 50 |
| 25b | 567 | NE NW sec. 1-25-2 | 51 |
| *26 | ‡ | SW NE sec. 22-24-2 | 195 |
| 26a | ‡ | SW NW sec. 22-24-2 | 81 |
| 26b | ‡ | SW NW sec. 22-24-2 | 79 |
| *27 | ‡ | NW NW sec. 2-25-2 | 215 |
| 27a | ‡ | NW NW 2-25-2 | 82 |
| 27b | ‡ | NE NE sec. 3-25-2 | 80 |
| *28 | ‡ | NE NW sec. 2-25-2 | 220 |
| 28a | ‡ | NE NW sec. 2-25-2 | 80 |
| 28b | ‡ | NW NE sec. 2-25-2 | 82 |
| *29 | ‡ | NW NW sec. 11-25-2 | 225 |
| 29a | ‡ | NW NW sec. 11-25-2 | 97 |
| 29b | ‡ | NW NW sec. 11-25-2 | 103 |
| *30 | ‡ | NE NW sec. 11-25-2 | 225 |
| 30a | ‡ | NE NW sec. 11-25-2 | 72 |
| 30b | ‡ | NW NE sec. 11-25-2 | 61 |
| *31 | ‡ | NW NW sec. 12-25-2 | 197 |
| 31a | ‡ | NW NW sec. 12-25-2 | 87 |
| 31b | ‡ | NW NW sec. 12-25-2 | 62 |
| *32 | ‡ | NE NW sec. 16-25-2 | 185 |
| 32a | ‡ | NE NW sec. 16-25-2 | 71 |
| 32b | ‡ | NE NW sec. 16-25-2 | 71 |
| *33 | ‡ | NE SE sec. 1-25-2 | 170 |
| 33a | ‡ | NE SE sec. 1-25-2 | 54 |
| 33b | ‡ | SE NE sec. 1-25-2 | 75 |
| *34 | ‡ | SW SW sec. 6-25-1 | 150 |
| 34a | ‡ | SW SW sec. 6-25-1 | 85 |
| 34b | ‡ | SW SW sec. 6-25-1 | 85 |
| *35 | ‡ | NE NW sec. 7-25-1 | 130 |
| 35a | ‡ | NE NW sec. 7-25-1 | 85 |
| 35b | ‡ | SE SW sec. 6-25-1 | 86 |
| 101 | ‡ | NW cor. 18-23-2 | 75 |
| 102 | ‡ | NE 24-23-3 | 68 |
| 103 | ‡ | SW cor. sec. 19-23-2 | 72 |
| 104 | ‡ | NW cor. sec. 23-23-3 | 81 |
| 105 | ‡ | SE cor. sec. 18-23-2 | 60 |
| 106 | ‡ | NW cor. sec. 36-23-3 | 62 |
| 107 | ‡ | NW SW sec. 3-24-2 | 66 |
| 108 | ‡ | NW cor. sec. 11-24-3 | 38 |
| 109 | ‡ | NE cor. sec. 22-24-3 | 38 |
| 110 | ‡ | SW cor. sec. 25-24-3 | 37 |
| 111 | ‡ | SE cor. sec. 2-24-2 | 42 |
| 112 | ‡ | SE cor. sec. 25-24-2 | 40 |
| 113 | ‡ | NW cor. sec. 29-24-1 | 29 |
| 114 | ‡ | NE cor. sec. 7-25-2 | 32 |
| 115 | ‡ | NW cor. sec. 22-25-2 | 32 |
| 116 | ‡ | NW cor. sec. 17-25-1 | 30 |
| 117 | ‡ | SW cor. sec. 20-25-1 | 38 |
| 12 | 557 | NW SE sec. 26-25-1 | 54 |
| 307 | 568 | NW SW sec. 1-25-2 | 91 |
| 506 | 309 | NW NE sec. 28-23-2 | 44 |
| 507 | 310 | NW NE sec. 28-23-2 | 139 |
| 810 | 563 | NE SE sec. 35-25-1 | 25 |
| 812 | 558 | NW cor. sec. 27-25-1 | 25 |
| 815 | 549 | NE cor. sec. 17-25-1 | 31 |
| 816 | 544 | SW cor. sec. 7-25-1 | 31 |
| 817 | 411 | NW cor. sec. 1-24-2 | 31 |
| 821 | 414 | NW cor. sec. 6-24-2 | 19 |
| 824 | 404 | SE cor. sec. 22-24-1 | 42 |
| 825 | 538 | NE cor. sec. 3-25-1 | 25 |
| 826 | 540 | NE cor. sec. 5-25-1 | 18 |
| 830 | 582 | SW cor. sec. 30-25-2 | 57 |
| 832 | 401 | NE cor. sec. 19-24-1 | 129 |
| 833 | 403 | SW cor. sec. 19-24-1 | 57 |
| 834 | 583 | SW cor. sec. 9-25-3 | 18 |
| 839 | 486 | NE cor. sec. 35-24-2 | 27 |
| 840 | 572 | NE cor. sec. 9-25-2 | 61 |
| 842 | 575 | NW cor. sec. 16-25-2 | 15 |
| 853 | 445 | NW cor. sec. 13-24-2 | 37 |
| 854 | 305 | SW cor. sec. 23-23-2 | 32 |
| 870 | 578 | NW NE NE sec. 18-25-2 | 19 |
| 872 | 327 | SE cor. sec. 31-23-2 | 50 |
| 873 | 328 | SE cor. sec. 31-23-2 | 63 |
| 874 | 329 | SE cor. sec. 31-23-2 | 201 |
| 875 | 354 | SE cor. sec. 17-23-3 | 13 |
| 876 | 355 | SE cor. sec. 17-23-3 | 246 |
| 877 | 356 | SE cor. sec. 17-23-3 | 47 |
| 873 | 496 | SE cor. sec. 1-24-3 | 45 |
| 879 | 497 | SE cor. sec. 1-24-3 | 241 |
| 880 | 502 | SE cor. sec. 11-24-3 | 15 |
| 881 | 503 | 57 | |
| 883 | 470 | NW cor. sec. 26-24-2 | 38 |
| 884 | 471 | NW cor. sec. 26-24-2 | 60 |
| 885 | 472 | NW cor. sec. 26-24-2 | 99 |
| 886 | 886 | NE NE NW sec. 16-24-2 | 57 |
| 887 | 887 | NE NE NW sec. 16-24-2 | 111 |
| 888 | 299 | NW cor. sec. 17-23-2 | 12 |
| 889 | 300 | NW cor. sec. 17-23-2 | 151 |
| 890 | 511 | NE SE SE sec. 21-24-3 | |
| 891 | 516 | SE cor. sec. 31-24-3 | 7 |
| 892 | 517 | SE cor. sec. 31-24-3 | 106 |
| 893 | 518 | SE cor. sec. 31-24-3 | 163 |
| 894 | 462 | NE cor. sec. 18-24-2 | 59 |
| 895 | 463 | NE cor. sec. 18-24-2 | 238 |
| 1053B | 353 | SW NE NW sec. 16-23-3 | 37 |
| 1171 | 570 | NE cor. sec. 4-25-2 | 20 |
| 1172 | 482 | SW cor. sec. 27-24-2 | 32 |
| 1173 | 483 | NE cor. sec. 29-24-2 | 26 |
| 1174 | 407 | SW cor. sec. 32-24-1 | 32 |
| 1175 | 406 | SE cor. sec. 30-24-1 | 32 |
| 1176 | 541 | SW cor. sec. 5-25-1 | 32 |
| 1179 | 408 | SE NW SE sec. 33-24-1 | 32 |
| 1186 | 446 | SW cor. sec. 13-24-2 | 21 |
| 1187 | 402 | NW cor. 19-24-1 | 39 |
| 1188 | 464 | NE cor. sec. 21-24-2 | 21 |
| 1189 | 458 | SW cor. sec. 16-24-2 | 21 |
| 1190 | 444 | NE cor. sec. 15-24-2 | 60 |
| 1191 | 308 | SW cor. sec. 27-23-2 | 27 |
| 1193 | 363 | SE NE NE sec. 24-23-3 | 23 |
| 1194 | NE SW SW sec. 14-23-3 | 21 | |
| 1196 | 514 | SE cor. sec. 27-24-3 | 19 |
| 2072 | NE NW sec. 5-24-2 | 46 | |
| 2084 | 447 | SE cor. sec. 15-24-2 | 30 |
| 2088 | ‡ | NW cor. sec. 22-24-2 | |
| 3001 | ‡ | SW cor. sec. 30-23-2 | 47 |
| 3002 | ‡ | SW SE SE sec. 30-24-2 | 20 |
| 3003 | ‡ | SW SE SE sec. 32-24-2 | 20 |
| 3004 | ‡ | SE cor. sec. 1-25-3 | 20 |
| 3005 | ‡ | SE SW sec. 28-23-2 | 68 |
| 3030 | ‡ | SW NW SW sec. 11-25-2 | 30 |
| 3031 | ‡ | NE cor. sec. 24-24-3 | 26 |
| 3032 | ‡ | SW cor. sec. 24-24-2 | 48 |
| 3033 | ‡ | SW cor. sec. 2-24-2 | 44 |
| 3034 | ‡ | SW cor. sec. 28-24-3 | 20 |
| 3035 | ‡ | SE cor. sec. 34-23-3 | 28 |
| 3036 | ‡ | SE SW SE sec. 23-23-3 | 40 |
| 3037 | ‡ | NE NW NE sec. 5-24-2 | 70 |
| 3038 | ‡ | SE SW SW sec. 33-23-2 | 70 |
| 3039 | ‡ | SW SE sec. 34-23-2 | 37 |
| 3041 | ‡ | SE cor. sec. 3-25-3 | 17 |
| 3044 | ‡ | SW cor. sec. 14-25-2 | 20 |
| 3045 | ‡ | SW NW NW sec. 13-25-2 | 65 |
| 3050 | ‡ | SW cor. sec. 24-25-2 | 20 |
| P27 | 509 | NW cor. sec. 18-24-3 | 71 |
| P27a | 510 | NW cor. sec. 18-24-3 | 157 |
| P28 | 500 | SE cor. sec. 6-24-3 | 61 |
| P28a | 501 | SE cor. sec. 6-24-3 | 97 |
| P29 | 369 | SW SE sec. 32-23-3 | 42 |
| P29a | 370 | SW SE sec. 32-23-3 | 100 |
| P30 | 367 | NE cor. sec. 32-23-3 | 88 |
| P30a | 368 | NE cor. sec. 32-23-3 | 128 |
| P31 | 360 | SW cor. sec. 21-23-3 | 40 |
| P31a | 361 | SW cor. sec. 21-23-3 | 66 |
| P32 | 347 | SE cor. sec. 8-23-3 | 35 |
| P32a | 348 | SE cor. sec. 8-23-3 | 86 |
| P34 | 344 | NW cor. sec. 4-23-3 | 79 |
| P34a | 345 | NW cor. sec. 4-23-3 | 127 |
| P35 | 507 | SW cor. sec. 17-24-3 | 62 |
| P35a | 508 | SW cor. sec. 17-24-3 | 136 |
| *Wichita supply well. ‡Constructed since well tabulation in Bulletin 79. |
|||
[Note: This report is a cooperative product of the U. S. Geological Survey and the State Geological Survey of Kansas. The classification and nomenclature of the rock units accord for the most part with those of the two surveys, but it differs somewhat from that of the U. S. Geological Survey.]
The geology of the Equus beds area has been described by Haworth and Beede (1897), Lohman and Frye (1940), Williams and Lohman (1949), and Frye and Leonard (1952). Adjoining areas in which the geology has been described include the vicinity of Hutchinson (Williams, 1946), Rice County (Fent, 1950), and Reno County (Bayne, report in preparation). The reader is referred to the published reports for further discussion of the geology. A generalized geologic map of the Equus beds area is shown in Figure 2.
The bedrock underlying the Equus beds area comprises the Wellington formation and Ninnescah shale, of Permian age, and the Kiowa shale of Cretaceous age. The part of the Wellington formation that crops out in this area consists dominantly of soft calcareous gray and bluish-gray shale containing several thin beds of argillaceous limestone and gypsum (Williams and Lohman, 1949, p. 40). Some beds of maroon and green shale occur near the top of the formation. Salt is not exposed in this area, but it is known to underlie the western part. The Wellington formation yields small quantities of water to wells in the area southeast of Lindsborg, near Newton, and east and northeast of Wichita. No large supplies of water are available from the Wellington formation, owing to the physical character of the rocks comprising it.
In the northwestern part of the Equus beds area the Wellington formation is overlain by the Ninnescah shale. The Ninnescah shale is a soft to hard brick-red shale (Williams and Lohman, 1949, p. 43). It has a maximum thickness of about 275 feet and contains some thin beds of gray and green shale, thin argillaceous limestone, and gypsum. The Ninnescah shale yields meager supplies of strongly mineralized water to farm wells.
In the northeastern part of the Equus beds area the Wellington formation and Ninnescah shale are overlain by Kiowa shale. The Kiowa shale has a maximum thickness of about 120 feet and consists of dark-gray to black gypsiferous shale, gray to buff sandy shale, soft crossbedded sandstone, and thin fossiliferous limestones. The Kiowa shale yields small supplies of hard water to domestic and stock wells and to small springs.
During early Pleistocene time, a stream flowing from a point near Lindsborg southward past McPherson and Wichita incised a wide, deep valley in the Cretaceous and Permian rocks and in the Pliocene Ogallala formation (Frye and Leonard, 1952, p. 94). This valley was referred to as the McPherson Valley by Williams and Lohman (1949, p. 59). The McPherson Valley was joined at a point southwest of the Wichita well field by a large tributary valley, which paralleled the present Arkansas River. The McPherson Valley was filled during Pleistocene time with gravel, sand, silt, clay, and some volcanic ash. These deposits are a part of the Pleistocene Blanco, Meade, and Sanborn formations (Fig. 5).
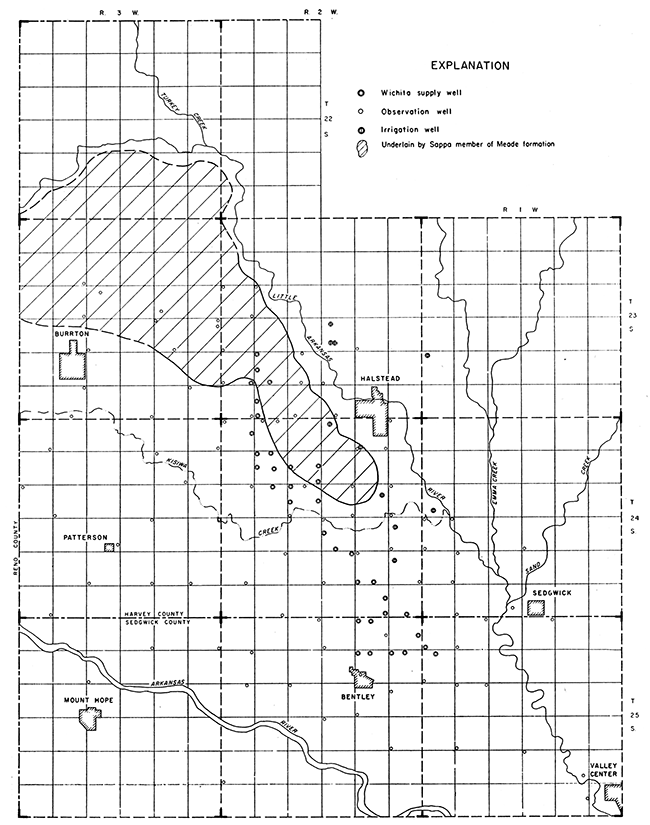
The Ogallala formation (called the Delmore formation by Williams and Lohman, 1949, p. 40, pl. 1) crops out in a small area in the northeastern part of the Equus beds area. The material comprising the Ogallala formation is fine grained and poorly sorted compared with other unconsolidated deposits in this area, and only comparatively small quantities of moderately hard water are available from the formation.Although not shown in Figure 5, some of the coarse gravel and sand overlying the Permian Wellington formation in the deeper channels probably represents the Blanco formation. The Blanco formation, if present, is overlain by the Meade formation (Frye and Leonard, 1952, p. 99), which consists of two members-the Grand Island member, which overlies the Blanco formation, and the Sappa member, which overlies the Grand Island member in part of the area. The Grand Island member is composed of gravel, sand, silt, and clay and yields most of the ground water obtained from the Equus beds area. The Sappa member is composed chiefly of silt and clay, and in the northern part of the well field the Sappa member confines the ground water in the underlying Grand Island member. The approximate boundary of the Sappa member in the well field is shown in Figure 6. The Sappa member yields no water to wells.
Figure 5--Cross section K-K' in north part of well field.
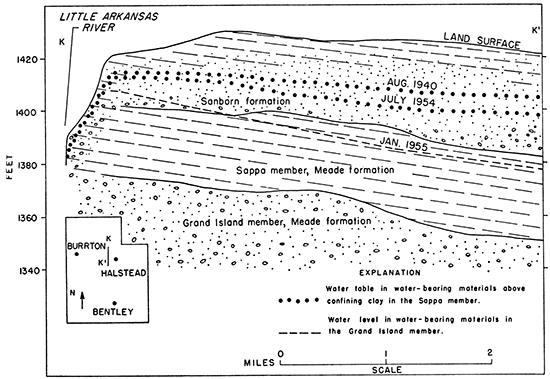
Figure 6--Map of well field showing area underlain by Sappa member of Meade formation.
The Meade formation is overlain in much of the area by the Sanborn formation. The Sanborn formation has the Crete sand and gravel member at the base and Peoria silt member at the top. The Crete sand and gravel member yields moderate supplies of water to wells, and in the northern part of the Wichita well field the water body in the Sanborn formation is semiperched above the Sappa member of the Meade formation.
Recent alluvium and Wisconsinan deposits occur in the Arkansas River valley and in the Little Arkansas River valley. In the Arkansas River valley the deposits are composed of unconsolidated gravel, sand, and silt and have a high permeability. The deposits in the Little Arkansas River valley are composed of silt, clay, sand, and gravel. In general, these deposits are thin and have a low to medium permeability.
Sand dunes, probably Wisconsinan and Recent in age, extend over a wide belt northwestward from Little Arkansas River northeast of Burrton. These sand dunes are in the northwest part of the well field and form the only prominent topographic relief in this part of the Equus beds area (Williams and Lohman, 1949, p. 70). The sand dunes have a high permeability, and they absorb large amounts of precipitation. No large supplies of ground water have been developed in the area underlain by sand dunes, but they unquestionably help to recharge the deposits below.
Next page--Hydrology, Summary, References
Kansas Geological Survey
Placed on web June 11, 2015; originally published Dec. 1946.
Comments to webadmin@kgs.ku.edu
The URL for this page is http://www.kgs.ku.edu/Publications/Bulletins/64_5/index.html