 |
|
Kansas Geological Survey Open-file Report 2003-82 |
2.3.8 Mineral Interval
Description
The interval from the top of the Scammon shale to the top of the Mineral shale ranges in thickness from 10 to 40 feet with an average of 19 feet (3 to 12.2 m, average of 5.8 m; Figures 2.01 and 2.24). In ascending order, the Mineral interval consists mainly of a dark gray shale facies passing upward into a laminated muddy sandstone facies. A blocky mudstone facies, and the regional extensive Mineral coal overlies the sideritic shale facies. The regionally extensive Mineral coal is overlain by a phosphatic black shale facies (Figure 2.24). The blocky mudstone facies underlying the coal facies varies in thickness from 2 to 8 feet (0.6 to 2.4 m).
V-Shale and Mineral Interval |
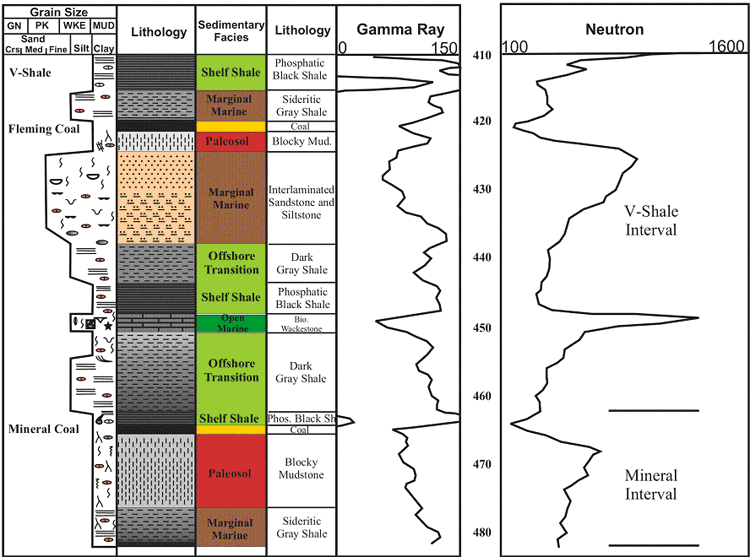 |
| Figure 2.24 - Depositional sequence and log characteristics of theV-Shale and Mineral interval, based on core and well log from the Cooper CW#1 well 11-T35S-R18E, Labette County, Kansas (scale in feet). See Figure 2.15a for legend. |
Mineral Coal Isopach Map
The Mineral coal is recognizable on most logs by the radioactive black shale
marker (Mineral shale marker) present above the Mineral coal, which is due
to a high gamma ray response (> 140 API units) and a lower neutron response
(< 475 neutron counts). This black shale marker is followed down hole by
a lower gamma ray response (< 100 API units) associated with the underlying
coal (Figure 2.24). The Mineral coal marker extends throughout the Cherokee
basin. Thickness of the Mineral coal ranges up to 4 feet with an average of
1.4 feet, and is normal in distribution (1 m, average of 0.4 m; Figure 2.25;
Appendix 2).
Detailed isopach mapping of the Mineral coal reveals a coal that stays fairly
constant in thickness over an average distance of 6 square miles (9.6 km2;
Figure 2.25). The Mineral coal is the next laterally extensive and thick coal
above the Weir-Pittsburg coal. Paleotopography reflected in structure appears
to influence coal thickness. When structural contours of bottom of the Mineral
coal are overlain onto an isopach of Mineral coal thickness, the coal appears
to thicken on highs and thin into lows (Figure 2.25). The Mineral coal exhibits
a lenticular geometry that is oriented parallel to depositional strike (northwest),
and is consistently thicker in Labette, Neosho, Montgomery, Wilson, and Cherokee
counties. Localized thin areas in the Mineral coal are usually circular in
map view, and may be due to removal by erosion (see Chapter 5).
Mineral Coal |
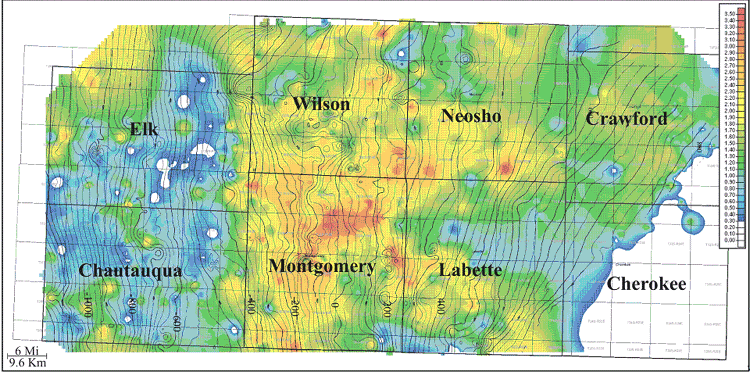 |
| Figure 2.25 - Isopach of Mineral Coal (color) overlain with contours of bottom Mineral Coal structure (isopach CI:0.10ft; structure CI:25ft). |
2.3.9 V-Shale Interval
Description
The interval from the top of the Mineral shale to the top of the V-Shale ranges in thickness from 20 to 70 feet with an average of 40 feet (6.1 to 21.9 m, average of 12.2 m; Figures 2.02 and 2.24). The V-Shale interval consists, in ascending order, of a dark gray shale facies that is locally overlain by approximately 10 feet (3 m) of an interlaminated sandstone and siltstone facies. The upper part of the V-Shale interval consists of thin bedded (3-10 cm), massive, clean sand, which is capped by a blocky mudstone facies and a thin (less than 3 ft; 0.9 m) discontinuous coal facies known as the Fleming coal. Overlying the Fleming coal is another dark gray shale facies or sideritic shale facies. Locally, an additional blocky mudstone facies and coal facies known as the Croweburg coal occurs on top of the sideritic shale facies. The top of the V-Shale interval is defined by a regionally extensive phosphatic black shale facies known as the V-Shale (Figure 2.24). The erosional basal contact of the interlaminated sandstone and siltstone facies below the Fleming coal is interpreted as an unconformity.
Fleming Coal Isopach Map
The V-Shale is the most recognizable radioactive black shale within the Cherokee
Group, and is correlatable throughout southeastern Kansas and into adjacent
states. The V-Shale is identifiable on logs due to a high gamma ray response
(> 225 API units) moderate neutron response (~ 800 neutron counts; Figure
2.24). The high gamma ray response and stratigraphic position of the V-Shale
is underlain by a much lower gamma ray response (< 150 API units) and lower
neutron response (< 100 neutron counts) due to the underlying Croweburg
coal. Approximately 10 feet (3 m) below the V-shale lies another thin radioactive
shale (> 150 API units) that although not as laterally continuous is a
useful marker for identifying the underlying Fleming coal.
Detailed isopach mapping of the Fleming coal reveals a coal that is laterally discontinuous but has a consistency in thickness over an average of 4 square miles (6.4 km2; Figure 2.26). Thickness of the Fleming coal can be up to 2.6 feet with an average of 1 foot and a distribution skewed to the minimum (0.8 m, average of 0.3 m; Appendix 2). The Fleming coal exhibits a dendritic geometry that is oriented parallel to depositional dip (southwest). In contrast with some of the other Cherokee Group coal deposits in the study area, structure does not appear to have as much control on coal thickness. The Fleming coal is consistently thicker in the southern half of the study area. Thin or zero coal trends of the Fleming coal appear to be the result of non-deposition.
Fleming Coal |
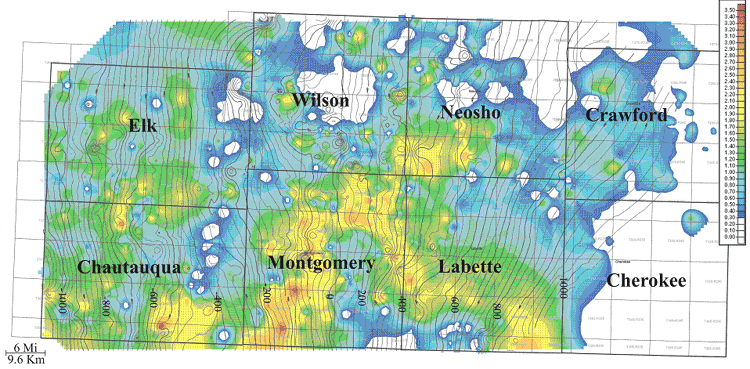 |
| Figure 2.26 - Isopach of Fleming Coal (color) overlain with contours of bottom Fleming Coal structure (isopach CI:0.10ft; structure CI:25ft). |
Croweburg Coal Isopach Map
Detailed isopach mapping of the Croweburg coal reveals a laterally continuous
coal that has a consistency in thickness over an average of 6 square miles
(9.6 km2; Figure 2.27). Thickness of the Croweburg coal can be up to 3 feet
with an average of 1 foot and has a normal distribution (0.9 m, average of
0.3 m; Appendix 2). The Croweburg coal exhibits a lenticular geometry that
is oriented parallel to both depositional dip (northwest) and strike (southeast).
When overlaying structural contours of bottom of the Croweburg coal onto an
isopach of Croweburg coal thickness, the coal appears to thicken on structural
highs and thin into lows. The Croweburg coal is consistently thicker in Wilson,
Montgomery, Neosho, and Labette counties. Localized thin areas and trends
within the thicker Croweburg coal may be due to removal by erosion.
Croweburg Coal |
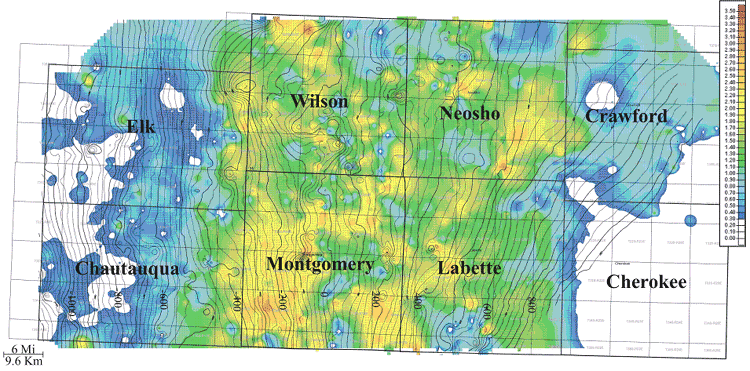 |
| Figure 2.27 - Isopach of Croweburg Coal (color) overlain with contours of bottom Croweburg Coal structure (isopach CI:0.10ft; structure CI:25ft). |
e-mail : webadmin@kgs.ku.edu
Last updated December 2003
http://www.kgs.ku.edu/PRS/publication/2003/ofr2003-82/chapter238-9.html