Evaluation of Horizontal Drilling
Modified from: in press, P.M. Gerlach,
S. Bhattacharya, T.R. Carr, Cost Effective Techniques for the
Independent Producer to Evaluate Horizontal Drilling Candidates
in Mature Areas: AAPG Hedberg Conference, International Horizontal
Well Symposium: Focus on the Reservoir, http://www.kgs.ku.edu/PRS/AAPG/papers/gerlach.html.
Horizontal wells are a cost efficient tool for reservoir management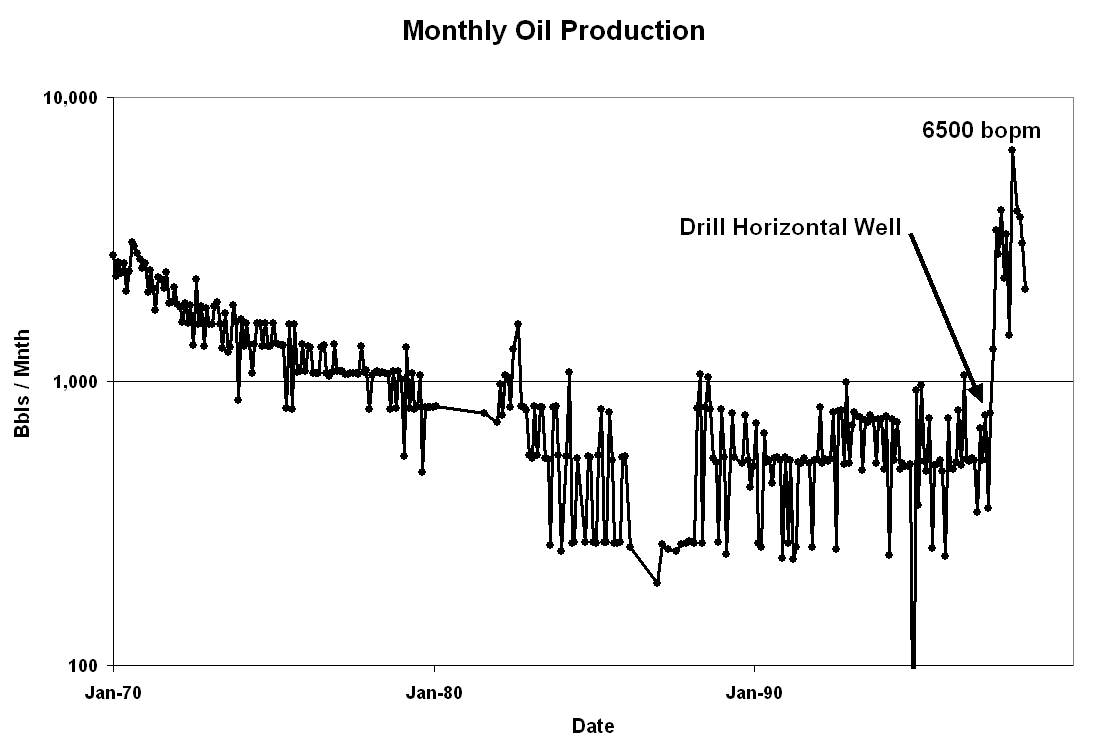 that has not been widely adopted by small
independent operators of mature oil fields. Horizontal drilling
has been extensively applied as an exploitation and exploration
tool in relatively under-exploited reservoirs such as the Austin
Chalk and in structurally complex reservoirs. In recent years
horizontal technology has been extended to incremental oil recovery
in the mature oil fields of southeast Saskatchewan. Though the
technological needs in many mature onshore reservoirs are unique,
the overall reservoir management objectives and requirements for
commercial success are similar to those elsewhere. Application
of horizontal drilling in Kansas has been limited to 28 wells.
In Kansas results have been mixed with a few significant successes
(Figure 2.11). Operator concerns
for appropriate economic return, and difficulty in identifying
candidate reservoirs have been the principal factors restricting
application of horizontal drilling technology. Recent declines
in cost factors have brought horizontal drilling technology within
the economic reach of small independent producers. The remaining
barrier to wider application of horizontal technology by the small
independent is cost-effective approaches to target a horizontal
well. We present several low-cost approaches that can be used
to evaluate a potential horizontal well. These cost-effective
screening techniques apply at the field scale, the lease level,
and the well level. The techniques discussed enable the small
independent producer to quickly and efficiently evaluate reservoir
candidates, and predict performance of horizontal well application.
that has not been widely adopted by small
independent operators of mature oil fields. Horizontal drilling
has been extensively applied as an exploitation and exploration
tool in relatively under-exploited reservoirs such as the Austin
Chalk and in structurally complex reservoirs. In recent years
horizontal technology has been extended to incremental oil recovery
in the mature oil fields of southeast Saskatchewan. Though the
technological needs in many mature onshore reservoirs are unique,
the overall reservoir management objectives and requirements for
commercial success are similar to those elsewhere. Application
of horizontal drilling in Kansas has been limited to 28 wells.
In Kansas results have been mixed with a few significant successes
(Figure 2.11). Operator concerns
for appropriate economic return, and difficulty in identifying
candidate reservoirs have been the principal factors restricting
application of horizontal drilling technology. Recent declines
in cost factors have brought horizontal drilling technology within
the economic reach of small independent producers. The remaining
barrier to wider application of horizontal technology by the small
independent is cost-effective approaches to target a horizontal
well. We present several low-cost approaches that can be used
to evaluate a potential horizontal well. These cost-effective
screening techniques apply at the field scale, the lease level,
and the well level. The techniques discussed enable the small
independent producer to quickly and efficiently evaluate reservoir
candidates, and predict performance of horizontal well application.
Kansas is a mature petroleum producing province with many marginal
oil and gas fields operated by over 3,000 independent oil producers.
As a result of operational and depositional-diagenetic heterogeneities
most of these fields have recovery efficiencies of less than 30%
original oil in place (OOIP). This low recovery efficiency results
in significant remaining oil in place (ROIP). Operators can use
horizontal technology to add new reserves by exploiting the ROIP
in their existing fields, and to more efficiently recover known
oil and gas reserves.
Operational heterogeneities are inherent in field development
practices and results in significant ROIP. Examples of operational
heterogeneities include inadequate drainage due to excessive well
spacing, openhole/partial completions, bypassed attic oil, thin
pays, and water coning. Depositional-diagenetic reservoir heterogeneities
due to vertical and lateral variability of petrophysical properties
create compartments in the reservoir. These types of heterogeneities
are a function of original depositional architecture and the subsequent
diagenetic overprint. Examples include highly variable pore geometry
of carbonate rocks, anisotropic permeability in fractured reservoirs,
and stratified flow units.
Cost-effective screening tools. The primary screening
tool for identifying candidate reservoirs is "quick-look
volumetric" calculations. This method uses only one well
per unit area (e.g., quarter section) to identify pay height,
porosity, and saturation to compute OOIP. These reservoir properties
can be estimated from public domain data and computed using simple
log analysis programs. PfEFFER, a low cost integrated log analysis
tool developed by the Kansas Geological Survey, is used to identify
well flow units, associated petrophysical and reservoir properties,
and potential for production. Cumulative production per quarter
section is then divided by OOIP to calculate recovery efficiency.
The mapping of recovery efficiency across the field identifies
target areas for further study. Regions with low recovery efficiency
are those most likely to yield additional or incremental hydrocarbon
reserves.
Detailed volumetric calculations at the lease level can be
used to further evaluate potential target areas. Information from
all wells on a lease is used to calculate and compare recovery
efficiency between adjacent leases and adjacent wells. Mapping
well production, normalized by petrophysical parameters, can approximate
sweep efficiency between wells. Well production is normalized
by dividing cumulative production by the product of payheight,
hydrocarbon saturation, porosity, and horizontal permeability.
NMR measurements on selected core plugs in reservoirs with significant
micro-porosity are used as a cost-effective approach to separate
total porosity from effective porosity. Permeability data can
be estimated from well tests or by using porosity-permeability
crossplots developed from core plug studies. Areas with low normalized
production values suggest high reservoir heterogeneity and less
effective sweep.
Following volumetric screening, the next step in the candidate
selection process is identifying of the cause of poor recovery
efficiency. The causes can be many-fold, but in Kansas the most
prevalent are stratified thin pays, attic oil, excessive well
spacing, coning due to strong water drive, and fractured reservoirs.
ROIP in stratified thin pays can be identified by comparing initial
rates of production and cumulative production between wells with
similar payzone properties but different completion procedures.
Attic oil is a common result of well spacing or lease boundaries
coinciding with the structural axis of a payzone. First derivative
maps show the change in the structural dip and can be used to
identify the attics of a structure with undrained reserves. A
simple method to determine excessive well spacing is to compare
estimated ultimate production between primary vertical wells and
infill vertical wells in an analog field. Analysis of lease total
fluid production through time is a quick and cost effective method
to suggest water break-through as a result of coning.
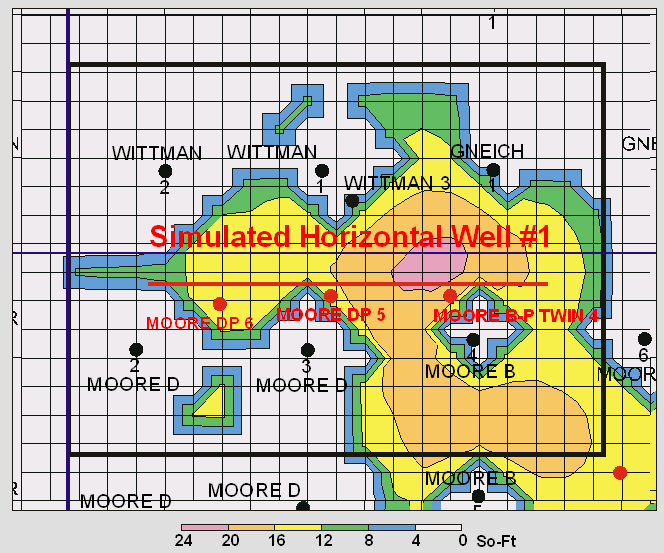 The final step in the candidate
selection process is reservoir simulation to accurately identify
ROIP on a grid cell by grid cell basis. Boast4, a freeware black
oil simulator, was used to history match the performance of the
Schaben Field, (Ness County, Kansas). Remaining hydrocarbon saturation-feet
map (Figure 2.12) from this simulation
was used to select areas with greatest potential for infill drilling.
Boast VHS (vertical-horizontal-slant) simulation was used to predict
and compare the performance of infill vertical and horizontal
wells.
The final step in the candidate
selection process is reservoir simulation to accurately identify
ROIP on a grid cell by grid cell basis. Boast4, a freeware black
oil simulator, was used to history match the performance of the
Schaben Field, (Ness County, Kansas). Remaining hydrocarbon saturation-feet
map (Figure 2.12) from this simulation
was used to select areas with greatest potential for infill drilling.
Boast VHS (vertical-horizontal-slant) simulation was used to predict
and compare the performance of infill vertical and horizontal
wells.
The Kansas Geological Survey has been working to develop and
transfer cost-effective technologies to evaluate a potential horizontal
target. We believe that small independents can successfully apply
horizontal drilling technology to recover additional oil and gas
in mature areas. Our approach recommends low-cost techniques to
understand reservoir heterogeneity, to evaluate recovery potential
at the field, lease and well scales, and to characterize and simulate
candidate reservoirs.
Synopsis of PfEFFER
The petrophysical analysis and reservoir evaluation computer
package (PfEFFER) was enhanced in conjunction with the Class 2
project. PfEFFER version 2.0 and PfEFFER Pro were released in
February 1998. Prototype software was tested and successfully
applied in Schaben Field. PfEFFER stands for "Petrofacies
Evaluation of Formations For Engineering
Reservoirs" (Doveton and others, 1995).
The minimum log data required by the spreadsheet-based software
are a porosity and resistivity log. Old logs are well suited to
this analysis once they are digitized or simply typed into the
spreadsheet. Toolbars and menus perform most operations through
the utilization of nearly 8,000 lines of Visual Basic code. PfEFFER
v. 1 reads standard LAS log data files such as those obtained
from a logging truck or permits manual entry, organizes digital
data by well and zone, and creates a "Super Pickett"
crossplot, depth plots, and lithology solutions (if sufficient
logs are available (Figure 2.13).
The software is focused on interpreting and analyzing reservoir
pore type, permeability trends, and variations in mineral composition.
PfEFFER provides procedures for optimal estimation of bulk volume
water and water saturation (including irreducible values) to better
evaluate potential production, reservoir quality, and heterogeneity.
Also capillary pressure data can be incorporated to further calibrate
well log data with pore size or to assess depth to the free water
level. The program will assemble zonal information from well workbooks
into a project workbook and can automatically generate map and
3-D visualizations of key parameters as defined by the user. "Hot
links" are maintained in the project workbook to each well
workbook to aid in data management (Figure
2.14).
All of the standard EXCEL features continue to be available
to users for independent analysis and data exploration. The simplicity
of hardware and software requirements means that PfEFFER is an
attractive option for companies of all sizes. The range and versatility
of module capabilities makes them powerful tools for the analysis
of both old log suites and the latest generation of logging measurements.
In addition to revising the appearance of the spreadsheet and
refining the modules as described above, PfEFFER v. 2.0 contains
new modules. The new features in PfEFFER v. 2.0 are:
- Vshale (shale proportion) can be calculated, based on either
the gamma ray or the neutron and density porosity logs.
- Porosity can be calculated using density, neutron, density/neutron,
or sonic with and without correction for shale volume.
- Shaly sand models are available for Sw calculation. Sw model
menu permit selection of Archie water saturation model (the default)
and two shaly sand models, the Simandoux model and the dual-water
model.
- Hough Transform is included. The Hough transform is used
for simultaneous solution of Archie equation constants and formation
water resistivity.
- Secondary porosity is calculated as the difference between
the total porosity (from density or neutron porosity) minus sonic
porosity.
- Moveable hydrocarbons can be determined (Figure
2.15). Based on the assumption that the zone near the well
is permeated with mud filtrate, the Archie equation is used to
compute Sxo, the filtrate saturation of this flushed zone. Sxo
is used to compute moveable and residual hydrocarbon saturations.
PfEFFER generates a moveable oil plot consisting of bulk volume
water, bulk volume fluid, and porosity. Difference between BVF
and BVW represents the moveable hydrocarbon saturation.
- Lithological analysis now includes two options in PfEFFER
v. 2.0, one based on the RHOMAA-UMAA plot and the other allowing
a more general selection of logs and system components. The general
option allows user to compute up to six components based on up
to five logs. Any log can be employed and the component selection
is at the discretion of the user.
- Depth-constrained multivariate cluster analysis can be employed
to segment the entire spreadsheet into subintervals based on
user-specified set of logs. A hierarchical cluster (Ward's method)
is used to produce subintervals that are as homogeneous as possible
and distinct as possible from each other, in terms of their log
characteristics. Option is useful in evaluating flow units and
can be used as a blocking function.
- Forward modeling module implements equations to predict values
of rx, capillary pressure, and hydrocarbon column height for
a range of water saturation values based on specific values of
permeability and porosity.
- Pay flag cuttoff can be activated to add color to cells of
selected variables used to determine pay (porosity, BVW, Sw,
and Vsh) and to color cells in the pay column according to pay
and non-pay intervals.
Three additional modules (add-ins) are available as PfEFFER
Pro. These modules include color cross section generation, map
coordinate conversion (longitude-latitude to UTM x-y), and software
to help build an input file for a reservoir simulator based on
the petrophysical characterization. DOE's freeware reservoir simulation
software, BOAST 3, was used in the development and testing.
This page maintained by the
Kansas Geological Survey.
Updated June 1999
Comments to webadmin@kgs.ku.edu
URL=http://www.kgs.ku.edu/PRS/publication/99_22/horzdrill.html