Kansas Geological Survey
Open-file Report 2001-38

|
|
Kansas Geological Survey Open-file Report 2001-38 |

|
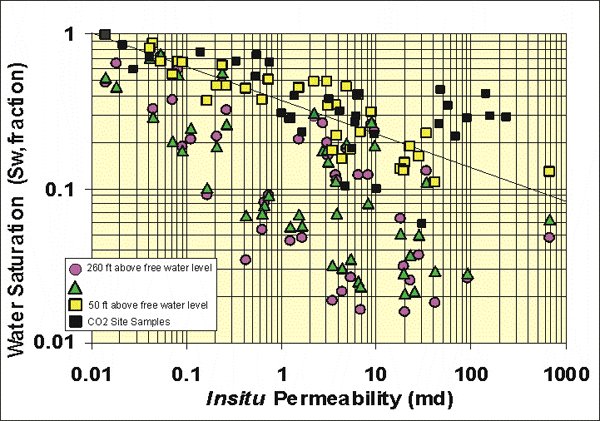
“Irreducible” Water SaturationWith finer pores in the matrix surrounding large oomolds it is important to understand capillary pressure relationships since high porosity may not be directly associated with effective oil porosity. Correlations of “Irreducible” water saturations (measured at pressures equivalent to 60-120 feet above free water level) indicate that Swi increases with decreasing permeability as exhibited by many rocks. Differences between fields are largely attributable to the samples/wells analyzed and may not reflect true field differences. Saturation increases with decreasing permeability following the relation:
|
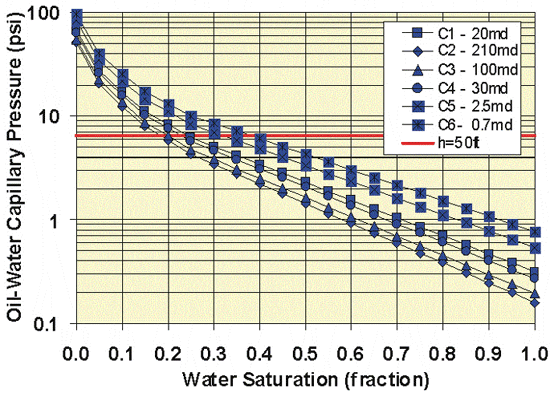
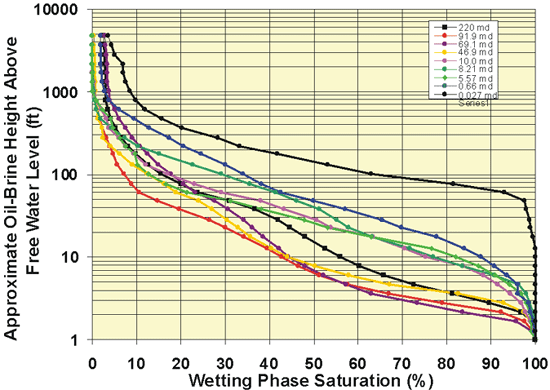
Capillary Pressure CurvesLansing-Kansas City oomoldic limestone exhibit a near log-linear trend between wetting phase saturation (assumed to be water in the reservoir) and oil-brine height above free water level. This would also translate to a log-linear relationship between wetting-phase saturation and reservoir oil-brine capillary pressure. Comparison between samples of different permeability indicates that capillary pressures decrease with increasing permeability at any given saturation. This is a typical trend for most rocks. Analyzing the relationship between the change in capillary pressure and permeability, an equation was constructed that provides approximate capillary pressure curves for any given permeability: Pc = 10(A Sw + B) (rhowater-rhooil) Where Pc is reservoir oil-brine capillary pressure (psia), Sw is water saturation (fraction),rhowater and rhooil are water and oil density (g/cc), and A and B are constants that vary with permeability. These constants can be predicted from permeability using: A = -0.1663 log10Permeability (md)-1.5186 These equations provide generalized capillary pressure curves that approximate the relationships shown by the samples studied. |
  |
|
|
e-mail : webadmin@kgs.ku.edu
Last updated December 2001
http://www.kgs.ku.edu/PRS/publication/OFR2001-38/P3-04.html