Kansas Geological Survey
Open-file Report 2001-38

|
|
Kansas Geological Survey Open-file Report 2001-38 |

|
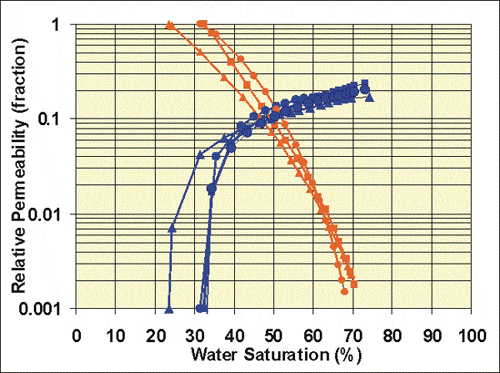
Relative PermeabilityImbibition relative permeability curves for oomoldic limestone samples exhibit uniformity for three similar oomoldic limestones exhibiting porosities from 24.0-25.3%, and permeability from 19.8 to 27.5 md. |

|
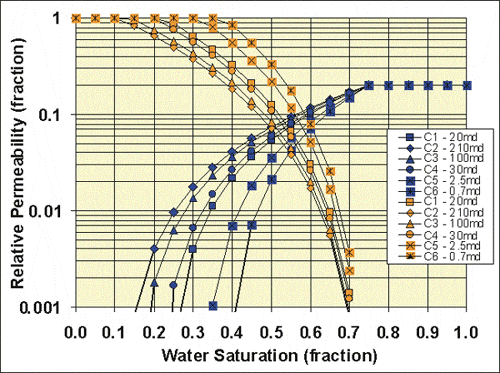
Modeled Relative PermeabilitySince relative permeability end point saturations change with permeability (e.g., “irreducible” water saturation changes with permeability), the relative permeability curves also change with absolute permeability. Relative permeability curves for each layer were predicted using the Corey-type equations below where Swi was obtained from Pc-k relations and the average absolute permeability values for each layer. Exponent m and n values were initially obtained from the measured data above and were modified during simulation to reproduce lease production data.
In reservoir simulation either unique kr curves must be defined for each unique water saturation region or pseudo-kr curves and corresponding pseudo-Sw values used. Since kr was defined by layer, it represents a pseudo-relative permeability. Initial pseudo-Swi values were assigned to each layer using Pc-k relations discussed. |
|
|
e-mail : webadmin@kgs.ku.edu
Last updated December 2001
http://www.kgs.ku.edu/PRS/publication/OFR2001-38/P3-05.html