Lithofacies Model
-
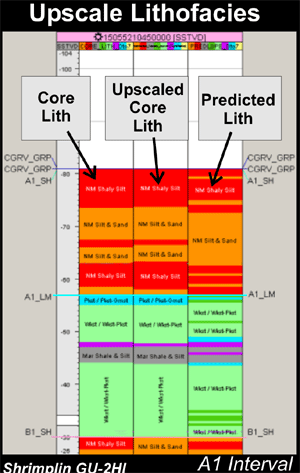
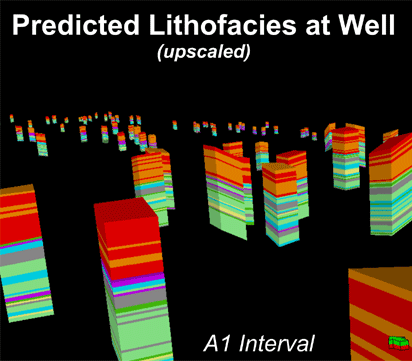
"Upscale" the "lith-code" curves for each of wells having logs used in facies predictions.
-
Populate cells at the wells with upscaled lithofacies.
-
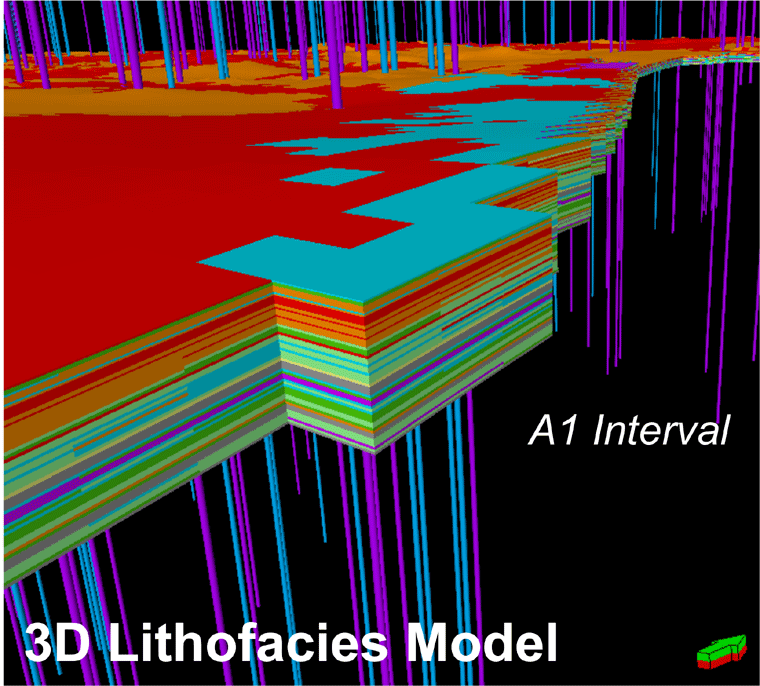
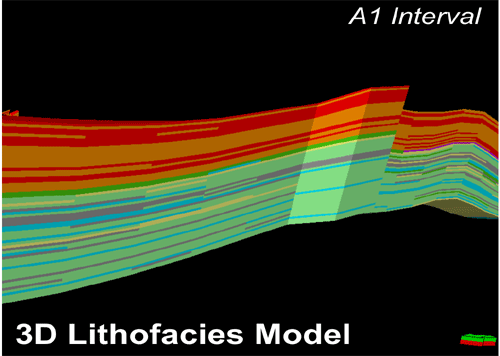
Model cells between wells for lithofacies (Sequential Gaussian). A constant average curve was fitted creating a constant distribution (from "lith-code" curves) equal to the average probability of that facies.
 |
 |
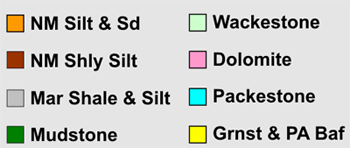 |
QC facies modeling by comparing values that are assigned for the cells at the well to what is being modeled beyond the well bore. |
Biasing Lithofacies Geometry
Model facies using different biasing parameters based on geologic understanding of field. Examples include “non-biased” using a spherical range of 100,000' x 100,000', slightly biased (2:1 ratio to NE-SW), heavily biased to NE-SW, and bias based on mapped regional facies distribution patterns.

|
|
e-mail : webadmin@kgs.ku.edu
Last updated May 2003
http://www.kgs.ku.edu/PRS/publication/2003/ofr2003-30/P3-03.html
