Petrophysical Model
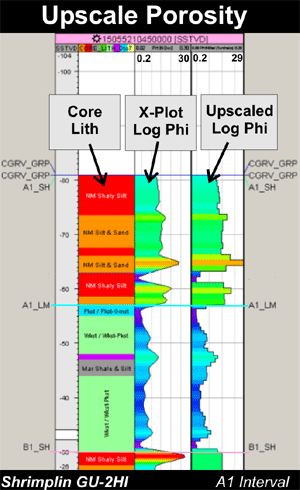 |
Raw log data was quality checked and aliased*. During the processing a cross-plot porosity curve was generated using the Neutron and Density Porosity curves. No shale correction was made in the first models. Similar to facies modeling, porosity curves were "upscaled" at the wells for modeling porosity in cells between the wells (Sequential Gaussian). |
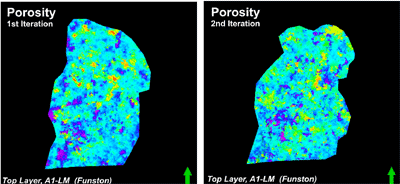 |
Map view of porosity models for the top layer of the A1-LM. First iteration at modeling porosity used maximum 30% porosity cut-off for all lithofacies. Second iteration at modeling porosity used facies specific porosity cut-offs inside new modeling boundary that eliminated a few outlier wells. |
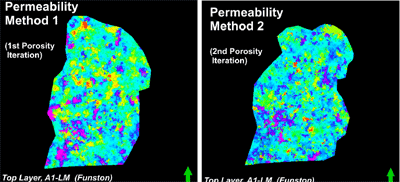 |
Map view of permeability models for the top layer of the A1-LM. Permeability Model 1 used facies probabilities predicted by neural net in field-wide extrapolation using Sequential Gaussian Simulation. Permeability Model 2 used values of the facies and porosity defined in a particular cell and facies dependent porosity-permeability transforms. |
 |
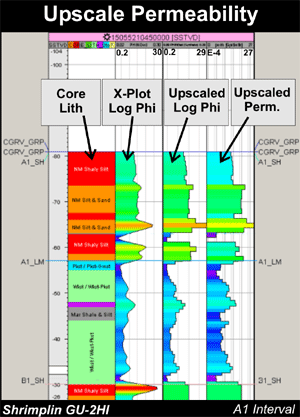 |
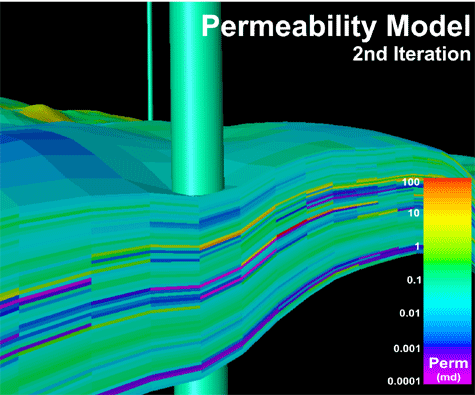
Upscaled absolute permeability curves were calculated using
porosity-permeability transorm equations developed by Byrnes. 
|
|
e-mail : webadmin@kgs.ku.edu
Last updated May 2003
http://www.kgs.ku.edu/PRS/publication/2003/ofr2003-30/P3-04.html
