Example--"D" Sand, Sooner Unit, Colorado
Objectives
Determine "D" sand thickness between well control points.Identify faults/discontinuities which could be barriers to fluid flow in the reservoir.
Figure 7. "D" Sand Thickness from Wells. A large version of this figure is available.
Sooner 3-D seismic survey
Black horizons delineate seismic reflections corresponding to the top and bottom of the "D" sand. Over most of the 3-D survey area, the "D" sand is below seismic resolution (a "thin bed"). Below seismic resolution, reflections from the top and bottom of the sand maintain a constant temporal separation, which is unrelated to the true sand thickness. Envelope, frequency, and spectral decomposition attributes, which have been used elsewhere to estimate bed thickness, will be examined as potential predictors of "D" sand thicknessFigure 8. Vertical Seismic Section.
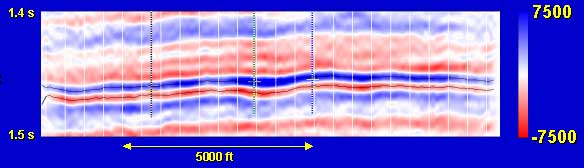
Figure 9. Cross-sectional view and 3-D visualization.
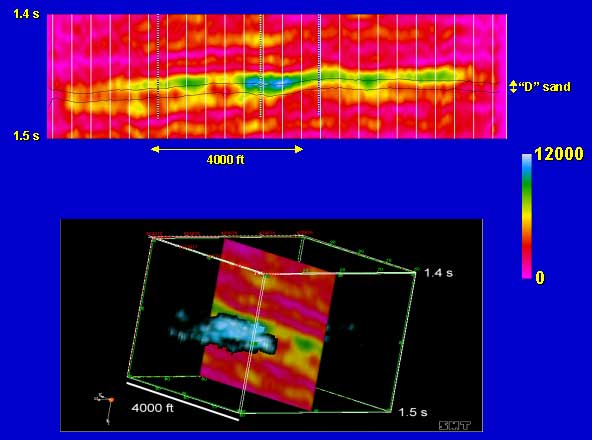
Figure 10. Envelope Attribute extracted along top "D" sand horizon. Black contours of "D" sand thickness based on well data. A large version of this figure is available.
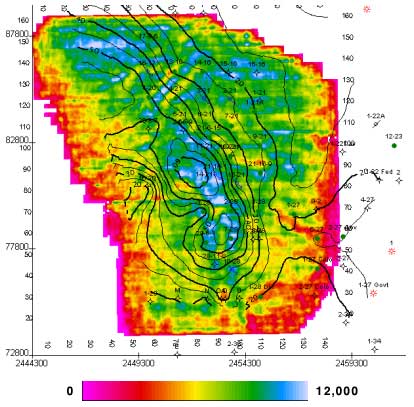
Figure 11. Instantaneous frequency extracted along top "D" sand horizon. Black contours of "D" sand thickness based on well data. A large version of this figure is available.
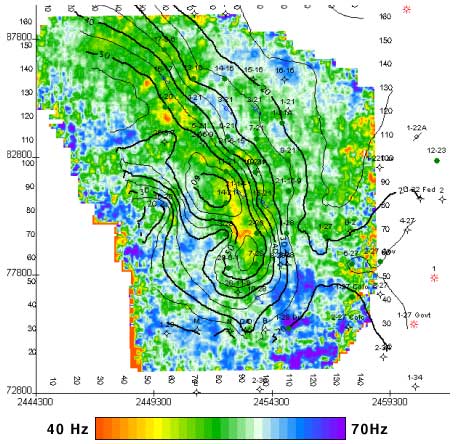
Figure 12. Spectral Decomposition--50 ms window centered on "D" sand. Black contours of "D" sand thickness based on well data. A large version of this figure is available.
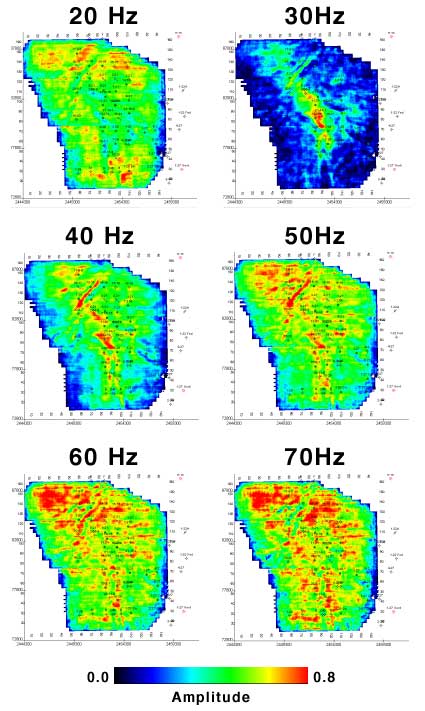
Figure 13. Spectral Decomposition--29 Hz--50 ms window centered on "D" sand. Black contours of "D" sand thickness based on well data. A large version of this figure is available.
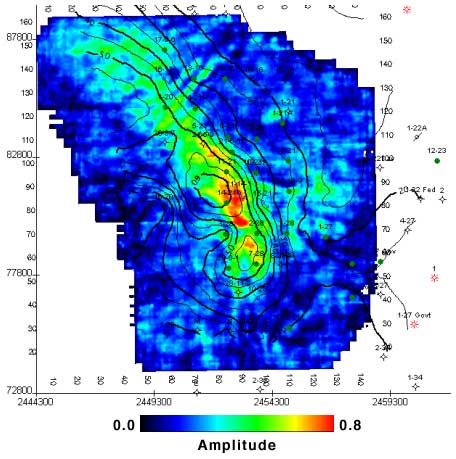
Figure 14. Crossplots of attribute versus "D" sand thickness.
Figure 15. Instantaneous phase. A large version of this figure is available.
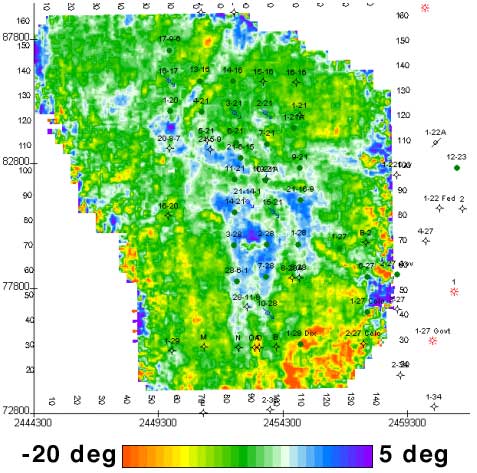
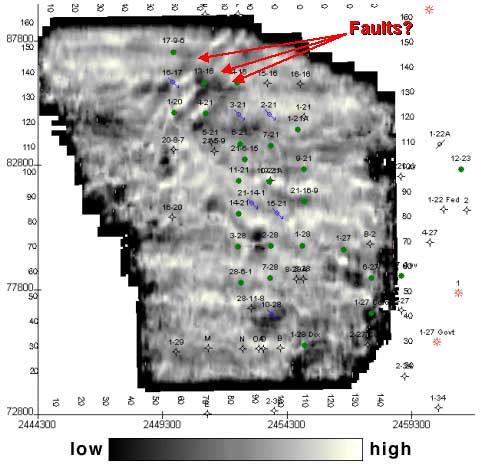
Figure 16. Coherence. A large version of this figure is available.
Sooner 3-D Summary
The 29 Hz Spectral Decomposition slice is the best single attribute for predicting "D" sand thickness.A set of linear discontinuities in the northern part of the Sooner 3-D survey is best imaged on the Coherence map. These discontinuities may be faults, and are potential reservoir flow boundaries.
Conclusions
Attributes reveal information which is not readily apparent in the raw seismic dataDozens of seismic attributes can be calculated using a variety of software packages
Attributes may be interpreted singly or using multi-attribute analysis tools
Different attributes reflect different physical properties of the underlying rock system
Acknowledgments
Access to The KINGDOM Suite software and the Sooner 3-D seismic data set was provided by Seismic Micro-Technology, Inc.Suggested Readings
Bahorich, M. S., and S. L. Farmer, 1995, 3-D seismic coherency for faults and stratigraphic features: The Leading Edge, v. 14, p. 1053-1058.Bodine, J. H., 1986, Waveform analysis with seismic attributes, Oil & Gas Journal, v. 84, June 9, p. 59-63.
Gersztenkorn, A., and K. J. Marfurt, 1999, Eigenstructure based coherence computations as an aid to 3-D structural and stratigraphic mapping: Geophysics, v. 64, p. 1468-1479.
Marfurt, K. J., R. L. Kirlin, S. L. Farmer, and M. S. Bahorich, 1998, 3-D seismic attributes using a running window semblance-based algorithm: Geophysics, v. 63, p. 1150-1165.
Marfurt, K. J., and R. L. Kirlin, 2001, Narrow-band spectral analysis and thin-bed tuning: Geophysics, v. 66, p. 1274-1283.
Nissen, S. E., 2000, Interpretive aspects of seismic coherence and related multi-trace attributes, Kansas Geological Survey Open File Report 2000-84: Available Online
Partyka, G., 2001, Seismic thickness estimation: three approaches, pros and cons, 71st Ann. Internat. Mtg: Soc. of Expl. Geophys., p. 503-506.
Partyka, G., J. Gridley, and J. Lopez, 1999, Interpretational applications of spectral decomposition in reservoir characterization: The Leading Edge, v. 18, p. 353-360.
Sippel, M. A., R. W. Pritchett, and B. A. Hardage, 1996, Integrated reservoir management to maximize oil recovery from a fluvial-estuarine reservoir: A case study of the Sooner Unit, Colorado, in Johnson, K. S. (ed.), Deltaic Reservoirs in the Southern Midcontinent, 1993 symposium: Oklahoma Geological Survey Circular 98, p. 288-292.
Taner, M. T., F. Koehler, and R. E. Sheriff, 1979, Complex seismic trace analysis: Geophysics, v. 44, p. 1041-1063.
Taner, M. T., 2000, Attributes revisited: Available Online
Kansas Geological Survey
Send comments and/or suggestions to webadmin@kgs.ku.edu
Updated Nov. 25, 2002
URL = http://www.kgs.ku.edu/PRS/publication/2002/ofr49/page2.html