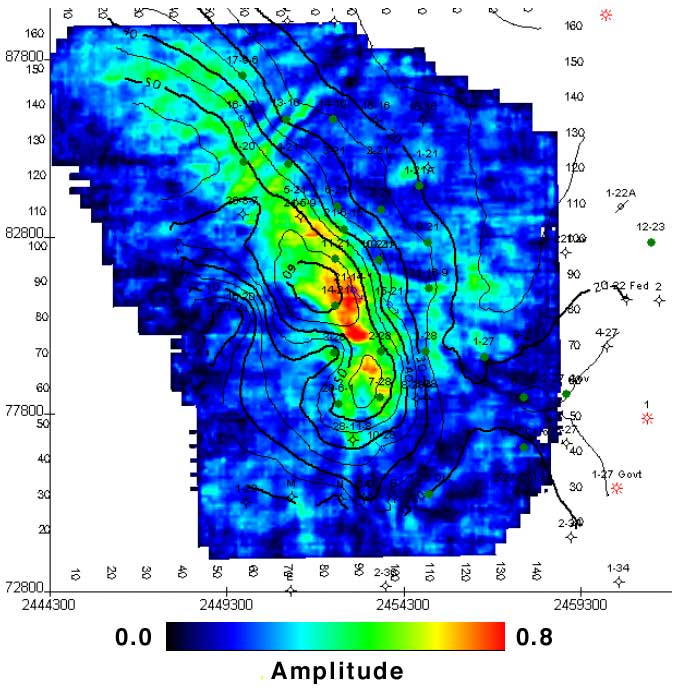
Figure 13. Spectral Decomposition--29 Hz--50 ms window centered on "D" sand. Black contours of "D" sand thickness based on well data.
Kansas Geological Survey
Send comments and/or suggestions to webadmin@kgs.ku.edu
Updated Nov. 21, 2002
URL = http://www.kgs.ku.edu/PRS/publication/2002/ofr49/fig13.html