Introduction
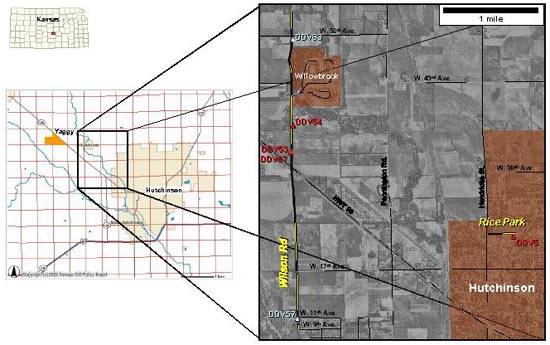
On January 17-18, 2001, a series of natural gas explosions and geysers occurred in the city of Hutchinson, Kansas, killing two people, destroying several buildings, and causing the evacuation of dozens of businesses and several hundred households. A possible source of this gas may have been the Yaggy gas storage field, 7 miles northwest of the city (Figure 1), which experienced a leak two days prior to the explosions at Hutchinson. At Yaggy, natural gas is stored at depths greater than 500 ft in caverns in the Hutchinson Salt Member of the Permian Wellington Formation. A casing failure was discovered in the well accessing one of these caverns, and this failure could have allowed high-pressure gas to leak from the cavern. After an initial high-pressure gas release around the storage site, the gas may have traveled updip toward Hutchinson along previously unknown conduits.
A series of wells, based on 160-acre spacing, were drilled in and around Hutchinson to find and vent remaining underground gas to the surface. Of the first 36 vent wells drilled, only 8 found gas. It became apparent that additional information would be needed in order to more efficiently identify locations of gas.
In February 2001, the Kansas Geological Survey conducted a high-resolution seismic-reflection survey in order to detect seismic anomalies, which might indicate the presence of gas and identify potential gas pathways from Yaggy to Hutchinson. Previous high-resolution seismic surveys by the Kansas Geological Survey have successfully identified amplitude anomalies associated with gas-bearing sandstones (e.g., Miller et al., 2000).
Acquisition and Processing of Seismic Data
A 0.3-mile-long, east-west seismic line was located in Rice Park, on the west side of Hutchinson, and a 3.4-mile-long, north-south seismic line was located on Wilson Road, between Hutchinson and Yaggy (Figure 1). The Rice Park line was located near one of the early vent wells that had found gas (DDV5).
Figure 1. Location map of seismic lines (yellow) and selected vent wells in and near Hutchinson, KS. Gas wells are shown in red. Dry holes are shown in pale blue.
High-resolution reflection data were acquired by a minivib (vibroseis) and vertical component geophones. An IVI minivib controlled by a linear up-sweep (5 s) from 30 to 300 Hz was deployed as a seismic source. Three Mark Products L28E 40-Hz geophones in series were planted in 1.5-m arrays every 2.5 m along the line. Data were recorded on four 60-channel, R60 Geometrics StrataView seismographs networked for simultaneous 240-channel recording. A 6-second record with a sample interval of 0.5 ms was recorded. The source interval was 5 m. Three shots were recorded individually at each source station. Data were saved uncorrelated and unstacked to allow evaluation of precorrelation-processing techniques (Doll et al., 1996) and to permit sweep-specific editing to reduce noise prior to vertical stacking. A split-spread geometry was used in data acquisition to provide reasonable velocity control for deeper reflecting events.
Following is the data processing flow:
- Correlation: Raw data were correlated with the ground force recorded on the first channel of each record
- Trapezoidal bandpass filter (61-122-250-300 Hz)
- Scaling: Automatic gain control (200-ms window) or spherical divergence correction (50 dB/sec) (see below)
- Editing: first arrival muting; dead trace killing; surgical muting
- Velocity analysis
- Residual static correction
- Normal moveout (NMO) correction
- Common depth point (CDP) stack
In order to account for amplitude losses due to attenuation and wavefront divergence, scaling was performed on the data. Two alternate techniques were applied: (1) automatic gain control (AGC) and (2) spherical divergence correction.
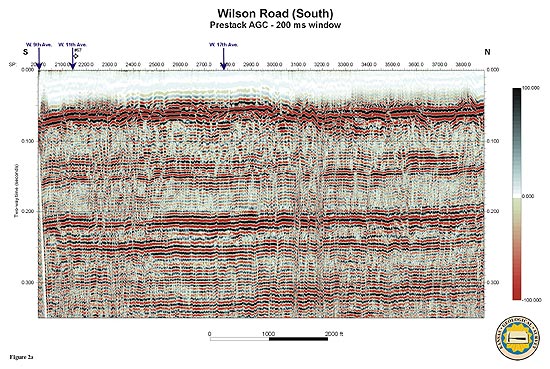
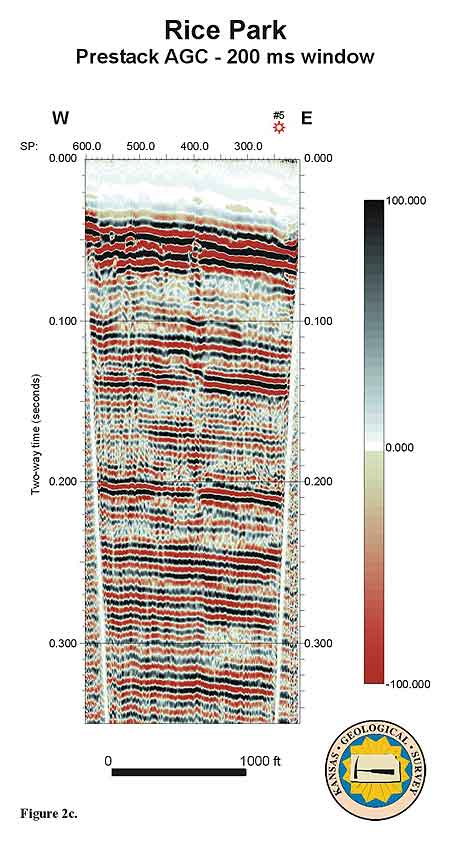
In AGC scaling, amplitudes are normalized within a sliding vertical window. This boosts small amplitudes and reduces the effects of noisy traces. In the resulting stacked data, amplitudes do not decay with increasing two-way time and reflections are easily traced laterally across the section. The downside of using AGC is that relative amplitudes are not preserved, and amplitude effects related to lateral changes in rock and fluid properties will not be maintained. CDP-stacked sections of the Wilson Road and Rice Park seismic lines using AGC scaling are shown in Figure 2.
Figure 2. CDP-stacked seismic sections from (a) Wilson Road (southern portion), (b) Wilson Road (northern portion), and (c) Rice Park, which had AGC scaling (using a 200-ms sliding window) applied pre-stack.

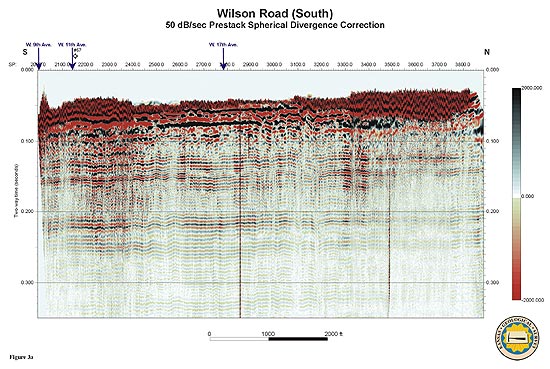
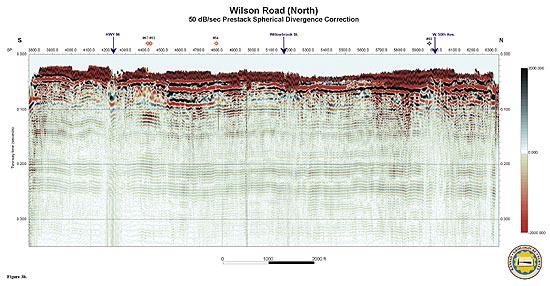
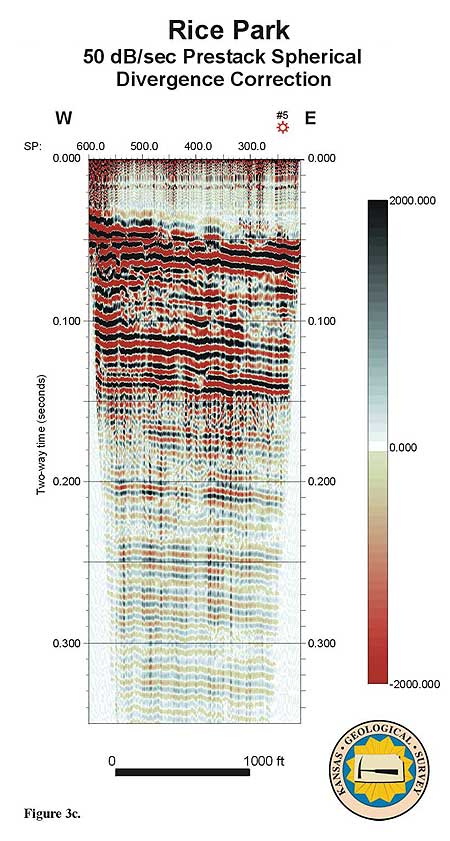
The spherical divergence correction uses a time-dependent gain function to correct for amplitude losses at later recording times. Since no amplitude normalization is used, this technique preserves relative amplitude variations. Problems with the spherical divergence technique include (1) incomplete removal of amplitude losses with increasing two-way time and (2) an inability to reduce the effect of high amplitude noise. CDP-stacked sections of the Wilson Road and Rice Park seismic lines using the spherical divergence correction are shown in Figure 3.
Figure 3. CDP-stacked seismic sections from (a) Wilson Road (southern portion), (b) Wilson Road (northern portion), and (c) Rice Park, which had a 50dB/sec spherical divergence correction applied pre-stack.
Seismic Interpretation
Seismic reflections on the CDP-stacked sections were initially tied to known rock formations using synthetic seismograms created with sonic and density logs from a well in the Yaggy storage field, and the reflection corresponding to the top of the gas-bearing interval was tentatively identified. Interpretations of the gas-bearing interval were made using both AGC and spherical divergence-scaled sections. The AGC sections were used to trace reflections laterally across the seismic section. The spherical divergence sections were used to identify lateral variations in amplitude, which might correspond to changes in fluid content or lithology of the layer. Stacked AGC-scaled sections with interpretations of the top of gas interval (yellow) and top of Hutchinson salt (light blue) are shown in Figure 4.
Figure 4. Interpreted CDP-stacked seismic sections from (a) Wilson Road (southern portion), (b) Wilson Road (northern portion), and (c) Rice Park. Synthetic seismograms from sonic and density logs in the vent wells are shown in dark blue. Natural gamma-ray logs are shown in green.
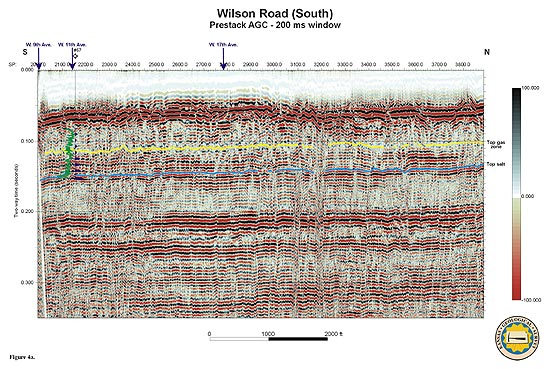
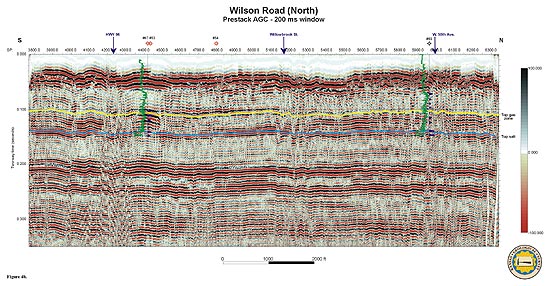
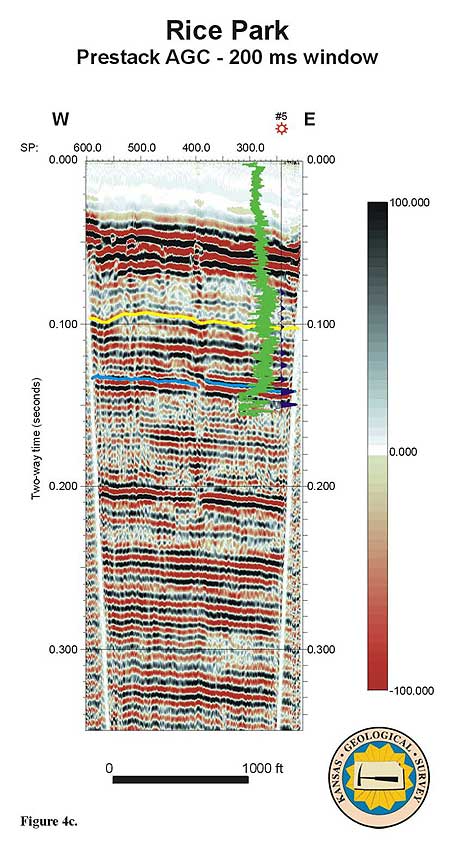
On the Rice Park seismic line, a high-amplitude, continuous reflection at the top of the gas-bearing interval appears to show a dim-out at the eastern end of the line, corresponding to the gas at DDV5. On the Wilson Road seismic line, the reflector corresponding to the top of the gas-bearing interval is low amplitude and difficult to trace laterally, except between Hwy 96 and Willowbrook St., where a high-amplitude, continuous reflection is present. Within this segment of the line, two amplitude anomalies, approximately 1/3 mile apart, were identified and drilled. One anomaly was a dim-out (DDV54) and the other was a bright spot (DDV53). Gas was found at both locations. Three additional vent wells were drilled on the Wilson Road seismic line in order to obtain wireline logs and core of the gas-bearing interval. DDV57, at the south end of the line, and DDV63, at the north end of the line, were both dry holes. DDV67, located approximately 75 ft from DDV53, actively vented gas.
The variable seismic response of the gas-bearing interval indicates that, beneath Hutchinson, this interval and surrounding rock layers exhibit significant lateral variation in rock properties, and, at closely spaced locations, the presence of gas can produce different seismic anomalies.
References
Doll, W. E., Miller, R.D., and Xia, J., 1996, Enhancement of swept source near-surface seismic reflection data at a hazardous waste site, 66th Ann. Internat. Mtg., Soc. Expl. Geophys., Expanded Abstracts, 877-879.
Miller, R. D., Watney, W. L., Begay, D. K., and Xia, J., 2000, High-resolution seismic reflection to delineate shallow gas in eastern Kansas, The Compass, 75, 134-145.
Acknowledgments
The authors would like to thank Rick Miller, Dave Laflin, Chadwick Gratton, and Joe Anderson for conducting the seismic data acquisition.
Kansas Geological Survey
Send comments and/or suggestions to webadmin@kgs.ku.edu
Updated Aug. 27, 2002
URL = http://www.kgs.ku.edu/PRS/publication/2002/ofr37/index.html
|