Kansas Geological Survey, Open-file Report 2000-84
Interpretive Aspects of Seismic Coherence and Related Multi-trace Attributes
Previous Page--Article Start ||
Next page--Why use seismic coherence?
DefinitionsMulti-trace Seismic Attributes
See Bahorich and Farmer (1995), Marfurt et al. (1998), and Gersztenkorn and Marfurt (1999) for more information about the coherence algorithm. Seismic Time Slice through a Salt Dome
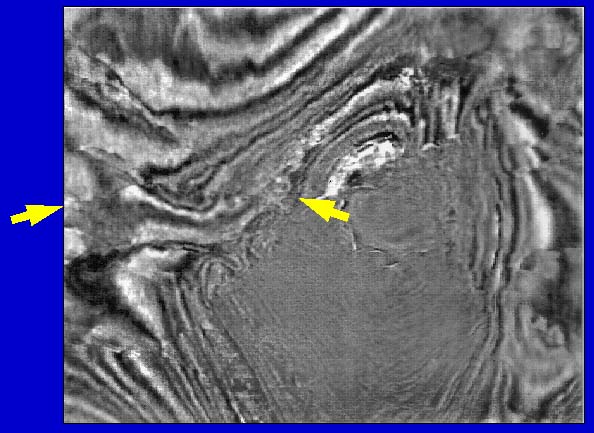
Seismic time slice through a salt dome. Yellow arrows mark the position of a fault which is difficult to see on this display but is easily identified on a corresponding coherence slice. Coherence Time Slice through a Salt Dome
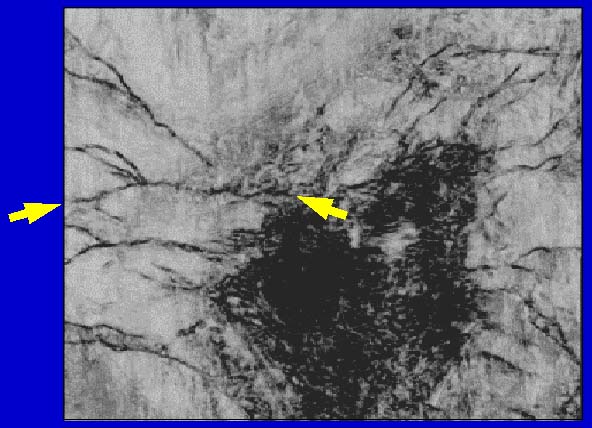
Coherence time slice corresponding to the seismic time slice shown in the previous slide. Note that the fault indicated by the yellow arrows can be seen clearly on this display. Dip/Azimuth
A schematic 2-D representation of the dip/azimuth calculation. Coherence is calculated for a range of dips (red lines), and in 3-D, azimuths, within a small analysis window around a reference trace. The dip/azimuth combination which has the highest coherence is assigned to be the instantaneous dip/azimuth for the point at the center of the analysis window. See Marfurt et al. (1998) for more information about the computation of dip/azimuth. Dip/Azimuth Slice through a Salt Dome
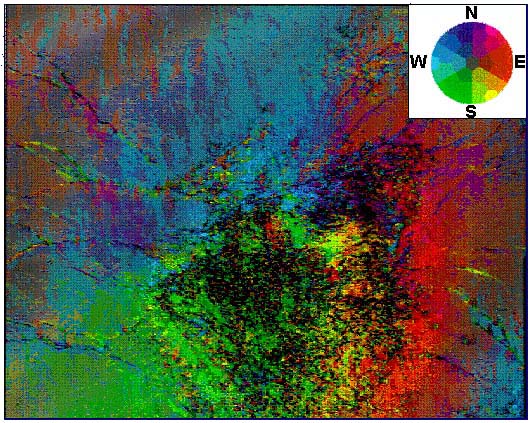
Dip/azimuth time slice through a salt dome. The dip/azimuth results are displayed using a 3-D HLS color wheel, with azimuth corresponding to hue (H), coherence corresponding to lightness (L), and dip corresponding to saturation (S). The lightness value is set to 0 (black) for coherence below a user-defined threshold value, so that the dip/azimuth plot will not be contaminated by noise in areas where coherence is low (e.g., within the salt dome). The color legend in the upper right corner of the figure shows the hue and saturation values used in the display. Pure colors on the outer edge of the circle correspond to high dips, and the gray center of the circle corresponds to zero dip. The hues on the dip/azimuth time slice indicate that the seismic reflectors dip away from the salt dome in a roughly circular pattern. |
|
|
Kansas Geological Survey, Petroleum Research Section
Updated January 2001
Comments to webadmin@kgs.ku.edu
The URL for this page is HTTP://www.kgs.ku.edu/PRS/publication/2000/ofr84/slide2.html