Characterization of Mississippian Osage Chat in South-Central
Kansas
Kansas Geological Survey
Open-file Report 2002-50

|
|
Kansas Geological Survey Open-file Report 2002-50 |


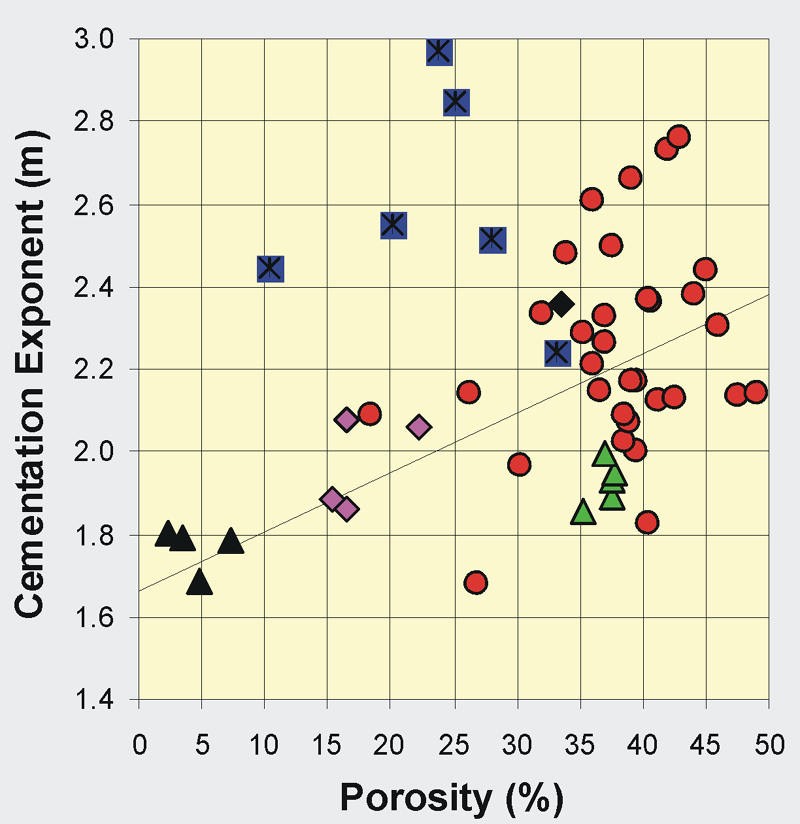
Traditional calculation of saturations using the Archie equation and cementation (m) and saturation exponent (n) values of 2 indicate high calculated water saturations. Duren (1967) reported cementation exponent values ranging from 2.24 to 2.73 and averaging 2.36, and saturation exponent values near 1.80 for autoclastic cherts from Glick Field.
Chert conglomerates exhibit very high cementation exponent
values with mavg=2.59+0.27. This is consistent with the high moldic
and vuggy porosity in the clasts of this lithofacies. Autoclastic
cherts exhibit a range in cementation exponent from m=1.68 to
2.76. These values are somewhat similar to those reported by Duren
for higher porosity autoclastic cherts. Nodular to bedded cherts
exhibit low cementation exponents ranging from m=1.86 to 1.99
with. Similarly, the dolomite mudstones and bioclastic wacke/grainstones
exhibit mavg = 1.97+0.11 and mavg = 1.77+0.05, respectively.
Variance in the cementation exponent of the autoclastic cherts
can be explained partially by sponge-spicule mold content and
vugginess at the plug scale but these are in turn related to position
within the depositional cycle and/or position relative to the
exposure surface or a perched water table.
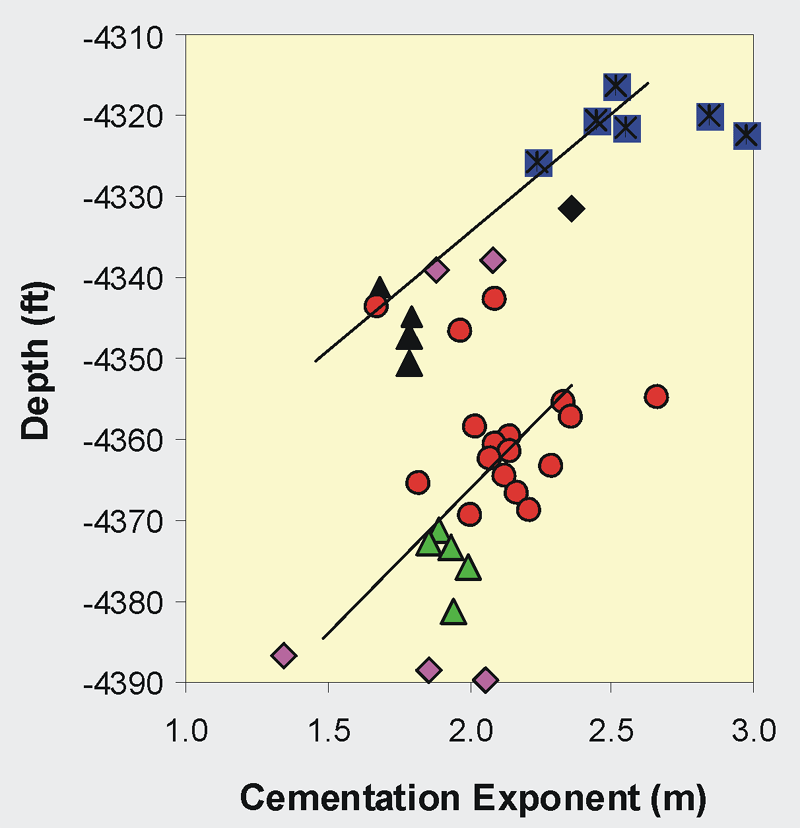
Figure illustrates the relationship of cementation exponent with depth and lithofacies in the Tjaden 1-A WIW. The pattern in cementation exponent shown in Figure can be related to both deposition and exposure. Cementation exponents increase with increasing sponge-spicule mold content and vugginess. The basal interval exhibits a slight increase in sponge-spicule mold content upward in the section, terminating at the base of the overlying bioclastic wacke/grainstone. Autoclastic cherts interbedded with the bioclastic wacke/grainstones exhibit lower sponge-spicule mold content. As such, the cementation exponent-depth pattern may be related to deposition and sponge-spicule content. Alternately, the presence of large clay and rubble-filled solution vugs in the bioclastic wacke/grainstones support the interpretation that these beds were lithified at the time of exposure.
Assuming they were lithified, they could be anticipated to act as aquitards and would be capable of forming the base of a perched water table. Within and immediately above a perched water table dissolution could be anticipated to be less than in the overlying vadose. With decreased vugginess in this wet interval, cementation exponents would be lower and would increase with proximity to the surface. Below the perched water table a saturation profile would also be established and the degree of vugginess and brecciation would decrease with increasing depth along with cementation exponents.
|
|