| Year | Oil | Gas | ||||
|---|---|---|---|---|---|---|
| Production (bbls) |
Wells | Cumulative (bbls) |
Production (mcf) |
Wells | Cumulative (mcf) |
|
| 1995 | 172,456 | 140 | 20,224,644 | - | - | 0 |
| 1996 | 201,014 | 120 | 20,425,658 | - | - | 0 |
| 1997 | 192,478 | 103 | 20,618,136 | - | - | 0 |
| 1998 | 167,871 | 92 | 20,786,007 | - | - | 0 |
| 1999 | 137,874 | 93 | 20,923,881 | - | - | 0 |
| 2000 | 135,095 | 94 | 21,058,976 | - | - | 0 |
| 2001 | 144,305 | 98 | 21,203,281 | - | - | 0 |
| 2002 | 134,537 | 95 | 21,337,818 | - | - | 0 |
| 2003 | 126,099 | 95 | 21,463,917 | - | - | 0 |
| 2004 | 166,352 | 106 | 21,630,269 | - | - | 0 |
| 2005 | 206,239 | 97 | 21,836,508 | - | - | 0 |
| 2006 | 205,765 | 99 | 22,042,273 | - | - | 0 |
| 2007 | 216,002 | 101 | 22,258,275 | - | - | 0 |
| 2008 | 268,056 | 107 | 22,526,331 | - | - | 0 |
| 2009 | 294,957 | 112 | 22,821,288 | - | - | 0 |
| 2010 | 354,558 | 109 | 23,175,846 | - | - | 0 |
| 2011 | 282,565 | 106 | 23,458,411 | - | - | 0 |
| 2012 | 255,295 | 115 | 23,713,706 | - | - | 0 |
| 2013 | 303,467 | 123 | 24,017,173 | - | - | 0 |
| 2014 | 267,157 | 124 | 24,284,330 | - | - | 0 |
| 2015 | 248,793 | 131 | 24,533,123 | - | - | 0 |
| 2016 | 257,362 | 124 | 24,790,485 | - | - | 0 |
| 2017 | 312,732 | 135 | 25,103,217 | - | - | 0 |
| 2018 | 280,433 | 137 | 25,383,650 | - | - | 0 |
| 2019 | 229,422 | 134 | 25,613,072 | - | - | 0 |
| 2020 | 172,042 | 129 | 25,785,114 | - | - | 0 |
| 2021 | 175,094 | 135 | 25,960,208 | - | - | 0 |
| 2022 | 179,395 | 140 | 26,139,603 | - | - | 0 |
| 2023 | 197,722 | 144 | 26,337,325 | - | - | 0 |
| 2024 | 189,191 | 137 | 26,526,516 | - | - | 0 |
| 2025 | 169,522 | 134 | 26,696,038 | - | - | 0 |
| 2026 | 24,738 | 106 | 26,720,776 | - | - | 0 |

| Abandoned | ||
|---|---|---|
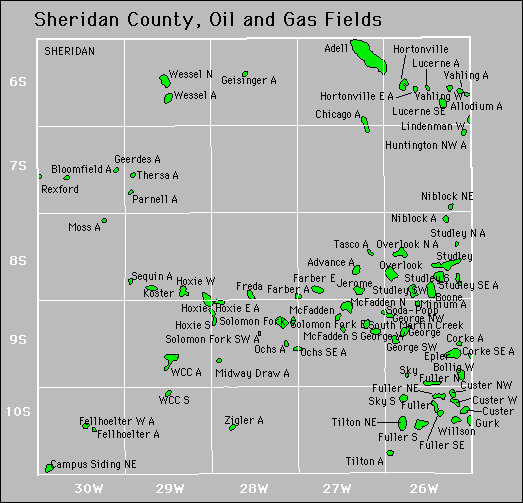
| Bloomfield Chicago Corke Corke Southeast Geerdes Geisinger |
George Lucerne Minium Moss Parnell Thersa |
Tilton Vahling Wessel |