| Year | Oil | Gas | ||||
|---|---|---|---|---|---|---|
| Production (bbls) |
Wells | Cumulative (bbls) |
Production (mcf) |
Wells | Cumulative (mcf) |
|
| 1995 | 40,127 | 39 | 3,434,537 | - | - | 0 |
| 1996 | 35,742 | 32 | 3,470,279 | - | - | 0 |
| 1997 | 33,771 | 32 | 3,504,050 | - | - | 0 |
| 1998 | 31,407 | 31 | 3,535,457 | - | - | 0 |
| 1999 | 30,792 | 33 | 3,566,249 | - | - | 0 |
| 2000 | 26,629 | 33 | 3,592,878 | - | - | 0 |
| 2001 | 24,866 | 33 | 3,617,744 | - | - | 0 |
| 2002 | 25,044 | 33 | 3,642,788 | - | - | 0 |
| 2003 | 23,726 | 33 | 3,666,514 | - | - | 0 |
| 2004 | 22,305 | 33 | 3,688,819 | - | - | 0 |
| 2005 | 21,663 | 32 | 3,710,482 | - | - | 0 |
| 2006 | 20,070 | 32 | 3,730,552 | - | - | 0 |
| 2007 | 18,574 | 32 | 3,749,126 | - | - | 0 |
| 2008 | 18,222 | 31 | 3,767,348 | - | - | 0 |
| 2009 | 18,693 | 31 | 3,786,041 | - | - | 0 |
| 2010 | 18,011 | 31 | 3,804,052 | - | - | 0 |
| 2011 | 15,950 | 31 | 3,820,002 | - | - | 0 |
| 2012 | 16,695 | 31 | 3,836,697 | - | - | 0 |
| 2013 | 16,249 | 31 | 3,852,946 | - | - | 0 |
| 2014 | 13,934 | 31 | 3,866,880 | - | - | 0 |
| 2015 | 13,270 | 31 | 3,880,150 | - | - | 0 |
| 2016 | 14,319 | 31 | 3,894,469 | - | - | 0 |
| 2017 | 15,146 | 31 | 3,909,615 | - | - | 0 |
| 2018 | 15,466 | 31 | 3,925,081 | - | - | 0 |
| 2019 | 13,809 | 31 | 3,938,890 | - | - | 0 |
| 2020 | 12,022 | 31 | 3,950,912 | - | - | 0 |
| 2021 | 12,238 | 28 | 3,963,150 | - | - | 0 |
| 2022 | 13,233 | 29 | 3,976,383 | - | - | 0 |
| 2023 | 12,479 | 27 | 3,988,862 | - | - | 0 |
| 2024 | 11,983 | 29 | 4,000,845 | - | - | 0 |
| 2025 | 11,512 | 29 | 4,012,357 | - | - | 0 |
| 2026 | 2,394 | 29 | 4,014,751 | - | - | 0 |
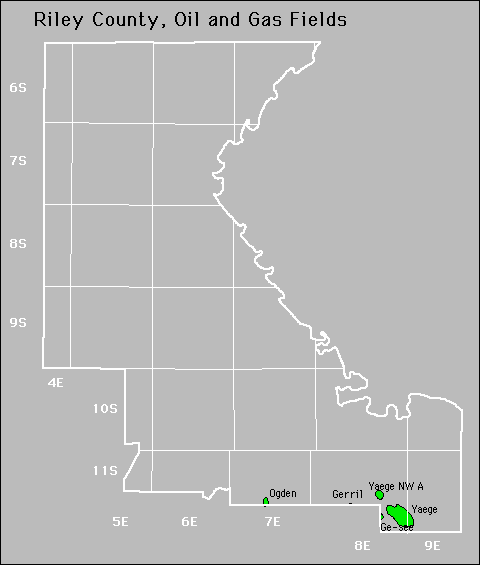

| Active | |||
|---|---|---|---|
| Ge-See Ogden |
Yaege Yaege Northwest |
Zeandale |
|
No Abandoned fields.