| Year | Oil | Gas | ||||
|---|---|---|---|---|---|---|
| Production (bbls) |
Wells | Cumulative (bbls) |
Production (mcf) |
Wells | Cumulative (mcf) |
|
| 1995 | 585,568 | 498 | 84,028,436 | - | - | 0 |
| 1996 | 569,846 | 358 | 84,598,282 | - | - | 0 |
| 1997 | 566,479 | 348 | 85,164,761 | - | - | 0 |
| 1998 | 503,004 | 340 | 85,667,765 | - | - | 0 |
| 1999 | 463,025 | 302 | 86,130,790 | - | - | 0 |
| 2000 | 456,639 | 296 | 86,587,429 | - | - | 0 |
| 2001 | 449,907 | 294 | 87,037,336 | - | - | 0 |
| 2002 | 425,853 | 297 | 87,463,189 | - | - | 0 |
| 2003 | 399,327 | 291 | 87,862,516 | - | - | 0 |
| 2004 | 379,321 | 290 | 88,241,837 | - | - | 0 |
| 2005 | 352,189 | 288 | 88,594,026 | - | - | 0 |
| 2006 | 344,277 | 290 | 88,938,303 | - | - | 0 |
| 2007 | 298,142 | 283 | 89,236,445 | - | - | 0 |
| 2008 | 306,611 | 295 | 89,543,056 | - | - | 0 |
| 2009 | 306,493 | 294 | 89,849,549 | - | - | 0 |
| 2010 | 306,251 | 302 | 90,155,800 | - | - | 0 |
| 2011 | 311,809 | 313 | 90,467,609 | - | - | 0 |
| 2012 | 362,505 | 332 | 90,830,114 | - | - | 0 |
| 2013 | 370,042 | 341 | 91,200,156 | - | - | 0 |
| 2014 | 345,633 | 339 | 91,545,789 | - | - | 0 |
| 2015 | 313,596 | 342 | 91,859,385 | - | - | 0 |
| 2016 | 271,692 | 333 | 92,131,077 | - | - | 0 |
| 2017 | 260,333 | 323 | 92,391,410 | - | - | 0 |
| 2018 | 253,098 | 324 | 92,644,508 | - | - | 0 |
| 2019 | 244,350 | 327 | 92,888,858 | - | - | 0 |
| 2020 | 205,270 | 319 | 93,094,128 | - | - | 0 |
| 2021 | 214,907 | 311 | 93,309,035 | - | - | 0 |
| 2022 | 224,613 | 307 | 93,533,648 | - | - | 0 |
| 2023 | 215,717 | 297 | 93,749,365 | - | - | 0 |
| 2024 | 188,249 | 289 | 93,937,614 | - | - | 0 |
| 2025 | 176,418 | 291 | 94,114,032 | - | - | 0 |
| 2026 | 42,795 | 252 | 94,156,827 | - | - | 0 |
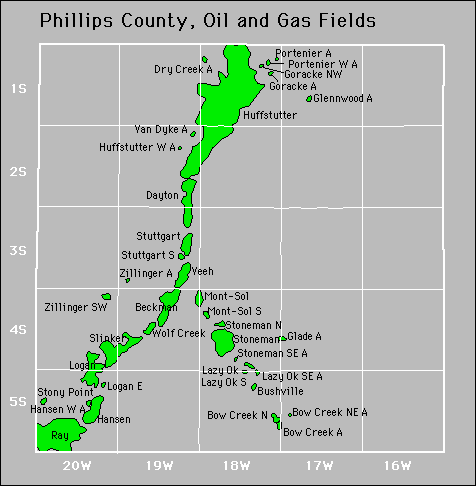

Abandoned
Bow Creek
Dry Creek
Glenwood
Portenier
Portenier West
Stony Point
Van Dyke