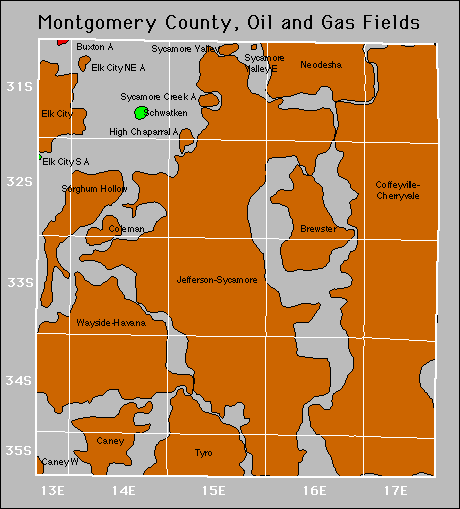
| Year | Oil | Gas | ||||
|---|---|---|---|---|---|---|
| Production (bbls) |
Wells | Cumulative (bbls) |
Production (mcf) |
Wells | Cumulative (mcf) |
|
| 1995 | 198,796 | 1053 | 61,403,043 | 1,713,592 | 243 | 21,660,711 |
| 1996 | 176,685 | 1779 | 61,579,728 | 1,475,655 | 309 | 23,136,366 |
| 1997 | 159,833 | 1488 | 61,739,561 | 1,310,459 | 267 | 24,446,825 |
| 1998 | 117,382 | 1163 | 61,856,943 | 1,091,249 | 220 | 25,538,074 |
| 1999 | 100,192 | 996 | 61,957,135 | 1,046,751 | 238 | 26,584,825 |
| 2000 | 99,025 | 1077 | 62,056,160 | 1,184,101 | 280 | 27,768,926 |
| 2001 | 87,966 | 1034 | 62,144,126 | 1,553,934 | 359 | 29,322,860 |
| 2002 | 106,323 | 1000 | 62,250,449 | 1,645,432 | 395 | 30,968,292 |
| 2003 | 99,221 | 891 | 62,349,670 | 2,877,888 | 497 | 33,846,180 |
| 2004 | 94,349 | 1001 | 62,444,019 | 4,357,056 | 690 | 38,203,236 |
| 2005 | 98,526 | 1124 | 62,542,545 | 6,018,006 | 932 | 44,221,242 |
| 2006 | 119,813 | 1078 | 62,662,358 | 8,176,626 | 1381 | 52,397,868 |
| 2007 | 94,154 | 1026 | 62,756,512 | 10,923,161 | 1629 | 63,321,029 |
| 2008 | 123,128 | 1050 | 62,879,640 | 12,597,581 | 1786 | 75,918,610 |
| 2009 | 125,030 | 1094 | 63,004,670 | 12,745,388 | 1696 | 88,663,998 |
| 2010 | 133,352 | 1113 | 63,138,022 | 12,247,654 | 1543 | 100,911,652 |
| 2011 | 151,547 | 1185 | 63,289,569 | 11,551,890 | 1542 | 112,463,542 |
| 2012 | 153,892 | 1251 | 63,443,461 | 10,225,727 | 1535 | 122,689,269 |
| 2013 | 141,150 | 1371 | 63,584,611 | 8,519,578 | 1476 | 131,208,847 |
| 2014 | 132,111 | 1334 | 63,716,722 | 7,538,001 | 1469 | 138,746,848 |
| 2015 | 103,889 | 1307 | 63,820,611 | 6,852,914 | 1428 | 145,599,762 |
| 2016 | 88,127 | 1260 | 63,908,738 | 6,081,159 | 1362 | 151,680,921 |
| 2017 | 86,439 | 1227 | 63,995,177 | 5,387,086 | 1313 | 157,068,007 |
| 2018 | 81,666 | 1155 | 64,076,843 | 4,886,060 | 1229 | 161,954,067 |
| 2019 | 72,609 | 1111 | 64,149,452 | 4,385,761 | 1183 | 166,339,828 |
| 2020 | 55,989 | 1035 | 64,205,441 | 3,799,355 | 1133 | 170,139,183 |
| 2021 | 58,867 | 1001 | 64,264,308 | 3,225,690 | 950 | 173,364,873 |
| 2022 | 64,703 | 1026 | 64,329,011 | 3,050,768 | 925 | 176,415,641 |
| 2023 | 66,022 | 1031 | 64,395,033 | 2,896,823 | 820 | 179,312,464 |
| 2024 | 69,868 | 1083 | 64,464,901 | 2,403,232 | 777 | 181,715,696 |
| 2025 | 59,386 | 951 | 64,524,287 | 1,529,351 | 699 | 183,245,047 |


Abandoned
Gas Storage Fields