| Year | Oil | Gas | ||||
|---|---|---|---|---|---|---|
| Production (bbls) |
Wells | Cumulative (bbls) |
Production (mcf) |
Wells | Cumulative (mcf) |
|
| 1995 | 167,053 | 696 | 26,749,657 | - | - | 153,071 |
| 1996 | 155,973 | 2341 | 26,905,630 | - | - | 153,071 |
| 1997 | 151,081 | 2229 | 27,056,711 | - | - | 153,071 |
| 1998 | 133,005 | 2100 | 27,189,716 | - | - | 153,071 |
| 1999 | 134,216 | 2094 | 27,323,932 | - | - | 153,071 |
| 2000 | 137,335 | 2102 | 27,461,267 | 83,959 | 20 | 237,030 |
| 2001 | 123,171 | 2005 | 27,584,438 | 114,279 | 24 | 351,309 |
| 2002 | 120,354 | 1977 | 27,704,792 | 142,937 | 28 | 494,246 |
| 2003 | 113,905 | 1982 | 27,818,697 | 182,905 | 48 | 677,151 |
| 2004 | 121,656 | 1976 | 27,940,353 | 222,793 | 48 | 899,944 |
| 2005 | 123,798 | 2053 | 28,064,151 | 199,735 | 53 | 1,099,679 |
| 2006 | 117,270 | 2064 | 28,181,421 | 294,242 | 147 | 1,393,921 |
| 2007 | 117,252 | 2113 | 28,298,673 | 304,365 | 191 | 1,698,286 |
| 2008 | 125,873 | 2174 | 28,424,546 | 418,045 | 293 | 2,116,331 |
| 2009 | 130,343 | 2192 | 28,554,889 | 310,834 | 264 | 2,427,165 |
| 2010 | 126,839 | 2225 | 28,681,728 | 211,694 | 244 | 2,638,859 |
| 2011 | 150,227 | 2269 | 28,831,955 | 144,310 | 224 | 2,783,169 |
| 2012 | 171,865 | 2336 | 29,003,820 | 25,564 | 36 | 2,808,733 |
| 2013 | 193,714 | 2314 | 29,197,534 | - | - | 2,808,733 |
| 2014 | 251,540 | 2439 | 29,449,074 | - | - | 2,808,733 |
| 2015 | 271,067 | 2452 | 29,720,141 | - | - | 2,808,733 |
| 2016 | 249,374 | 2514 | 29,969,515 | 39,696 | 25 | 2,848,429 |
| 2017 | 238,975 | 2557 | 30,208,490 | 140,755 | 39 | 2,989,184 |
| 2018 | 229,795 | 2512 | 30,438,285 | 31,155 | 37 | 3,020,339 |
| 2019 | 215,678 | 2522 | 30,653,963 | - | - | 3,020,339 |
| 2020 | 171,584 | 2496 | 30,825,547 | - | - | 3,020,339 |
| 2021 | 162,940 | 2517 | 30,988,487 | - | - | 3,020,339 |
| 2022 | 168,289 | 2495 | 31,156,776 | - | - | 3,020,339 |
| 2023 | 174,390 | 2577 | 31,331,166 | - | - | 3,020,339 |
| 2024 | 175,000 | 2587 | 31,506,166 | - | - | 3,020,339 |
| 2025 | 160,401 | 2501 | 31,666,567 | - | - | 3,020,339 |
| 2026 | 35,633 | 2157 | 31,702,200 | - | - | 3,020,339 |
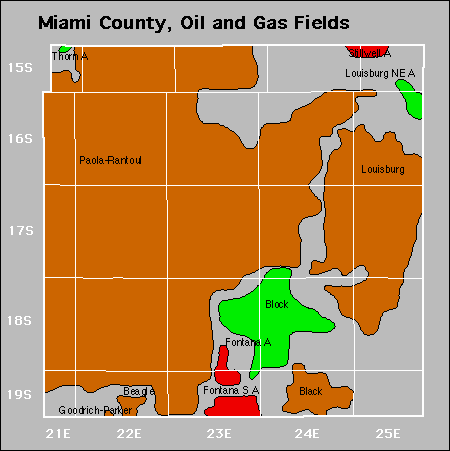

| Active | |||
|---|---|---|---|
| Beagle Black Black East |
Block Forest City Coal Gas Area Guetterman |
Louisburg Paola-Rantoul Stilwell |
Thorn |
Abandoned
Fontana
Fontana South
Louisburg Northeast