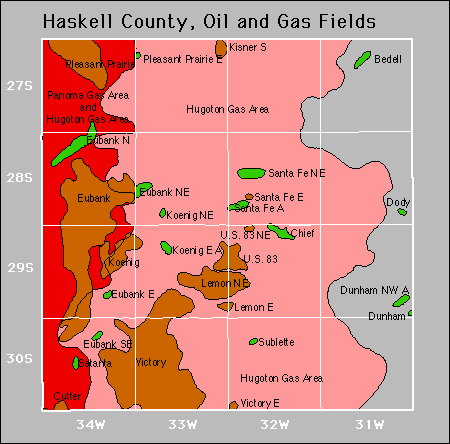
| Year | Oil | Gas | ||||
|---|---|---|---|---|---|---|
| Production (bbls) |
Wells | Cumulative (bbls) |
Production (mcf) |
Wells | Cumulative (mcf) |
|
| 1995 | 1,793,523 | 292 | 42,417,023 | 47,715,337 | 927 | 1,892,065,548 |
| 1996 | 2,133,916 | 333 | 44,550,939 | 50,873,276 | 1004 | 1,942,938,824 |
| 1997 | 2,422,963 | 328 | 46,973,902 | 54,946,368 | 1046 | 1,997,885,192 |
| 1998 | 1,913,756 | 315 | 48,887,658 | 49,152,355 | 1102 | 2,047,037,547 |
| 1999 | 1,703,038 | 328 | 50,590,696 | 45,745,063 | 1130 | 2,092,782,610 |
| 2000 | 2,397,757 | 375 | 52,988,453 | 44,361,362 | 1208 | 2,137,143,972 |
| 2001 | 2,158,348 | 417 | 55,146,801 | 40,936,417 | 1253 | 2,178,080,389 |
| 2002 | 1,761,598 | 418 | 56,908,399 | 37,898,579 | 1243 | 2,215,978,968 |
| 2003 | 1,576,940 | 389 | 58,485,339 | 35,181,611 | 1244 | 2,251,160,579 |
| 2004 | 1,762,021 | 391 | 60,247,360 | 33,555,444 | 1235 | 2,284,716,023 |
| 2005 | 1,707,960 | 397 | 61,955,320 | 31,213,413 | 1234 | 2,315,929,436 |
| 2006 | 1,624,932 | 405 | 63,580,252 | 29,412,023 | 1263 | 2,345,341,459 |
| 2007 | 1,594,064 | 441 | 65,174,316 | 26,621,731 | 1279 | 2,371,963,190 |
| 2008 | 1,961,741 | 463 | 67,136,057 | 26,779,155 | 1284 | 2,398,742,345 |
| 2009 | 2,115,564 | 456 | 69,251,621 | 26,316,892 | 1303 | 2,425,059,237 |
| 2010 | 2,006,044 | 457 | 71,257,665 | 24,277,235 | 1285 | 2,449,336,472 |
| 2011 | 1,829,151 | 443 | 73,086,816 | 22,655,053 | 1277 | 2,471,991,525 |
| 2012 | 1,698,670 | 447 | 74,785,486 | 19,736,736 | 1272 | 2,491,728,261 |
| 2013 | 1,995,296 | 465 | 76,780,782 | 18,144,898 | 1257 | 2,509,873,159 |
| 2014 | 1,923,025 | 484 | 78,703,807 | 17,274,323 | 1314 | 2,527,147,482 |
| 2015 | 1,736,324 | 516 | 80,440,131 | 17,201,128 | 1305 | 2,544,348,610 |
| 2016 | 1,724,121 | 531 | 82,164,252 | 14,917,841 | 1271 | 2,559,266,451 |
| 2017 | 2,454,050 | 523 | 84,618,302 | 13,357,217 | 1229 | 2,572,623,668 |
| 2018 | 2,495,543 | 523 | 87,113,845 | 12,573,213 | 1255 | 2,585,196,881 |
| 2019 | 2,398,367 | 513 | 89,512,212 | 11,890,955 | 1228 | 2,597,087,836 |
| 2020 | 2,031,865 | 487 | 91,544,077 | 10,659,438 | 1161 | 2,607,747,274 |
| 2021 | 1,831,186 | 497 | 93,375,263 | 9,820,104 | 1141 | 2,617,567,378 |
| 2022 | 1,719,334 | 491 | 95,094,597 | 9,012,882 | 1140 | 2,626,580,260 |
| 2023 | 1,645,198 | 489 | 96,739,795 | 8,182,659 | 1141 | 2,634,762,919 |
| 2024 | 1,608,157 | 452 | 98,347,952 | 7,738,376 | 1103 | 2,642,501,295 |
| 2025 | 862,823 | 432 | 99,210,775 | 3,605,070 | 1056 | 2,646,106,365 |


Abandoned