Kansas Geological Survey, Open-file Report 2017-2
KGS Open File Report 2017-2
January 2017
Read the PDF version (600 kB)
Southwest Kansas Groundwater Management District No. 3 (GMD3) requested that the Kansas Geological Survey (KGS) estimate annual uranium loads in the Arkansas River entering Kansas and express the loads in pounds per year. The KGS estimated uranium loads for the last five years (2012-2016). The climatic conditions for these years ranged from drought (2012) to near normal (2013, 2014, and 2016) to slightly wet (2015) based on the 12-month December value of the Standardized Precipitation Index for the Arkansas River watershed in Colorado.
Two approaches (named A and B hereafter) were used to estimate the annual total uranium load in the Arkansas River entering Kansas. The first involved obtaining flow and specific conductance data for the Arkansas River near Coolidge available via the web interface for the National Water Information System of the U.S. Geological Survey (USGS) for Kansas (https://waterdata.usgs.gov/ks/nwis/current/?type=flow); estimating the average annual uranium concentration for the average annual specific conductance from a uranium versus specific conductance plot based on KGS and Kansas Department of Health and Environment (KDHE) data; calculating the average daily annual uranium load by multiplying the average annual uranium concentration times the average annual flow for the year; and finally multiplying the average daily load by the number of days in the year. A variant of this approach was also used based on using median annual flow and specific conductance instead of average annual flow and specific conductance.
The second approach (B) comprised estimating the uranium concentration for each daily USGS specific conductance value during a year using the uranium versus specific conductance plot, calculating the uranium load for each day of the year using each estimated daily uranium concentration and daily flow value, and summing the daily uranium load values for a year.
Although average annual flow values are available from the annual statistics web page of the USGS for the Coolidge gaging station up to 2015, the average annual specific conductance is only available for one year (1980) because for all other years during which conductance was monitored there are many days with missing values. The missing conductance values for 2012-2016 were visually estimated based on flow and specific conductance values for dates before and after dates of missing values and the flow for days with missing values. In addition, missing daily conductance values were estimated from instantaneous values for days in 2016 for which the instantaneous values were not reported for the entire day. The average and median annual specific conductance were then computed for all years for approach A, and daily calculations made for approach B followed by summing for the year, using the combined measured and estimated conductance values. Annual flow for 2016 and median flow for 2012-2016 were determined from the daily flow values for these years.
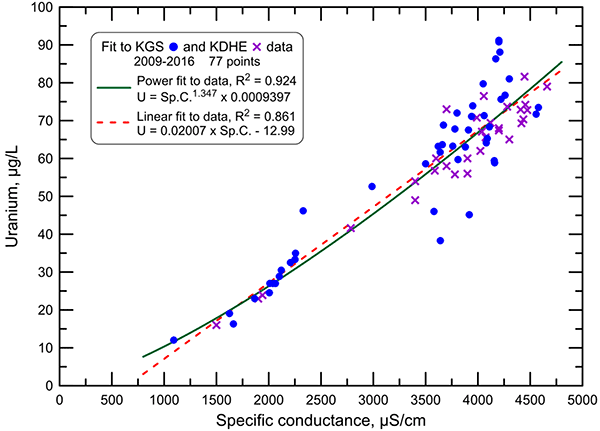
The uranium versus specific conductance plot (fig. 1) was generated using KGS data from a study on the river for the U.S. Environmental Protection Agency during 2009-2010, KDHE data during 2009-2016 (KDHE started its periodic determination of uranium concentration in the river water during 2009), KGS data from investigations for Southwest Groundwater Management District No. 3 (GMD3) during 2012-2013, and data from a Kansas Water Resources Institute study conducted by the KGS on uranium fate during 2014-2015. Data were used for samples collected from the Arkansas River near Coolidge and at Syracuse, Kendall, and the Amazon headgate. The chemical relationship between conductance and uranium (and most other dissolved constituents) for the river water at different sites in this stretch are nearly identical. Thus, use of data for the different sites expands the ranges of the conductance and uranium values, compared to using data for only the Coolidge location, and makes the relationship applicable to a wider range of flow and conductance conditions. Estimates of uranium concentration from specific conductance for this report are based on a power fit to the data
Uranium (µg/L) = (Specific conductance)1.347 x 0.0009397
because the coefficient of determination (R2) is higher than for a linear best fit and the extrapolation to lower conductance values is closer to what would be expected for low conductances than indicated by the linear fit.
The annual uranium loads were estimated for the last five years for which flow and specific conductance values are available (2012-2016) for the gaging station near Coolidge. The average annual flows (26.9 to 201.7 ft3/sec) for these five years are the range for the last decade (the average flow for 2007-2016 was 122.5 ft3/sec).
Figure 1--Uranium concentration versus specific conductance for samples collected from the Arkansas River from Coolidge to the Amazon Ditch headgate during 2009-2016.
The data and results for approaches A and B are listed in Tables 1 and 2.
Table 1--(a) Data and results for approach A, based on average annual flow, average annual specific conductance, and estimated average annual uranium concentration for each year. (b) Same as for part (a) except based on median annual flow and specific conductance.
| (a) | |||||||
| Year | Average annual Sp.C., µS/cm |
Average annual uranium concentration, µg/L |
Average annual flow, ft3/sec |
Average daily uranium load, kg/day |
Annual uranium load, metric ton/yr |
Annual uranium load, ton/yr |
Annual uranium load, lbs/yr |
|---|---|---|---|---|---|---|---|
| 2012 | 4,271 | 73.0 | 28.7 | 5.13 | 1.88 | 2.07 | 4,140 |
| 2013 | 4,395 | 75.9 | 26.9 | 5.00 | 1.82 | 2.01 | 4,020 |
| 2014 | 3,813 | 62.7 | 92.1 | 14.12 | 5.14 | 5.68 | 11,360 |
| 2015 | 3,230 | 50.1 | 196.1 | 24.05 | 8.78 | 9.68 | 19,350 |
| 2016 | 3,187 | 49.2 | 201.7 | 24.29 | 8.89 | 9.80 | 19,600 |
| (b) | |||||||
| Year | Median annual Sp.C., µS/cm |
Median annual uranium concentration, µg/L |
Median annual flow, ft3/sec |
Median daily uranium load, kg/day |
Annual uranium load, metric ton/yr |
Annual uranium load, ton/yr |
Annual uranium load, lbs/yr |
|---|---|---|---|---|---|---|---|
| 2012 | 4,245 | 72.4 | 8.9 | 1.58 | 0.58 | 0.64 | 1,270 |
| 2013 | 4,530 | 79.1 | 18 | 3.48 | 1.27 | 1.40 | 2,800 |
| 2014 | 4,020 | 67.3 | 59 | 9.72 | 3.55 | 3.91 | 7,820 |
| 2015 | 3,480 | 55.4 | 131 | 17.76 | 6.48 | 7.15 | 14,290 |
| 2016 | 3,208 | 49.7 | 124 | 15.07 | 5.52 | 6.08 | 12,160 |
Table 2--Data and results for approach B, based on daily specific conductance, estimated daily uranium concentration, daily flow, and the sum of daily loads for each year.
| Year | Annual uranium load, metric ton/yr |
Annual uranium load, ton/yr |
Annual uranium load, lbs/yr |
|---|---|---|---|
| 2012 | 1.80 | 1.98 | 3,960 |
| 2013 | 1.61 | 1.78 | 3,560 |
| 2014 | 3.77 | 4.15 | 8,300 |
| 2015 | 6.01 | 6.63 | 13,260 |
| 2016 | 7.26 | 8.01 | 16,020 |
The calculations using median flow and specific conductance in approach A give a lower annual uranium load for a particular year than the calculations using average flow and specific conductance. Approach B gives annual total uranium loads that are between those calculated using approach A for average annual and median river flows and specific conductance for 2012-2014 and 2016, but a uranium load for 2015 that is a little less than that for the median annual flow and specific conductance calculation based on approach A. The reason for the lower load in 2015 is related to the distribution of daily flow and specific conductance values (fig. 2).
Figure 2--Mean daily flow and specific conductance in the Arkansas River near Coolidge 2012-2016.
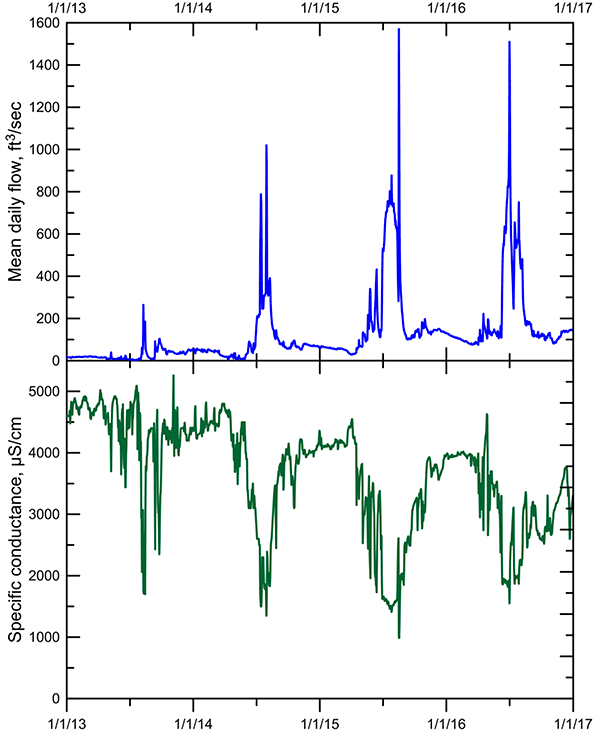
Although the estimated uranium concentration for a year with lower flow is generally higher than for a year with greater flow, the relative differences in the average and median flows during 2012-2016 are greater than those for the uranium concentration among the years, thus the flow has a more important influence on the annual load. This suggests that higher flow years in the past, such as during the most recent high-flow period of 1995-2000 when average annual flows exceeded 300 ft3/sec, would have had substantially greater total uranium loads than for 2012-2016. However, some of those loads passed downstream out of the GMD3 area because the Arkansas River flows were great enough during most of 1995-2000 to sustain flow past Ford County. The flows entering Kansas during 2012-2016 remained within GMD3 and seeped into the alluvial and High Plains aquifers underlying the river channel or were diverted for irrigation in Kearny and Finney counties. Thus, the uranium accumulated in the aquifer groundwater, on sediments of the alluvial and High Plains aquifers, and in the soils underlying the ditch irrigated areas and other areas where groundwater used for irrigation has been affected by Arkansas River infiltration.
Partial funding of the study was provided by the State Water Plan Fund under the Ogallala-High Plains Aquifer Assessment Program. Tony Stahl of the Kansas Department of Health and Environment provided water-quality data for samples collected and analyzed by the KDHE for the Arkansas River near Coolidge. Jordi Batlle-Aguilar of the KGS reviewed and Julie Tollefson of the KGS edited the report.
Kansas Geological Survey, Geohydrology
Placed online Feb. 7, 2017
Comments to webadmin@kgs.ku.edu
The URL for this page is http://www.kgs.ku.edu/Hydro/Publications/2017/OFR17_2/index.html