Kansas Geological Survey, Open-file Report 2005-29
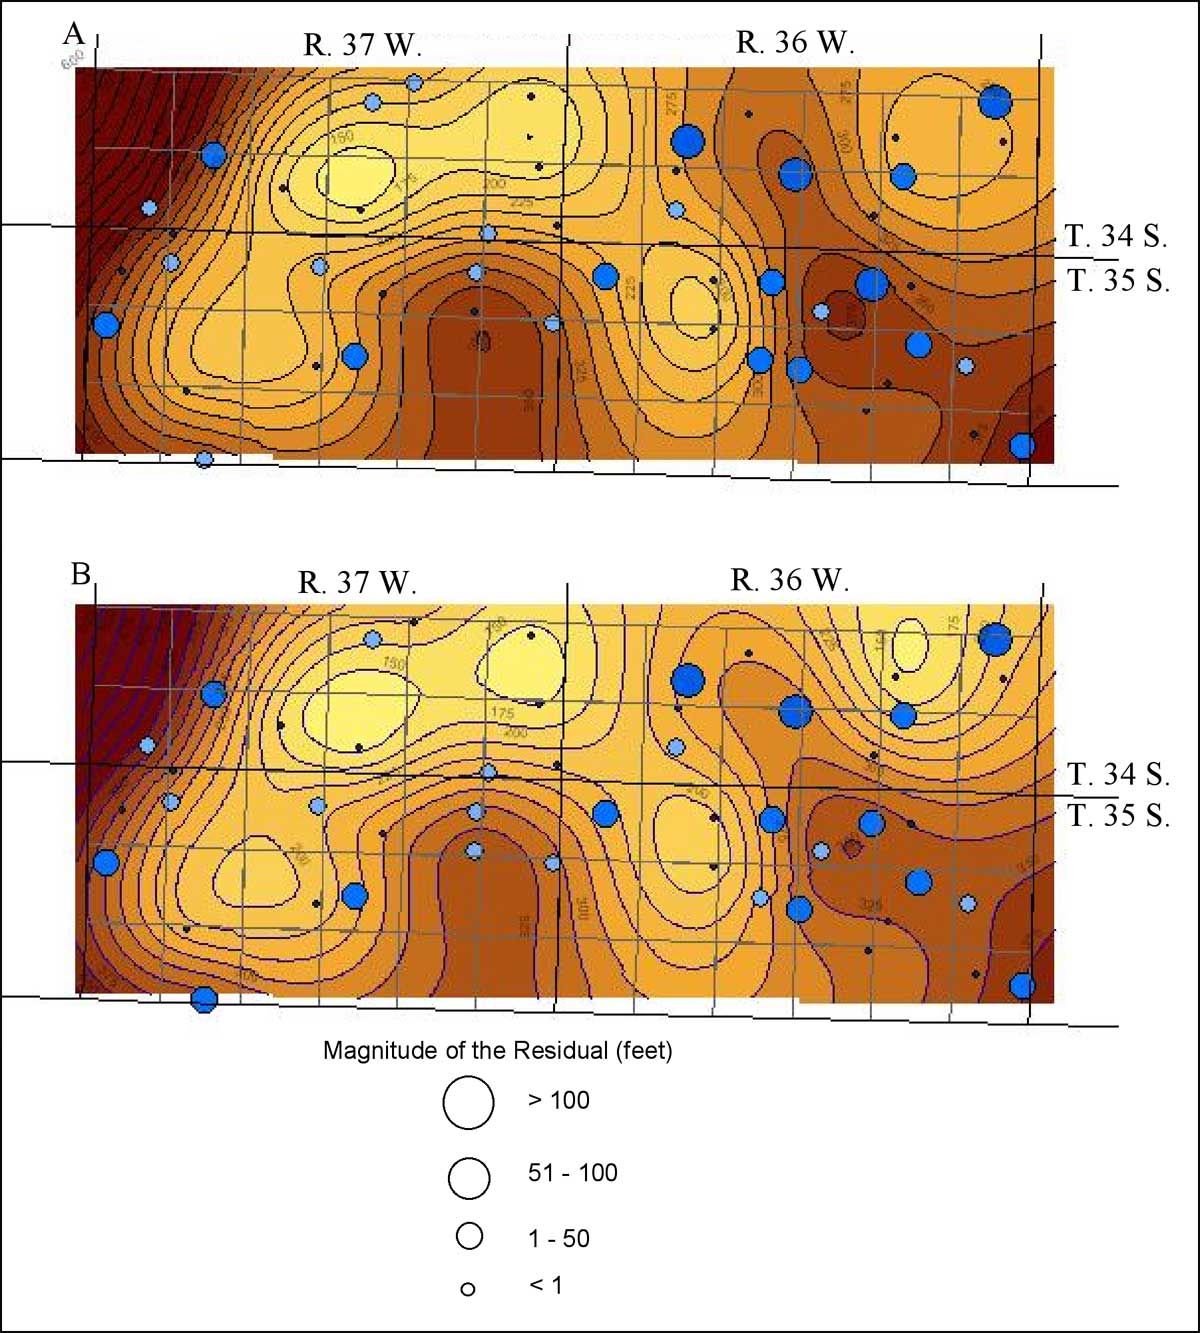
Figure 11. The effect of smoothing using splines with weighting (A) and splines without weighting (B). The size of the blue dot represents the magnitude of the error induced from using the smoothing of the raw data.
Kansas Geological Survey, Geohydrology
Placed online Feb. 1, 2006
Comments to webadmin@kgs.ku.edu
The URL for this page is http://www.kgs.ku.edu/Hydro/Publications/2005/OFR05_29/fig11.html