Kansas Geological Survey, Open-file Report 2004-3
by
Donald O. Whittemore
Kansas Geological Survey
KGS Open File Report 2004-3
for the
Kansas Academy of Science, Fall Field Trip
Tallgrass Prairie National Preserve, Chase County, Kansas
September 27, 2003
Springs and seeps discharge from Lower Permian limestone and dolomite units separated by shales along and at the base of slopes in the Konza Prairie and Tallgrass Prairie National Preserve in the Flint Hills of Kansas. Rainwater infiltrating to the bedrock units dissolves the carbonate minerals calcite (CaCO3) and dolomite (CaMg[CO3]2) to produce calcium-bicarbonate waters (Table 1). Spatial and temporal variations in the chemistry of the spring waters are mainly controlled by dissolution of small amounts of gypsum (CaSO4 • 2H2O) in the bedrock, which mainly increases the calcium and sulfate concentrations, especially in the Konza Prairie. The sulfate contents of springs with greater sulfate concentration generally decrease with increasing flow, indicating the discharge of larger amounts of flow from recharge nearer the outcrop where the gypsum has been removed by weathering (Whittemore, 1980).
Table 1. Conductance and concentrations of major and minor dissolved constituents in example springs in the Konza Prairie and Tallgrass Prairie National Preserve. The first Konza spring issues from the Crouse Limestone and the second discharges from the Eiss Limestone Member of the Bader Limestone (Whittemore, 1980). The first Tallgrass spring issues from the Crouse Limestone and the second discharges from the Wreford Limestone (Sawin and Buchanan, 2000).
| Preserve | Sp.C.a μS/cm |
SiO2 mg/L |
Ca mg/L |
Mg mg/L |
Na mg/L |
K mg/L |
HCO3 mg/L |
C1 mg/L |
SO4 mg/L |
NO3-N mg/L |
TDSb mg/L |
|---|---|---|---|---|---|---|---|---|---|---|---|
| Konza | 562 | 9.7 | 80.6 | 19.3 | 9.2 | 0.9 | 308 | 2.1 | 48 | 0.02 | 322 |
| Konza | 860 | 12 | 133 | 30.2 | 7.7 | 0.7 | 339 | 1.5 | 197 | 0.16 | 550 |
| Tallgrass | 528 | 12.2 | 93.8 | 9.0 | 5.2 | 0.8 | 334 | 3.1 | 9.8 | 0.18 | 299 |
| Tallgrass | 670 | 11.5 | 96.4 | 19.2 | 17.9 | 0.7 | 411 | 6.1 | 24 | 0.33 | 379 |
| aSpecific conductance bTotal dissolved solids |
|||||||||||
The springs and seeps feed the baseflow of streams in the preserves. Therefore, the baseflow inorganic chemistry is similar to an average for the springs that is proportional to the relative amounts of discharge. The main chemical change is an increase in pH from about 7 units in the spring water to several tenths to a unit higher in the stream as caused by degassing of dissolved carbon dioxide. Flow in the streams increases during and following rainfall events that are large enough to cause increased recharge and, thus, discharge from the springs as well as runoff from the soils. The concentrations of major dissolved constituents decreases below those in the spring waters in stream waters composed primarily of soil runoff.
The electrical conductivity of water is proportional to its dissolved ion concentration. Conductivity is also one of the easiest measurements to make in the field or laboratory. Therefore, the conductivity of water is often determined and used as a measure of total dissolved solids (TDS) content. The units commonly used for specific conductance of water are μS/cm, which are the same as the units μmho/cm used in earlier publications. The conductivity of an aqueous solution varies proportionally with the temperature. An increase in one °C in a fresh to slightly saline water results in an increase in about 2% in the specific conductance when the temperature is near 25 °C. Specific conductance values are therefore corrected for temperature and reported at the standard temperature of 25 °C. Older conductivity meters may require measurement of the temperature and meter adjustment or manual calculation of the temperature correction. Newer meters with temperature measurement can automatically correct for temperature to 25 °C. However, if not enough time is allowed for the conductivity probe to come into temperature equilibrium with the water being measured, error can still be introduced into the reading even with automatic temperature compensation.
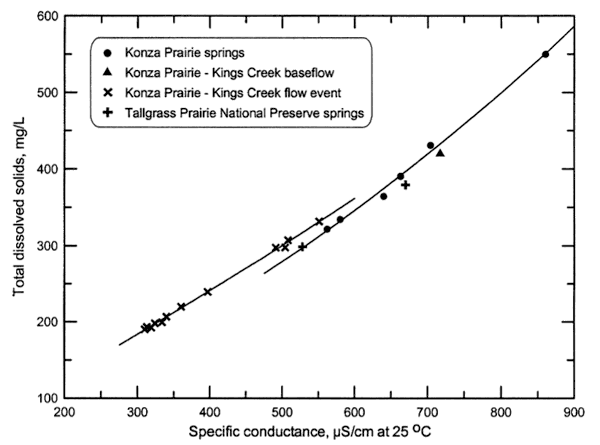
Plots of TDS and individual major constituent concentrations versus specific conductance can be used for estimating concentrations given a specific conductance measurement. The accuracy of the estimation depends not only on the accuracy of the conductance measurement but also the error in the determinations of the constituents used to prepare the plot. Figure 1 displays the relationship between TDS and specific conductance for springs in the Konza and Tallgrass prairies and Kings Creek in the Konza Prairie. The Kings Creek flow event represents a set of samples collected by an automated water sampler that was triggered by the rising level of the stream during a rainstorm in June 1980. The flow event sample with the highest conductance was collected 9 days after the storm. The data for the two spring samples from the Tallgrass Prairie fit the curve fit for the Konza springs relatively well. The relationship for TDS and conductance for Tallgrass Prairie streams is not expected to deviate substantially from the relationship shown for Kings Creek in Figure 1.
Figure 1. Relationship between TDS and conductance for springs and streams in Flint Hills prairie preserves. The lines are best-fit polynomial curves for the Konza Prairie spring and stream data.
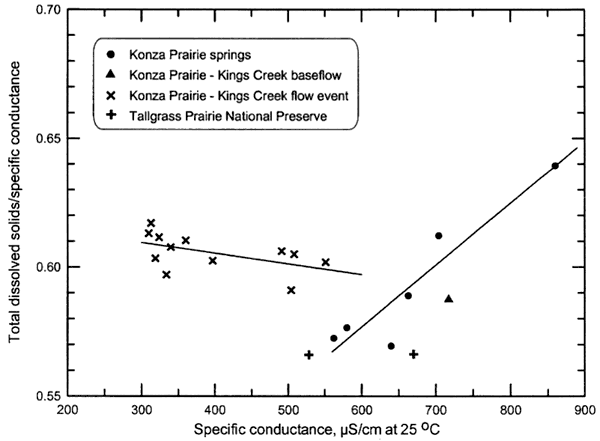
Some conductivity meters have a readout for TDS as well as conductance. The TDS readout is a meter-calculated value based on the factor TDS/conductance. Factory set factors usually range from 0.5 to 0.6. However, TDS/conductance ratios typically range from greater than 0.5 to 0.8. Determination of the factor for waters in a particular area or of a particular chemical type improves the estimation of TDS concentration based on a factor times conductance. Figure 2 shows the relationship between the TDS/conductance ratio and specific conductance for spring and stream waters in the Konza and Tallgrass Prairies. A factor of 0.58 ±0.02 is appropriate for spring waters with conductance less than 700 μS/cm. The TDS/conductance ratio increases with increasing conductance above 700 μS/cm primarily due to the effect of greater sulfate concentration. A factor of 0.60 ±0.02 appears to be valid for stream waters of the Konza Prairie. A factor of 0.59 ±0.02 is expected to be a good estimate for streams of the Tallgrass Prairie based on the slightly lower TDS/conductance ratio for Tallgrass Prairie spring waters relative to those in the Konza Prairie.
Figure 2. Relationship between TDS/conductance and conductance for springs and streams in Flint Hills prairie preserves. The lines are linear regressions for the Konza Prairie data.
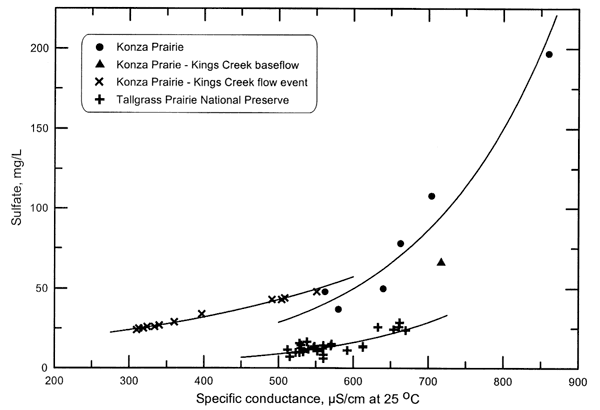
The sulfate concentration can be estimated relatively well from conductance measurements for spring and stream waters in the Konza and Tallgrass prairies (Figure 3). Exponential curves appear to fit the relationship better than other functions. The sulfate and conductance relationship for the Tallgrass Prairie springs indicates that the sulfate concentration comprises a somewhat lower percentage of the TDS content within the range of overlapping conductance values. The sulfate concentration range is lower for the Tallgrass Prairie springs than for the Konza Prairie springs, suggesting that the amounts of gypsum available for dissolution are smaller in the bedrock of the Tallgrass Prairie than in the Konza Prairie.
Figure 3. Relationship between sulfate concentration and specific conductance for springs and stream samples in Flint Hills prairie preserves. The lines are best-fit exponential functions for the three data sets with multiple values.
Sawin, R., and Buchanan, R., 2000, Water quality of selected springs--Tallgrass Prairie National Preserve, Chase County, Kansas. Kansas Geological Survey, Open-file Report 2000-1.
Whittemore, D.O., 1980, Geochemistry of natural waters in the Konza Prairie: Kansas Geological Survey, Open-file Report 80-20.
Kansas Geological Survey, Geohydrology
Placed online Jan. 12, 2006
Comments to webadmin@kgs.ku.edu
The URL for this page is http://www.kgs.ku.edu/Hydro/Publications/2004/OFR04_03/index.html