Kansas Geological Survey, Open-file Report 2003-12
by
John M. Healey and James J. Butler, Jr.
KGS Open-file Report 2003-12
February 2003
Three monitoring wells were constructed by the Kansas Geological Survey at three locations along the Republican River in Clay County of north central Kansas as part of an effort to enhance the Division of Water Resources' well monitoring network and to better understand the Republican River alluvium. Wells were sited in the vicinity of the towns of Clay Center, Morganville, and Clifton. Direct-push electrical conductivity logging was used to understand the lithology of the shallow subsurface and to select appropriate intervals for well screens and annular seals. Following well construction and development, a series of slug tests were performed.
This report represents the fulfillment of the Kansas Geological Survey (KGS) obligations under agency Contract Number 1485, entered into with the Kansas Department of Agriculture, Division of Water Resources (DWR) on March 1, 2002 and terminating on November 1, 2002.
Under the terms of the contractual agreement, the KGS provided equipment, services, and expertise to the DWR for an investigation along three designated stretches of the Republican River. This report provides a detailed description of all work performed and includes: 1) electrical conductivity logs with geological interpretations, 2) construction details with schematics of each monitoring well, and 3) hydraulic conductivity estimates of the alluvium determined from slug testing.
This work was completed at three locations along the Republican River in north central Kansas. The DWR determined the well locations, which were within county road easements and adjacent to the main channel of the Republican River. DWR retains ownership of all wells and is responsible for their maintenance.
Well locations were named according to the nearest city or town and will be discussed beginning with the southernmost well and progressing northward. The well sites are: Clay Center, Morganville, and Clifton.
Figure 1. Location map
The red symbols on Figure 1 are the approximate locations of the three wells sites showing their relative position with respect to the Republican River and the nearest municipality. The cities of Clay Center, Morganville, and Clifton lie along the Republican River, which appears as a solid blue line in the figure and flows in a southeasterly direction to Milford Reservoir. The area shown lies within the eastern sub-basin of the Lower Republican Basin.
The following discussion will be presented in the chronological order of events and divided into three main sections. The three sections are: Site Investigation, Well Construction and Development, and Aquifer Hydraulic Conductivity--Slug Test Methodology.
In brief, the first section outlines the site investigation method employed here (electrical conductivity survey), which was used to understand the lithology of the subsurface and to select appropriate intervals for well screens and annular seals. The second section describes methods used for well construction and well development. The third section consists of a description of field procedures used for slug tests at each site, and the resulting hydraulic conductivity estimate.
The work began with a brief reconnaissance trip. The purpose of the trip was to become familiar with general site conditions and to locate and identify utility hazards or other site obstructions. After all required utility clearances and land-use agreements were obtained, the initial investigations of all sites were completed on May 25, 2002.
The initial site investigation employed a direct-push technique known as electrical conductivity profiling. This technique can be an effective means of defining lithology in a cost effective manner, particularly for identification of aquifer and aquitard boundaries within unconsolidated alluvial sediments (Butler et al., 1999). The field equipment consists of a power unit, electrical probe instrument, instrument control box, and depth indicator. A laptop computer provides real time data logs, which may be printed in the field or saved to a disk for later interpretation. The electrical conductivity (EC) probe used was a Geoprobe SC 400, a tool that allows the investigator to select one of four different electrical arrays in order to adjust the lateral extent of investigation. For the DWR exploration activities, the Wenner array was selected to achieve the greatest lateral extent of investigation.
The probe is advanced into the subsurface by hydraulic pressure and percussion hammering with a Geoprobe 66DT unit. As the probe advances, it measures the electrical conductivity of the sediments at intervals of 0.05 ft. Electrical conductivity of unconsolidated sediments is a function of grain size, the bulk chemical composition, percent of saturation, and characteristics of the pore fluids contained within the sediments. In general, high electrical conductivity measurements are indicative of fine-grained material (clay), whereas low conductivity measurements are indicative of coarse-grained sediments. For this report, low conductivity is assumed to represent sand and gravel, intermediate conductivity represents silt, and high conductivity represents clay. The contribution to any conductivity signal due to water composition could not be determined. For this determination, analysis of water samples would be necessary, which is beyond the scope of this work.
For this investigation, the EC probe was advanced until one of the following criteria was met: 1) tool refusal, often indicative of bedrock contact or other well-indurated sediments, or 2) sufficient overall depth and thickness of aquifer unit for well installation. The information obtained from the EC logs was the only means of lithologicial interpretation used in this investigation. This procedure does not produce drill cuttings for visual inspection and description, and no cores were taken.
For this report, the EC data were saved to a disk, imported into Excel, and plotted. These graphs show electrical conductivity in milliSiemens/meter (mS/m) vs. probing depth in feet (ft). The following diagrams show the electrical conductivity profiles and a brief geological interpretation for each well site. In the description along the margins of the plots, several units are labeled. Features presented on the EC plots include: electrical conductivity profile (red line), inferred water table (bold blue dashed line), inferred breaks in lithology (small black dashed line), and the approximate position of the screened interval (hashed box).
At the Clay Center site, located NW 1/4, SW 1/4, SW 1/4, Section 1 Township 8S, Range 2E, the unconsolidated sediments are approximately 63.9 feet in thickness. The bedrock contact was determined by both the decrease in penetration rate while probing and by a shift in the electrical conductivity at the bottom of the profile (see Figure 2). This shift in conductivity is thought to represent a weathered bedrock horizon overlying a more competent well-indurated horizon.
Figure 2. The Electrical Conductivity Profile of the Clay Center Site and the Geologic Interpretation.
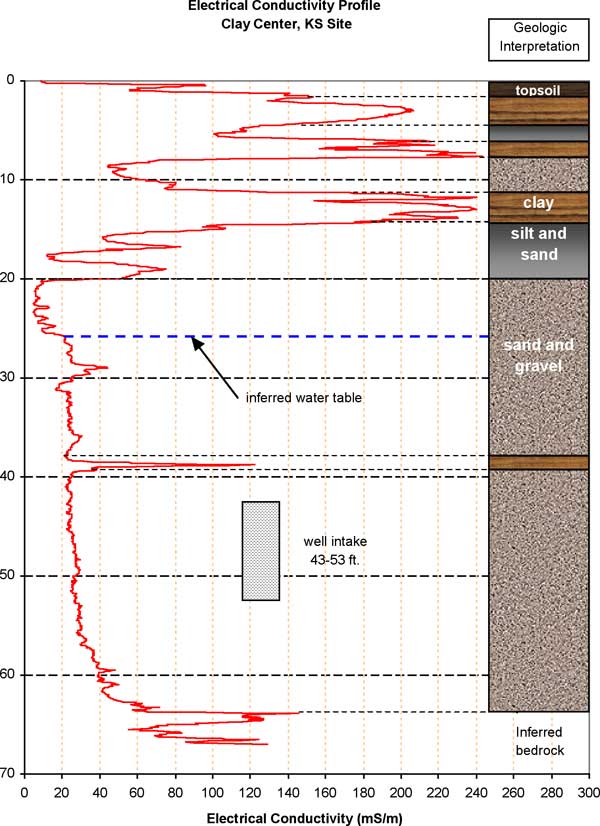
The unconsolidated sequence overlying the bedrock at this site represents alluvial deposition associated with the modern day Republican River. It consists of sediment typical of meandering river deposits, alternating alluvial sequences of sand and gravel interbedded with minor well-defined silt and/or clay streaks. The upper 20 feet of the section consist of three clay layers (1.75-4.25 ft., 6.40-7.60 ft., and 11.35-14.20 ft.) interbedded with several silt layers and a sand layer at approximately 18 feet.
The remaining underlying sediments, 20 to 63.9 feet, consist of a sand and gravel unit with two noteworthy features. The first feature is the increase in the electrical conductivity at approximately 25 feet. This increase is thought to represent the water table at the time of profiling. The second feature is the high conductivity reading at 39 feet. This represents the only fine-grained clay streak within the predominately sand and gravel unit.
The Morganville site is located in the SW 1/4, SW 1/4, NE 1/4 of Section 29, Township 6S Range 2E, Clay County, Kansas. As shown in Figure 3, the alluvial sequence at this site is approximately 54.25 feet in thickness. The upper 7 feet of the section consists of an alternating sequence of clay, silt and sand, which is followed by sand and gravel that extends to bedrock.
Figure 3. The Electrical Conductivity Profile of the Morganville Site and the Geologic Interpretation
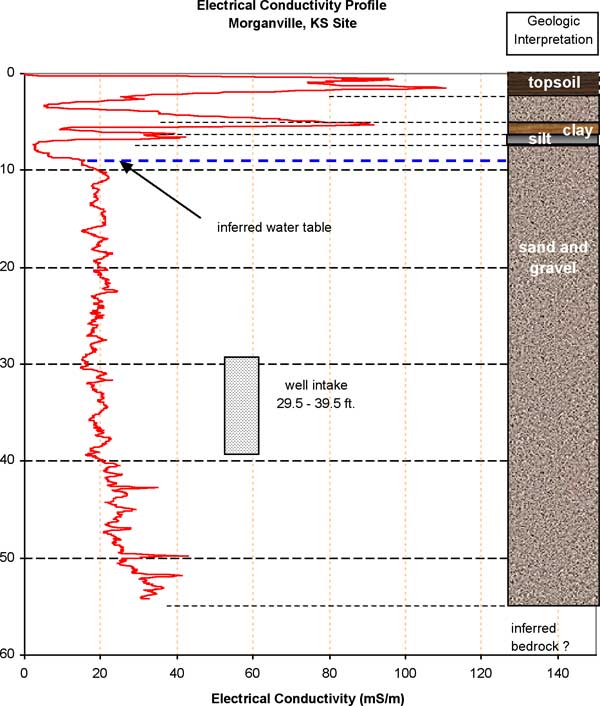
This sand and gravel unit, from 7 to 54.25 feet in depth, appear to be relatively free of silt and clay. The conductivity signal during profiling maintained a level of 20 mS/m down to 40 feet, before rising to 30 mS/m immediately above bedrock. This increase may be indicative of an increase in the percentage of fine-grain sediments or due to a slight variation in water chemistry.
There is no sharp boundary between the unconsolidated sediment and bedrock, as was evident in the Clay Center profile. This suggests that the top of the bedrock is well-indurated without a soft fine-grained weathered horizon. As at the Clay Center site, the Morganville EC plot shows an increase in electrical conductivity (at 9 feet) that most likely indicates the transition from unsaturated to saturated sediments, and thus the water table at the time of profiling.
The Clifton site is located in NW 1/4, SW 1/4, SW 1/4 of Section 1, Township 6S, Range 1E, Clay County, Kansas along Frontier Road, approximately one mile south of town. The electrical conductivity profile shows that the unconsolidated section is approximately 56 feet in thickness. It appears to be an alternating sequence of sand and gravel interbedded with thin clay layers. The uppermost part of the section, 0-4 feet, consists of topsoil and a thin silt unit that may be a product of disturbances associated with the construction of the county road. As with the two previous sites, a marked increase in electrical conductivity is seen at the top of the capillary fringe (water table), which occurs approximately 9 feet below grade.
Figure 4. The Electrical Conductivity Profile of the Clifton Site and the Geologic Interpretation.
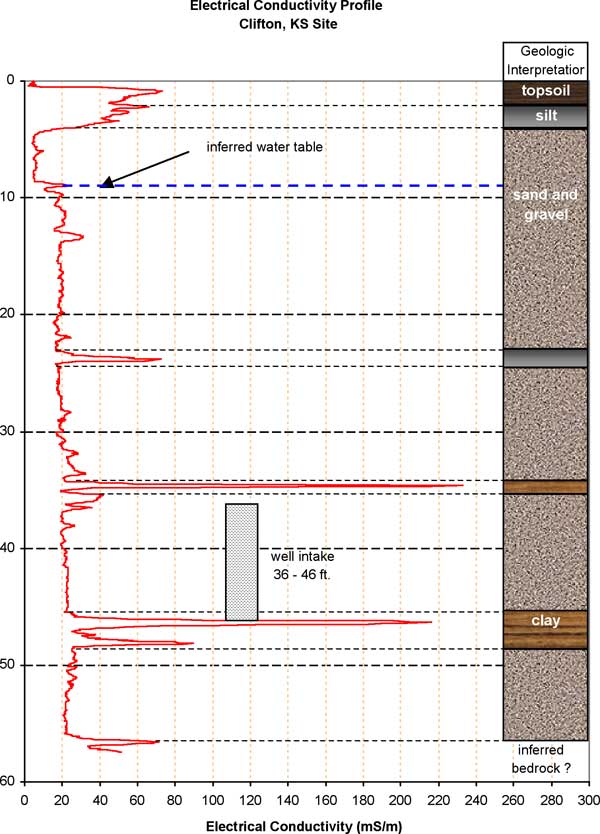
Upon closer inspection of the profile, there appear to be three or four distinct sand and gravel units, each separated by thin clay layers. These clay layers range in thickness from one to five feet. The five-foot clay does not appear to be massive but contains a sand or silt layer within it. These individual thin clay layers probably have a limited lateral extent. To determine the lateral extent of these clay would require additional investigation and is beyond the scope of this work.
Bedrock was encountered at 56 feet as illustrated on the EC plot. At this level, the penetration rate decreased significantly and the electrical conductivity of the sediment increased to 70 mS/m.
All of the observation wells were completed in accordance with regulations established by the Kansas Department of Health and Environment. Well depths and screened intervals were chosen based on the EC logs and discussions with DWR personnel. Copies of the well completion forms (WWC-5) are included in the Appendix. The geologic interpretations given on the WWC-5 forms are based upon the electrical conductivity profiles obtained at each site.
The Clay Center and Morganville wells were constructed in the same manner with the KGS Geoprobe unit (66DT). The unit was used to drive 3.5-inch (outer diameter) flush-joint steel casing (type NW) with inner rods and pilot bit to the desired depth. Upon reaching that depth, the inner rods were extracted while the 3.5-inch NW casing was flooded with potable water to prevent sand heave. The total depth inside the NW casing was measured to ensure correct well screen placement. The Clifton well was installed in a slightly different manner using heavy-walled drive casing and an expendable point, as is discussed in a later section.
Each well was constructed of 2-inch (Sch. 40 PVC) flush-joint (o-ring seals) casing with 10 feet of 2-inch (Sch. 40 PVC) 20-slot screen with a well point at the lower end. The casing string was assembled as it was lowered through the center of the steel pipe. After the PVC casing string, with the screen and well point at the lower end, was lowered to the bottom, the outer casing was retracted. The unconsolidated formation collapsed back against the PVC casing and screen as the outer casing was removed.
The following diagram is an illustration of a completed well installation. This illustration shows the various elements recommended for a monitoring well installation. Elements such as well protectors, casing, annular seals, well screen or intakes, and well points are common to all the wells installations. Typically, annular seals are emplaced by pumping slurries of bentonite, neat cement, or a mixture of bentonite and cement. The slurry mixture is pumped downhole through a tremie pipe. Because of the absence of thick clay units at these sites, grout slurry was not used. Instead, when the entire outer steel casing was removed, the depth of formation collapse was measured and then dry bentonite pellets were added to the hole. The pellets were poured slowly into the annular space from the surface to avoid bridging. Periodically, the dry bentonite was hydrated with the addition of water to the borehole. Placing a 4-inch steel well protector with a lock over the PVC casing completed the well.
A surface seal that includes a cement or concrete surface pad around the well is often constructed for monitoring wells, as shown in Figure 5. However, in this case, all the wells are located within county road easements, so a concrete surface seal were not used. Schematics of each well installation with appropriate dimensions are included in the appendix.
Figure 5. Recommended elements for a typical well installation (all elements except the surface seal were used here--not to scale).
During the installation of the Morganville well, the bottom 5-foot segment of NW steel drive pipe broke off from the pipe string due to joint failure. This was not evident until the PVC well casing was installed and all NW casing above the failed joint was removed. Water level responses to development activity showed that there was good communication with the formation and that the well still had an adequate length of screen exposed to the formation. On the final trip to the site, a geophysical log was conducted to identify the exact position of the lost NW casing. From that log, it appeared that the steel casing is opposite the lower five feet of the screened interval. A printout of that log is not available.
Because of the problem at the Morganville site, the 3.5-inch NW system was replaced with 3.25 drive casing manufactured by Geoprobe for the Clifton site. In this case, the inner rods of the NW system were replaced with a steel expendable point that is dislodged upon reaching the desired depth. Again, potable water was added to prevent sand heave prior to the dislodgement of the expendable point.
Table of Observation Well Details
|
Location County/ Site Name |
Legal Description |
Total Depth (Post-development fromTOC) |
Approximate Screen Interval (from TOC) |
Top of Casing (TOC) above land surface |
Water Level 10/17/02 TOC |
|---|---|---|---|---|---|
| Clay County/ Clay Center |
Township 8 S Range 2 E Section 1 NW, SW, SW |
55.20 ft. | 45 ft. to 55 ft. | 1.75' | 30.725 ft. |
| Clay County/ Morganville ** |
Township 6 S Range 2 E Section 29 SW, SW, NE |
41.99 ft. | 31.5 ft. to 41.5 ft. | 1.98' | 11.92 ft. |
| Clay County/ Clifton |
Township 6 S Range 1 E Section 1 NW, SW, SW |
49.15 ft. | 39 ft. to 49 ft. | 2.58' | 14.30 ft. |
| All wells are constructed of two inch Schedule 40 flush joint casing with ten feet of two inch 20-slot screen equipped with well points. |
|||||
| The measurements listed as post-development (in bold) represent conditions after construction and development of the wells. |
|||||
| **Well with one five-foot section of NW drive casing around lower half of well screen | |||||
It is critical that observation wells be installed properly in order to obtain accurate information about the site hydrogeology. The single most important phase of well installation is the well development. An undeveloped well can yield poor results in many phases of hydrogeologic investigations (from water chemistry to hydraulic conductivity estimates). An aggressive development approach is necessary to correct the disturbance that occurs during the installation process. Two approaches were used in this work: 1) pumping and surging and 2) airlifting. Pumping and surging action was accomplished immediately after well installation with a centrifugal pump, drop pipe and foot valve. A pumping rate of approximately 10 gpm was maintained while the drop pipe and foot valve were moved in the well to produce a surging action. The pump was removed after successive periods of pumping and surging showed a decrease in turbidity of the discharge water. The wells were further developed with an airlifting method. An airline with conductor pipe was lowered into the water column and compressed air was released into the airline. A mixture of water, sediment, and air returned to the surface through the conductor pipe and was discharged as waste. The rapid succession of rising and falling water level in the well produced by the airlift method exerted a much greater stress to the formation than the pump and surge method. Airlifting was continued until the turbidity of the discharge water declined. The wells completed under this work were reasonably developed as will be evident in the following section.
The program of slug tests was carried out following guidelines for the design, performance and analysis of slug tests developed at the KGS (Butler et al., 1996; Butler, 1998; Fetter, 2001). The pneumatic method (Butler, 1998) was used for test initiation at all wells. This method involves placing an airtight wellhead apparatus on top of the well and pressurizing the air column in the sealed well casing. A slug test is initiated by a very rapid depressurization of the air column using a release valve. At least eight tests were performed at each well. The initial water-level change (H0) was varied in a systematic manner between tests so that the dependence of test responses on H0 and the significance of dynamic skin effects (Butler, 1998) could be assessed. As shown in Figures 6a-6c, head dependence and dynamic skin effects were found to be negligible at all wells. Changes in water level were measured for all tests using a pressure transducer (In-Situ PXD-261 0-15 psig transducer) connected to a data logger (Campbell Scientific CR23X). Air pressure within the sealed casing was also monitored using a pressure transducer (In-Situ PXD-261 0-15 psig transducer). Casing pressurization was accomplished using a nitrogen gas cylinder. Tests at all three wells exhibited underdamped behavior (i.e. were influenced by inertial effects (Butler, 1998)). Test data were therefore analyzed using two theoretical models for slug tests: 1) the high-K Bouwer and Rice model for slug tests with inertial effects in partially penetrating wells in unconfined aquifers (Springer and Gelhar, 1991; Butler and Garnett, 2000); and 2) the high-K Hvorslev model for slug tests with inertial effects in partially penetrating wells in confined aquifers (Butler, 1998; Butler and Garnett, 2000). All analyses were performed with AQTESOLV, an automated well-test analysis package (HydroSOLVE, 2001). The choice of confined or unconfined model was made on the basis of electrical conductivity logs and water level measurements.
Figure 6a. Clay Center Slug Tests--10/17/2002. Pneumatic Initiation.
Figure 6b. Clifton Slug Tests--10/17/2002. Pneumatic Initiation.
Figure 6c. Morganville Slug Tests--10/17/2002. Pneumatic Initiation.
The hydraulic conductivity (K) estimates obtained at all three wells are characteristic of interbedded coarse sands and gravels, consistent with the expected composition of the alluvial aquifer. The Clifton site has considerably lower K estimates than the other two wells, indicating the presence of finer materials in the vicinity of that well. The lower K estimates are supported by the electrical-conductivity log from Clifton, which indicates sediments with higher clay content than at the other well locations. A range is presented for the K at Clifton because of the uncertainty regarding the impact of the thin clay lenses shown on the EC logs. The lower end of the range (160 ft/day) is for the case where the clay lenses have essentially no impact on slug-induced flow. In contrast, the upper end of the range (184 ft/day) is for the case where the clay lenses prevent vertical flow during the slug tests, so all flow is horizontal in the plane of the well screen. The K estimate for Morganville site is based on the assumption that the lower 4.81 feet of the screen is blocked by the 5.5' pipe segment that was left at the bottom of the hole. If the nominal screen length (9.81 ft) is used in the analysis, the K estimate decreases to 316 ft/day. However, there is no justification for using the nominal screen length for analysis of slug tests at this well.
Note that Butler (1998) emphasizes that the impact of incomplete well development on slug tests will be difficult to avoid and can lead to K estimates that are significantly lower than the actual hydraulic conductivity of the aquifer. However, considerable attention was paid to well development in this work, so the tabulated hydraulic conductivity values should be reasonable estimates of the hydraulic conductivity of the aquifer in the vicinity of the test wells.
| Well Name |
Test Date | Theoretical Model |
Hydraulic Conductivity (feet/day) |
|---|---|---|---|
| Clay Center | 10/17/02 | High-K Hvorslev | 506 |
| Morganville | 10/17/02 | High-K Bouwer and Rice | 565 |
| Clifton 10/17/02 | High-K Hvorslev | 160-184 |
Butler, J.J., Jr., 1998, The Design, Performance, and Analysis of Slug Tests: Lewis Publishers.
Butler, J.J., Jr., and Garnett, E.J., 2000. Simple procedures for analysis of slug tests in formations of high hydraulic conductivity using spreadsheet and scientific graphics software: Kansas Geol. Survey, Open-File Rept. 2000-40. [available online]
Butler, J.J., Jr., McElwee, C.D., and Liu, W.Z., 1996, Improving the reliability of parameter estimates obtained from slug tests: Ground Water 34, no. 3: 480-490.
Fetter, C.W., 2001, Applied Hydrogeology (4th Edition). Prentice Hall.
HydroSOLVE, Inc., 2001, AQTESOLV for Windows User's Guide.
Springer, R.K., and Gelhar, L.W., 1991, Characterization of large-scale aquifer heterogeneity in glacial outwash by analysis of slug tests with oscillatory response, Cape Cod, MA: U.S. Geol. Survey, Water Res. Invest. Rep. 91-4034: 36-40.
Well diagram, Clay Center observation well.
Well diagram, Morganville observation well.
Well diagram, Clifton observation well.
WWC-5 record, Clay Center observation well. Available in Survey's WWC5 database.
WWC-5 record, Morganville observation well. Available in Survey's WWC5 database.
WWC-5 record, Clifton observation well. Available in Survey's WWC5 database.
Kansas Geological Survey, Geohydrology
Placed online Feb. 13, 2006, original report dated Feb. 2003
Comments to webadmin@kgs.ku.edu
The URL for this page is http://www.kgs.ku.edu/Hydro/Publications/2003/OFR03_12/index.html