Kansas Geological Survey, Open-file Report 2001-16
by
C. D. McElwee
Prepared for Presentation at
Spring AGU Meeting, Boston, MA
June 30, 2001
KGS Open-file Report 2001-16
One of the most important activities in characterizing a groundwater site involves the determination of the hydraulic conductivity distribution. Many methods have been used and current research continues to investigate promising techniques. Slug tests have been used for many years in this regard. Over the last several years we have been conducting research on improving the slug test method. Most of our work has been done in a semi-confined alluvial aquifer with potentially high values of hydraulic conductivity. It has been necessary to use a nonlinear model for the slug test analyses, which covers the range from underdamped to overdamped responses. Multilevel slug tests in fully screened wells have yielded vertical profiles of hydraulic conductivity with depth. It has been found that decreasing the slugged interval can give finer resolution for the hydraulic conductivity profile. Generally, we have found that storage effects are not too important at our site and a Hvorslev type description of the aquifer is appropriate.
Using the nonlinear model with the Hvorslev approximation to analyze the multilevel slug test data has shown the presence of various layers with substantial contrast in hydraulic conductivity. The Hvorslev shape factor expression was originally derived for a homogeneous hydraulic conductivity and for a semi-ellipsoidal casing. This means that error is being introduced by using the traditional Hvorslev shape factor. Since the analyzed data show a variation in hydraulic conductivity with depth, it would be desirable to correct for this heterogeneity.
A numerical radial model has been used, which allows a heterogeneous hydraulic conductivity and a circular casing, to calculate the correct Hvorslev shape factor for various boundary conditions. It is found that the Hvorslev shape factor near the center of the aquifer for a homogeneous hydraulic conductivity is accurate within a few percent. In the same manner, the Hvorslev suggested correction for anisotropy is found to be accurate within a few percent for a homogeneous hydraulic conductivity. Having verified the agreement of the numerical model with the traditional Hvorslev results, the model was applied to correct for heterogeneities and proximity to boundaries. The numerical model has been applied to correct some of the vertical profile data taken at a field site. In general, it is found that the correction sharpens peaks and valleys in the hydraulic conductivity distribution, apparently correcting for some of the averaging that has occurred in the field data. Overall the correction for the data has not been large, on the order of plus or minus 15 percent. However, for very large variations in hydraulic conductivity or as various boundaries are approached with the slugged interval, the correction may become much larger.
One of the most important activities in characterizing a groundwater site involves the determination of the hydraulic conductivity distribution. Many methods have been used and current research continues to investigate promising techniques. Slug tests have been used for many years in this regard. Over the last several years we have been conducting research on improving the slug test method. Most of our work has been done in a semiconfined alluvial aquifer with potentially high values of hydraulic conductivity. It has been necessary to use a nonlinear model (McElwee and Zenner, 1998; McElwee, 2000) for the slug test analyses, which covers the range from underdamped to overdamped responses. Multilevel slug tests in fully screened wells have yielded vertical profiles of hydraulic conductivity with depth. It has been found that decreasing the slugged interval can give finer resolution for the hydraulic conductivity profile. Generally, we have found that storage effects are not too important at our site and a Hvorslev type description of the aquifer is appropriate.
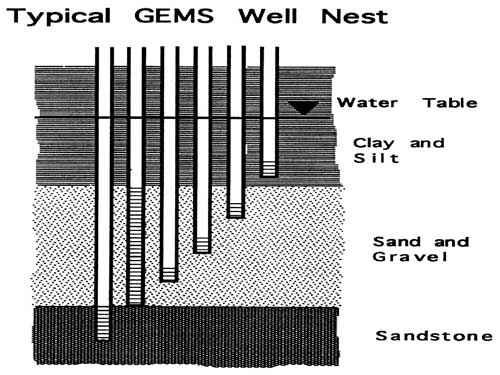
A field site, GEMS, in the Kansas River alluvium (coarse sand and gravel overlain by silt and clay) exhibits very high conductivities and nonlinear behavior for slug tests in the sand and gravel region. It is known from extensive drilling, sampling, and a tracer test that the hydraulic conductivity varies a great deal spatially. Over 70 wells have been completed at various depths. Slug tests have been performed in wells that are completed in the sand and gravel interval using a packer system with a piston for slug test initiation, allowing accurate determination of the initial head and starting time for the slug test.
A typical well nest is shown in the next figure. Commonly there is a fully screened well and several wells with short screens completed at various depths. In some nests there may be a well completed into the bedrock.
The GEMS Injection Well has been extensively studied to determine the potential of slug testing to accurately delineate the hydraulic conductivity distribution (McElwee and Zemansky, 1999). Results from a bromide tracer test indicate that there are two zones of considerably higher hydraulic conductivity in the vicinity of this well. The first series (4 tests at each location) of multilevel slug tests was performed using a 2 foot slugged interval (17 locations) and each suite of 4 tests was analyzed simultaneously with the nonlinear model. The analysis results (shown below) do indicate the presence of two zones of higher hydraulic conductivity. A second series (4 tests at each location) of multilevel slug tests was performed using a 1 foot slugged interval (34 locations) to see if more detail in the hydraulic conductivity distribution could be seen. Finally, a third series was used to test the region around one peak, using a 0.5 foot interval. The results of all these tests and analyses are shown below, along with the screen average calculated from a suite of slug tests over the entire screen length.
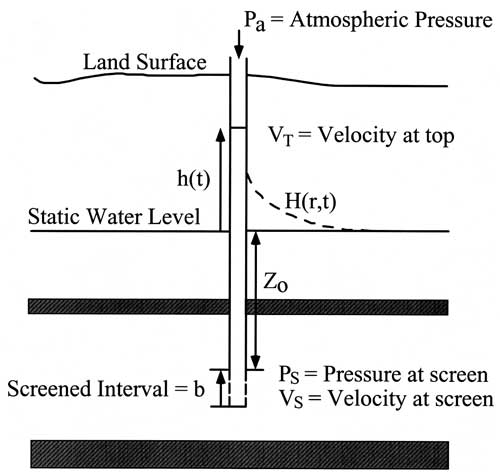
The Hvorslev shape factor expression (F) connecting the water flux (Q), the hydraulic conductivity (K), and the head (H) in the slugged well
Q = FKH
was originally derived (Hvorslev, 1951) for a homogeneous hydraulic conductivity and for a semi-ellipsoidal casing. This means that error is being introduced by using the traditional Hvorslev shape factor. Since the analyzed data show a variation in hydraulic conductivity with depth, it would be desirable to correct for this heterogeneity. A numerical radial model has been used, which allows a heterogeneous hydraulic conductivity and a circular casing, to calculate a corrected Hvorslev shape factor for various boundary conditions.
It is found that the Hvorslev shape factor near the center of the aquifer for an isotropic homogeneous hydraulic conductivity is accurate within a few percent. For example, using a model with 36 nodes in the x and z directions, a casing diameter of 2 inches, an outer radius of 1000 feet, a screen length of 2 feet, and a vertical aquifer thickness of 35 feet gives a value for F = 4.06 at the center of the z dimension. This is to be compared with the traditional infinite Hvorslev model which gives F = 3.95, corresponding to a 2.8% difference. In a similar manner, the Hvorslev suggested correction for anisotropy is found to be accurate within a few percent for a homogeneous hydraulic conductivity. Using the same numerical model, but with an anisotropy ratio of 1000, results in F = 1.93 as compared to the traditional anisotropic Hvorslev result of 1.90, which results in a 1.78% difference.
Having verified the agreement of the numerical model with the traditional Hvorslev results, the model was applied to correct for proximity to boundaries. Using the same isotropic numerical model as presented in the previous section, the effect of moving the slugged interval closer to the upper boundary was investigated. In the traditional Hvorslev model the upper boundary is far from the location of the screen, however, he presents a special case where the screen is adjacent to a barrier boundary. This is the semi-infinite Hvorslev model.
In the case of the top boundary being a barrier boundary, it is found for this numerical model that F = 3.65 when the screened interval is very near the boundary. This is to be contrasted to the infinite Hvorslev model value for F = 3.95, giving a -7.64% difference. For the semi-infinite Hvorslev model the value for F = 3.246, which gives a 12.4% difference.
The next situation that was investigated involved the top boundary being a constant head boundary. Using the same numerical model as before the calculated value was F = 4.52 when the screened interval was very close to the boundary. Comparing this to the infinite Hvorslev model result of F = 3.95 shows there is a 14.4% difference.
Since the calculated F values for the numerical model are different from the Hvorslev model values for F, the hydraulic conductivity estimated by the traditional Hvorslev method will be in error. However, for the model presented here the errors are generally small being in the ±15 % range, as shown above. In general, the traditional Hvorslev method will overestimate the hydraulic conductivity near a constant head boundary and underestimate it near a barrier boundary. This is consistent with the results of others (Hyder et al., 1994; Butler et al., 1994).
The multilevel slug test data shown earlier indicates that there is considerable vertical heterogeneity at the field site. The data presented earlier were analyzed with the traditional Hvorslev model. Since the Hvorslev model assumes homogeneity, it is expected that errors will be introduced with that simplified analysis. The numerical mathematical model presented here allows the effects of heterogeneity and anisotropy on the shape factor F to be calculated. Therefore, the analysis of the field data can be corrected in an iterative fashion. First, the hydraulic conductivity distribution obtained by the traditional Hvorslev model is input to the numerical model and new F values are calculated for each vertical slug test position. Second, the hydraulic conductivity values are updated based on the new F values. Third, the new hydraulic conductivity values are input to the numerical model for an additional iteration on the F values. This procedure can be continued until further iterations produce little change in the F factors and the hydraulic conductivity distribution. At that point the data has been corrected both for heterogeneity and for boundary effects, if the boundary conditions are known.
The multilevel slug test data previously shown for a 2 foot slugged interval was corrected for heterogeneity by applying the procedure j*ust described. The numerical model was used to calculate corrected F factors and thus corrected hydraulic conductivity values for two iterations. The largest corrections were in the range of +6% to - 12% cumulative for the two iterations. Most of the correction occurs in the first application of the numerical model. Generally, the corrections for the second iteration were about an order of magnitude smaller than for the first iteration, and were about I% or less. The results are shown graphically below. The corrections are not too dramatic but generally sharpen the peaks and valleys of the hydraulic conductivity distribution.
The multilevel slug test data for a 1 foot slugged interval was also corrected for heterogeneity by applying the iterative procedure using the numerical model. Two iterations were performed. The largest cumulative correction was about 13%. In this data set the peaks of the hydraulic conductivity distribution were heightened considerably. As before most of the correction occurs in the first iteration, with the corrections for the second iteration being about 1% or less. The correction is much more dramatic on this data set than for the 2 foot interval data. This is consistent with the results of Hyder et al.(1994) regarding the effect of the aspect ratio (the screened length divided by the casing radius).
Using a nonlinear model with the Hvorslev approximation to analyze the multilevel slug test data has shown the presence of various layers with substantial contrast in hydraulic conductivity. The Hvorslev shape factor expression was originally derived for a homogeneous hydraulic conductivity and for a semi-ellipsoidal casing. This means that error is being introduced by using the traditional Hvorslev shape factor. Since the analyzed data show a variation in hydraulic conductivity with depth, it would be desirable to correct for this heterogeneity. A numerical radial model has been used, which allows a heterogeneous hydraulic conductivity and a circular casing, to calculate the correct Hvorslev shape factor for various boundary conditions. It is found that the Hvorslev shape factor near the center of the aquifer for a homogeneous hydraulic conductivity is accurate within a few percent. In the same manner, the Hvorslev suggested correction for anisotropy is found to be accurate within a few percent for a homogeneous hydraulic conductivity. Having verified the agreement of the numerical model with the traditional Hvorslev results, the model was applied to correct for heterogeneities and proximity to boundaries. The numerical model has been applied to correct some vertical profile data collected at GEMS. In general, it is found that the correction sharpens peaks and valleys in the hydraulic conductivity distribution, apparently correcting for some of the averaging that has occurred in the field data. Overall the correction for the data has not been large, on the order of plus or minus 15 percent. However, for very large variations in hydraulic conductivity or as various boundaries are approached with the slugged interval, the correction may become much larger.
Kansas Geological Survey, Geohydrology
Placed online Sept. 20, 2007, original report dated June 2001
Comments to webadmin@kgs.ku.edu
The URL for this page is http://www.kgs.ku.edu/Hydro/Publications/2001/OFR01_16/index.html