Kansas Geological Survey, Open-file Report 2000-74
by
Margaret Townsend
January 2001
KGS Open-file Report 2000-74
A site visit was made in July 2000 to each of four wells that were selected by personnel at the city of Wichita. Land use was noted for each site.
Water samples were collected for complete analyses by the city of Wichita and for nitrogen-15 analysis by Dr. Stephen Macko at the Department of Environmental Science at the University of Virginia. Samples were collected after both the temperature and the specific conductance stabilized after three readings. The wells were turned on for at least 5 minutes prior to sampling. Analytical methods used by the city of Wichita are in accordance with U.S. EPA standard methods.
Samples were collected for both Wichita and KGS analyses. KGS samples for each well were collected in a 500-ml unacidified polyethylene bottle, a 200-ml polyethylene bottle acidified with 2-ml 6M HCI, and a 125-ml polyethylene bottle for the nitrogen-15 isotope sample. The samples were iced and cooled until analyzed at the water-chemistry laboratories.
Samples for Wichita were collected in gallon jug containers that were unacidified. Samples were stored on ice until returned to the laboratory on the same day as collected.
Nitrogen-15 isotope samples were sent to the University of Virginia for analysis. Samples were frozen and sent on ice by Federal Express to the laboratory. Samples were thawed and a known aliquot of sample was dried and the residue burned to determine the nitrogen-15 ratio with a known standard (air). Results are reported in per mil units (‰) which is equivalent to parts per thousand. Values are reported as enriched (+, > 0) or depleted (-, < 0).
Additional data were collected from various sources such as the National Resources and Conservation Services soils database in Lincoln, Nebraska (USDA, NRCS, 2001), the county soil survey for Sedgwick County, past chemical analyses for the Wichita wells provided to the KGS by the city of Wichita, and ground-water elevation data from the annual water-level measuring program and soils maps from the NRCS SURGO soils database at the KGS. Topographic maps were obtained from the U.S. Geological Survey topographic map database at the KGS (DASC, 1997).
The study site is located in Sedgwick County, Kansas, Secs. 7 and 18, T. 25 S., R. 1 W. and Sec. 5,T. 25 S., R. 2 W. (fig. 1A). The area is in the Arkansas River Lowlands section of the Central Lowland physiographic region of the state (Schoewe, 1949). The area is nearly flat with little topographic variation (fig. 1B and C).
Figure 1A. Location of Sedgwick County in south-central Kansas.
Figure 1B. Location of Wichita wells #35 and #38 on topographic map of area.
Figure 1C. Location map of Wichita wells #53 and #55 on topographic map of area.
This area is west-southwest of the Little Arkansas River. The wells are located in unconsolidated deposits of silts, clays, and fine to coarse sands of Pleistocene age overlying bedrock of Permian age (Lane and Miller, 1965). The wells range from 47 to 130 feet in depth.
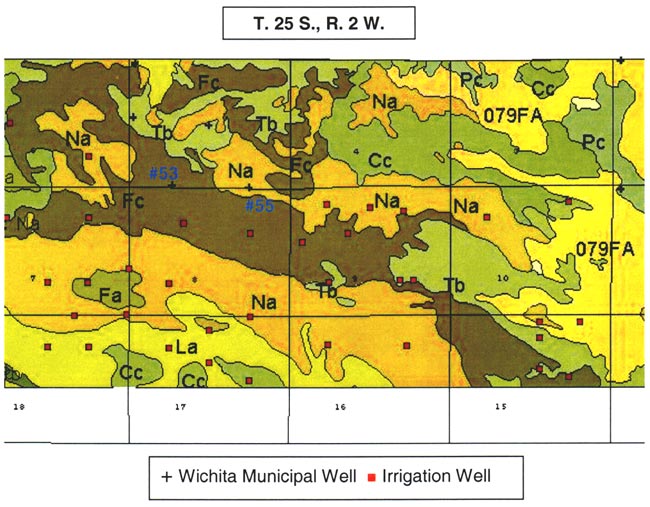
The major soils in the area are Carwile, Naron, and Farnum series (figs. 2 and 3). The soil profiles shown in figures 4A-E are from pit descriptions that were done in Reno County, Kansas. The general characteristics of the soils are presumed to be similar to those in Sedgwick County. The Farnum and Naron soils show predominantly sandy profiles with varying thickness of silt and clay occurring throughout the profile. The Carwile soil has a sandy zone near the surface and at depth with an intermediate zone of silt and clay. The overall characteristic of these soils is the high permeability throughout the profile which suggests rapid recharge would occur in areas with these soils.
Figure 2. Soils and wells in T. 25 S., R. 1 W., sections 7 and 18. Note location of wells #35 and #38 in Naron (Na), Farnum (FA) and Carwile (Cc) soils. Soil properties shown in figs. 4A-E.
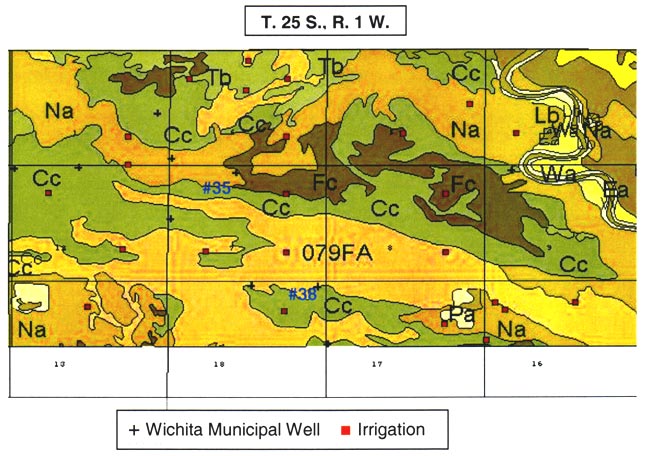
Figure 3. Soils and wells in T. 25 S., R. 2 W., Sec 5. Note location of wells #53 and #55 in Naron (Na) and Farnum (Fc) soils. Size analyses for soils shown in figs. 4A-E.
Figures 4A-4E show the particle-size distribution for Naron, Farnum, and Carwile soils from soil pit locations in Reno County, Kansas. No data on particle size were available for these soils for Sedgwick County. The particle-size distribution graphs generally indicate a permeable unsaturated zone. The Naron and Farnum soils in particular are characterized as well drained and are located in terrace positions above floodplain soils. The Carwile soils are somewhat poorly drained with a seasonal high water table (USDA, SCS, 1975).
Figure 4A. Size-fraction distribution of Naron soil. Note high percentage of sand throughout the profile. Data are from soil site S58KS-155-001 in Reno County, Kansas (USDA, NRCS, 2001).
Figure 4B. Size-fraction distribution of Farnum soil. Note high percentage of sand and silt throughout the profile. Data are from soil site S58KS-155-009 in Reno County, Kansas (USDA, NRCS, 2001).
Figure 4C. Size-fraction distribution of Farnum soil. Note high percentage of sand and silt throughout the profile. Data are from soil site S58KS-155-005 in Reno County, Kansas (USDA, NRCS, 2001).
Figure 4D. Size-fraction distribution of Farnum soil. Note high percentage of sand throughout the profile. Data are from soil site S96KS-155-415 in Reno County, Kansas (USDA, NRCS, 2001).
Figure 4E. Size-fraction distribution of Carwile soil. Note variable percentage of sand and silt throughout the profile. Data are from soil site S58KS-155-010 in Reno County, Kansas (USDA, NRCS, 2001).
Land use surrounding each of the sampled municipal wells is summarized in table 1. In general, the area directly surrounding each well was dry-land farmed sorghum or wheat with irrigated farming occurring within close proximity to the well. Near several of the sites, new housing was located that was only several years old. At one of the sites, CRP land had recently been put back into production. Near one of the wells are two closed poultry-raising facilities.
On a county basis, approximately 84% of the land is farmed (PRI, 1999). Farming has been long established in the county as is shown in figure 5. The figure shows the amount of nitrogen fertilizer sold, cumulative water rights issued, and the number of water rights used for either irrigation or municipal water supply (KDA, DWR, 2000; KDA, Pesticide and Fertilizer Div., 2000). The figures are a rough estimate of the amount of fertilizer that could be applied as well as the number of irrigated farming sites in the county. Both irrigated and dry land farming can supply nitrogen to the ground-water system. In general, though, dry-land farming uses a smaller fertilizer application than irrigated farming uses. The exception is the legume crops which usually require a minimal starter fertilizer application and then produce their own nitrogen.
Table 1. Land use near sampled Wichita municipal wells.
| Well Number |
Soil Type | Farming | Crops | Other Land Use |
|---|---|---|---|---|
| 35 | Naron | Dry Land | Sorghum | CRP land to hay |
| Farnum | Wheat | Dry Land | Closed chicken farm to north | |
| Farnum | Irrigation | Corn | Closed turkey farm NW about 1/2 to 1 mile | |
| 38 | Farnum | Dry Land | Wheat | New housing development 1 mile west |
| Carwile | Dry Land | Milo | ||
| Carwile | Irrigation | Soybeans | ||
| 53 | Farnum | Dry Land | Sorghum | New houses to south of well |
| Farnum | Dry Land | Wheat | ||
| 55 | Naron | Dry Land | Sorghum | |
| Naron | Irrigation | Soybeans |
Figure 5. Total nitrogen fertilizer sold and cumulative water rights, irrigation water rights, and municipal water rights for Sedgwick County, 1948-2000.
The principal source of fresh and usable water in the study area is the Equus Beds aquifer. The Equus Beds aquifer is part of the High Plains regional aquifer system (Weeks and Gutentag, 1981; Stulken and others, 1985). Water-level data indicate the aquifer is unconfined.
Average precipitation in the area for the period of time evaluated in this study (1970-1999) is approximately 33 inches per year (PRI, 1999). Most of the rainfall occurs during the growing season from April to September. Rapid infiltration through the soil profile means that any contaminants also will move rapidly from the land surface to the water table.
Ground-water flow is generally to the southwest although the water-table elevation map suggests that portions of the study area are strongly affected by multiple well interference (see wells 53 and 55 for example, fig. 6). Location of fields or housing near the municipal and irrigation wells may result in the movement of contaminants from those areas towards the wells in time of high-stress pumping.
Figure 6. Water-table elevation for study area. Values derived from measurements taken by KGS in 1998 and Wichita well-field personnel in January 2000. Ground-water flow direction is generally to the west and southwest (arrows on figure). Note impact on water-table direction based on location of irrigation wells near municipal wells. Contour interval is 5 ft.
Figure 7 shows depth to water for the study area. The depth to water map was constructed from data collected by the KGS in 1999 (KGS, 2001) and by the city of Wichita in January of 2000. This map shows the potential impact of the location of irrigation wells near the municipal wells in the area. Figures 2 and 3 show the other municipal wells in the area. In general, this area has many wells which pump on a regular schedule, particularly in the summer. This area of high-use pumpage could result in increased movement of agrichemicals used in irrigated farming. The dry-land farming areas could have accumulated agrichemicals in the unsaturated zone that would move when sufficient water is available. The dry-land situation would result in slugs of contaminants reaching the aquifer at irregular times most likely related to major rainfall events. Both situations could result in variable concentrations of agrichemicals in the ground water at the municipal wells. This will be discussed further in the water chemistry section.
Figure 7. Depth to water for irrigation and municipal water wells in and arround study area. Squares are four wells that were tested, triangles are other municipal wells in the area, crosses are irrigation wells in the area. Depth to water data from year 2000 measurements by city of Wichita personnel and 1999-2000 water well report (KGS, 2001). Note variability of depth to water measurements. Contour interval is 2 feet.
The water chemistry in the study area is a calcium-bicarbonate water type (figs. 8A-D). Although increased nitrate-N has been observed in these four wells over time, the nitrate does not appear to be affecting the general water chemistry in terms of changing the water type classification. All four wells show a very similar chemistry profile. Variation in the location of the cluster of data for each well is influenced by rainfall, amount of irrigation in the vicinity of the sampled well, land use, and evapotranspiration effects from both irrigated and dry-land row-crop farming practices.
Figure 8A. Trilinear diagram of water-chemistry analyses for Well #35 from 1972 to 2000. Water is principally a calcium-bicarbonate water type.
Figure 8B. Trilinear diagram of water-chemistry analyses for Well #38 from 1972 to 2000. Water is principally a calcium-bicarbonate water type.
Figure 8C. Trilinear diagram of water-chemistry analyses for Well #53 from 1972 to 2000. Water is principally a calcium-bicarbonate water type.
Figure 8D. Trilinear diagram of water-chemistry analyses for Well #55 from 1972 to 2000. Water is principally a calcium-bicarbonate water type.
The variations of nitrate and chloride values for the four wells sampled in this study are shown in figures 9A-9D. As can be seen nitrate generally increases over time with variable chloride concentration at each of the sites (except for site #55 where both nitrate and chloride increase over time).
Figure 9A. Nitrate-N and chloride concentration for well #35. Note general increase in nitrate over time and the variable chloride concentration. Depth of well is 130 ft.
Figure 9B. Nitrate-N and chloride concentration for well #38. Note general increase in nitrate over time and variable chloride. Chloride appears to decline from 1980s to 1990s. Depth of well is 128 ft.
Figure 9C. Nitrate-N and chloride concentration for well #53. Nitrate-N and chloride are more variable than in wells #35 and #38. Depth of well is 92 ft.
Figure 9D. Note overall increasing trend in nitrate-N and chloride at well #55 site. Depth of well is 47 ft.
Figure 10 shows the increasing specific conductance for all wells during the period of record. Increasing specific conductance in areas with a dense irrigation-well population is a potential indicator that evapotranspiration enrichment is occurring.
Figure 10. Specific conductance measurements for period of record. General increase in conductance over time suggests evapotranspiration enrichment due to long-term farming in the area.
Nitrate-nitrogen, chloride, and depth of well were evaluated to determine if a statistical correlation existed among the three parameters. The Spearman rho non-parametric test for correlation was used in the statistical analysis (SAS, v. 8.0, 1999). Nitrate-nitrogen values for both 1999 and 1996 (years with complete data for most of the well-field wells) showed a significant correlation with depth of sampled well. The 1996 data had a correlation of -0.344 (p=0.0123), and the 1999 data had a correlation value of -0.372 (p=0.011). These rho values are considered significant. The negative correlation indicates decreasing nitrate-N concentration with depth of well (fig. 11).
Figure 11. Regression line for depth of well versus nitrate-N values from 1999 for Wichita well field.
The R2 value of 0.2772 indicates that only 27% of the variation of the regression equation can be explained by the use of just the depth parameter in the equation. This strongly suggests that other factors have a strong impact on the occurrence of nitrate in the ground water. Other studies have indicated that well-construction as well as soil type, depth to water, land use, irrigation well density, crop rotations, and type of farming (irrigated vs. dry land) also influence the occurrence of nitrate in ground water. In this study, these parameters were noted but not statistically evaluated because most of the information was not readily available for all wells.
Nitrogen-15 isotope analysis is a method to assist in determining sources of nitrogen in ground water. The isotope analysis evaluates the ratio of nitrogen-14 (what is present in the air we breathe) to the amount of nitrogen-15 present in the water or whatever is being analyzed. This ratio is compared to a standard based on the ratio of 14N/15N present in air. Comparisons of these values indicates if there is more (positive value +) or less (negative value -) than the standard. Researchers have found that sources of nitrogen in ground water fall into various categories. These are illustrated in figure 12.
Figure 12. Range of nitrogen-15 values and probable sources from multiple studies (adapted from Heaton, 1986).
Values of δ15N that range from negative values up to +8‰ generally indicate sources from atmospheric nitrogen (rain), fertilizer, or soil organic nitrogen (fig. 12). Rainwater has very low nitrogen content as nitrate (N03-N) or ammonium (NH4-N), usually less than 1 or 2 mg/L. Fertilizer and soil organic nitrogen samples are frequently above 2 mg/L nitrate-N, which is considered a "background level" of pristine areas that are not affected by human activities (Mueller and Helsel, 1996). Generally, if fertilizer is a source, the nitrate-N concentration is above 2 mg/L and often over 10 mg/L (drinking-water limit), and the δ15N signature is between +0 and +8‰.
Animal-waste sources have a signature that is generally greater than +10‰. Nitrate-nitrogen concentrations often are above the drinking-water limit of 10 mg/L. Another possibility for an enriched value (greater than +1 O‰) is called denitrification. This occurs when bacteria break down the nitrate-N to nitrogen gas. This process usually results in nitrate-N concentration of below 1 mg/L as well as a high δ15N value (greater than +10‰). The water chemistry is usually reducing in nature and ammonium-N is the dominant form of nitrogen.
Nitrogen-15 was used to determine potential sources for the observed increasing nitrate-nitrogen in water samples from several of the Wichita wells. As previously discussed, the major categories for nitrate sources include fertilizer, animal waste from both human and animal sources, and soil nitrogen. Figure 13 shows the δ15N values for the four samples that were collected. The graph shows that all of the samples fall into the fertilizer category. Evaluation of table 1 shows that most of the wells are surrounded by dry-land farming with some irrigated farming within a 1/4 mile of the city wells. Because of the generally permeable nature of the soil, the vadose zone, and particularly the aquifer, the area around these wells is highly susceptible to potential contamination. Table 2 summarizes the nitrate-N and atrazine values for the fall 1999 sampling and the nitrate-N and nitrogen-15 values for July 2000 in this study. The presence of both atrazine and δ15N values in the fertilizer range for these wells strongly suggests that long-term farming has impacted these wells. As shown in figures 2 and 3, a number of irrigation water rights are present in the vicinity of these city wells. The location of these wells and also the presence of dry-land farming very close to the city wells provide a source for the agrichemicals detected.
Figure 13. Graph shows relation of nitrogen-15 values for samples with measured nitrate-N values. All samples fall within the fertilizer range.
Table 2. Summary of selected water-chemistry data for Wichita wells.
| Well Number |
Nitrate-N (mg/L) Fall 1999 |
Nitrate-N (mg/L) July 2000 |
δ15N ‰ July 2000 |
Atrazine (ppb) Fall 1999 |
Depth (feet) |
|---|---|---|---|---|---|
| #35 | 9.2 | 8.4 | 4.5 | 0.15 | 130 |
| #38 | 10 | 8.9 | 5.0 | 0.11 | 128 |
| #53 | 7.4 | 5.6 | 7.0 | 0.09 | 92 |
| #55 | 11.3 | 9.9 | 5.4 | 0.12 | 47 |
Results from this study indicate that the four Wichita municipal wells that have increasing nitrate-N concentrations are being impacted by longterm dry-land and irrigated farming in the vicinity of the wells. The soils and vadose zone in the area are considered moderately to very permeable with few clay zones of any notable thickness. Depth to water ranges from 16 to 26 feet in the area, indicating a shallow aquifer. Maps of irrigation and municipal wells in the area of study show a fairly dense spacing of wells (figs. 2, 3, and 7). The close proximity of the wells strongly suggests that times of long-term pumping in the spring and summer for irrigation plus the demand for water supply from the Wichita well field would provide multiple sources and pathways for movement of potential contaminants from the land surface to the ground water and into the studied wells.
Nitrogen-15 isotope values from the wells strongly suggest a fertilizer source for the nitrate. Specific conductance values and nitrate-N values show a gradual increase over the period of record (1972-present) suggesting that long-term farming is having an impact. The detection of atrazine in the four municipal wells in the fall 1999 sampling by the city of Wichita only supports the likelihood that row crop agriculture is a major contributor to the observed increasing nitrate.
The highest nitrate and specific conductance were observed in wells #53 and #55, which are the shallower of the four wells (92 and 47 feet deep, respectively). Wells #35 and #38, although showing nitrate increases, are not at the levels found in the other two wells.
1. Additional collection of water samples in the spring 2001 to try to verify the fertilizer source for nitrate near the time of application.
2. Evaluation of the city policy to permit farming within close proximity of the affected wells, particularly the two shallower wells.
3. Continued testing for atrazine as well as nitrate to try to determine the effect of agricultural chemicals on the water quality of the Wichita well field. Some of the other wells not tested in this study showed atrazine in the fall 1999 sampling. Land-use practices around these wells probably should be modified also to prevent further potential degradation of the city's water source.
Data Access Support Center, 1997, Digital Raster Graphic-Lambert (DRG-Lam) U.S. Geological Survey topographic maps, 1:24,000, http://www.kansasgis.org/.
Heaton, T. H. E., 1986, Isotopic studies of nitrogen pollution in the hydrosphere and atmosphere: a review: Chemical Geology (Isotope Geoscience Section), v. 59, p.87-102.
Kansas Department of Agriculture, Division of Water Resources, 2000, Water Information Management and Analysis System (WIMAS), http://hercules.kgs.ku.edu/geohydro/wimas/index.cfm.
Kansas Department of Agriculture, Division of Inspections, 2000, Fertilizer tonnage reports 1948-1999 paper copies. Year 2000 records pesticide and fertilizer division, http://www.ksda.gov/.
Kansas Geological Survey, 2001, Wizard water well search form, http://www.kgs.ku.edu/Magellan/WaterLevels/index.html.
Lane, C. W. and Miller, D. E., 1965, Geohydrology of Sedgwick County, Kansas: Kansas Geological Survey Bulletin 176, 100 p. [available online]
Mueller, D. K. and Helsel, D. R., 1996, Nutrients in the nation's waters--too much of a good thing?: U. S. Geol. Survey, Circ. 1136, 24 p. [available online]
Policy Research Institute, University of Kansas, 1999,The Kansas Statistical Abstract, 34th Edition, tables, http://www.ipsr.ku.edu/.
SAS Institute Inc., 1999., SAS Online Doc v.8: Cary, NC.
Schoewe, W. H., 1949, The geography of Kansas, part 2--Physical geography: Transactions of the Kansas Academy of Sciences, v. 52, no. 3, p. 261 333.
Stullken, L. E.; Watts, K. R.; and Lindgren, R. J., 1985, Geohydrology of the High Plains aquifer, western Kansas: U.S. Geological Survey, Water-resources Investigations no. 85-4198, 86 pages [available online]
U.S. Department of Agriculture, Natural Resources Conservation Service, 2001, Online soils data base, http://soils.usda.gov/.
U.S. Department of Agriculture, Natural Resources Conservation Service, 1998, Soils Survey Geographic Database, SSURGO Maps in ARC/INFO, http://www.kansasgis.org/.
U. S. Department of Agriculture, Soil Conservation Service, 1975, Soil survey of Sedgwick County, Kansas, 126 p.
Weeks, J. B.; and Gutentag, E. D., 1981, Bedrock geology, altitude of base, and 1980 saturated thickness of the High Plains aquifer in parts of Colorado, Kansas, Nebraska, New Mexico, Oklahoma, South Dakota, Texas, and Wyoming: U.S. Geological Survey, Hydrologic Investigations Atlas HA-0648, 2 sheets, scale 1:2,500,000. [available online]
Kansas Geological Survey, Geohydrology
Placed online Nov. 13, 2007, original report dated Jan. 2001
Comments to webadmin@kgs.ku.edu
The URL for this page is http://www.kgs.ku.edu/Hydro/Publications/2001/OFR00_74/index.html