Kansas Geological Survey, Open-file Report 98-6
In cooperation with the Kansas Water Office
KGS Open File Report 98-6
May 1998
The complete report is available as an Adobe Acrobat PDF file (1.5 MB). Plates available separately.
The authors of this report wish to thank the Kansas Water Office for their support and interest in this work, and the Kansas Data Access and Support Center (DASC) for their assistance in providing the digital information used as input to the procedures described in this report. We also wish to acknowledge the United States Department of Agriculture's Natural Resource Conservation Service who created the database and documentation upon which this work is based.
The textural classification scheme described in this report was designed to depict general patterns of surface soil texture on basin scale soil maps, and to indicate relative differences in expected initial infiltration and permeability based on the simple assumption that fine textured soils will be less permeable than coarse textured soils. The classification scheme is not intended to supplant soil permeability data available in the STATSGO database, and is not intended for use at map scales larger than 1:500,000. Site specific information regarding soils should always be taken from more detailed soil maps (1:24,000). It is also advisable to field check soils at specific study sites with a trained soil scientist. The Kansas Geological Survey disclaims any responsibility or liability for interpretations or decisions based on the contents of this report.
The following persons have reviewed this document:
Two types of digital spatial soils data are currently available from the Data Access and Support Center (DASC) at the Kansas Geological Survey. The State Soil Geographic data base (STATSGO1) was created by the National Resource Conservation Service by generalizing existing county soil survey data. STATSGO is intended for use as a planning and management tool at the state, regional, or multi-state scale (USDA, 1994). Spatial soil information for use at larger map scales is available as detailed 1:24,000 soils data. The detailed 1:24,000 soils data represent electronic versions of county soil surveys which have been digitized and tiled by USGS 7.5 minute topographic quadrangle. The more detailed digital soils maps and associated data were designed for use at the farm to county scales.
(1 STATSGO database item names are enclosed in square brackets [] in this document.)
In this project, the STATSGO database was used to depict general patterns of surface soil texture in the Kansas and Lower Republican River Basins in northeast Kansas. The study area covered all or parts of 25 counties and extends from the eastern border of Kansas approximately 200 miles west to Smith County in north-central Kansas. The goal of the project was to provide a drainage-basin scale map of surface soil texture that could be used by the Kansas Water Office for planning purposes. (Plate A)
There are a number of logistical problems associated with creating a soil interpretation map that covers a very large area such as this. First, although the STATSGO database is generalized and intended for use at this scale, there are still 65 individual soil map unit names in the study area (Plate B). In order to visually differentiate between individual map units it would be necessary to assign a unique color or pattern for each individual map unit, and it is difficult to select 65 colors or patterns which are easily distinguishable from each other. Second, each STATSGO map unit contains from 3 to 21 component soils. The map unit interpretation database contains a number of properties for each component soil including texture, clay content, bulk density, and permeability. Each component soil may have multiple layers in the database which represent properties for individual horizons2 or groups of horizons for each component soil. For this study, it was necessary to select a single soil property and use it to group STATSGO map units with similar properties in order to portray them legibly on a map.
(2 "A soil horizon is a layer, approximately parallel to the surface of the soil, distinguishable from adjacent layers by distinctive set of properties produced by soil-forming processes." (Soil Survey Division Staff, 1993, p. 60). The layers in the database contain the soil property information tor each horizon or group of horizons described for each component soil.)
The soil textural class of the surface soil horizon was the soil property chosen for the map. Texture is a soil property with which scientists and planners from different academic and professional backgrounds are familiar, and it can be used to infer a number of soil characteristics. For instance, soil texture combined with bulk density can be used to help place soils into their appropriate permeability classes (Rawls and Brakensiek, 1983; Soil Survey Staff, 1993). Since soil texture influences permeability, it also provides some information about the expected infiltration rate of a soil, the amount of runoff that may be generated from a soil, how much erosion might occur from a given soil, or possibly how much recharge to ground water might be expected through the soil. However, a number of other factors including permeability, antecedent moisture content of the soil, subsurface soil properties, ground cover, slope, rainfall rate, and rainfall duration would actually be needed to estimate anyone of these processes accurately.
Surface soil texture can also provide some information about the parent material of the soil, which in turn may provide some indication of subsurface soil properties that might influence the processes mentioned above. For example, many soils that are formed in loess have silt loam (SiL) surface textures with increases in clay content within the subsoil, resulting in subsurface textures of silty clay loam (SiCL) or silty clay (SiC). If a soil has a silt loam surface texture and is located within an area with thick deposits of loess, we could infer that the subsoil is likely to have a higher clay content than the surface soil horizon; however, the surface soil texture is not always a reliable predictor of subsurface soil properties. Many soils in Kansas include multiple parent materials and multiple periods of soil genesis, so subsurface soil texture can be very different than what might be expected based on surface texture. For example, there are soils in south-central Kansas with surface textures of fine sandy loam (FSL) or loamy fine sand (LFS) with subsurface textures of silty clay (SiC), or silty clay loam (SiCL).
It is important to understand the limitations that should be placed on interpretations made from surface soil texture. While soil texture is a useful property, it is not permeability or infiltration capacity, and interpretations regarding these properties should be made with caution. Site-specific information regarding these and other soil properties should be taken directly from the detailed 1:24,000 soils database. It is also advisable to field check sites of particular interest with local NRCS personnel.
Soil textures shown on the map (Plate A) are for the surface soils. In most cases, the surface soil horizons are only 4 to 12 inches thick. Inferences about subsurface soil properties based on surface soil textures should be made with caution. Subsurface soil properties, such as the least permeable soil horizon, strongly influence the rate of water movement through the soil profile. Subsurface properties are essential for quantifying the drainage characteristics of a soil and strongly influence infiltration, runoff, and recharge.
The classification scheme used for this map was designed to provide a standardized method of classifying soil map units based on surface soil texture to depict general soil cover patterns and to infer relative differences in expected initial infiltration and permeability at the regional or drainage basin scale. It is not intended nor is it appropriate for use at larger scales.
The classification scheme was designed to show relative differences and not quantitative differences in expected permeability. For example, assuming all other factors are equal, a soil with a surface texture of Silty Clay (SiC) would be expected to allow water to infiltrate more slowly than a soil with a Loam (L) surface texture. In a general sense this is true, but many of the textural classes are quite broad in terms of the actual ranges in sand, silt, and clay content. The actual difference in infiltration rate or permeability between classes might be negligible (less than a factor of 2) or very significant (greater than a factor of 10). It is important to remember that a number of other factors besides texture can strongly influence permeability and infiltration rate.
Many authors have noted that a general relationship exists between certain particle size parameters (e.g. clay content, textural class, geometric mean and median particle size, etc.) and soil hydraulic properties (e.g. permeability, moisture retention, etc). Some of these relationships are only valid for narrow ranges in textures. Most of the predictive models based on these relationships tend to estimate hydraulic properties reasonably well for the particular soils or sediments for which they were developed. The magnitude of prediction errors based on these methods tends to increase as they are applied to soils and sediments with physical properties outside of the ranges used to develop the models (Hazen, 1892; Slichter, 1899; Terzaghi, 1925; Hulbert and Feben, 1933; Fair and Hatch, 1933; Mason et al. 1957, Bloemen, 1980; Rawls and Brakensiek, 1983; Cosby et al., 1984; Brakensiek, 1984; Campbell 1985; Saxton et al., 1986; Shepherd, 1989; Vereecken et al., 1990; Peterson and Power, 1991; Alyamani and Sen, 1993; Rawls, et. al., 1993; Sperry and Peirce, 1995, Tietje and Hennings, 1996).
The first step in the classification scheme is to assign integer scores to the 12 textural classes and 9 subclasses used by National Resource Conservation Service (NRCS, table 1). In general, sand content decreases, clay content increases, and median particle size3 decreases as the score decreases from 21 to 1. The principal assumption is that permeability will decrease as the score decreases. Differences in clay content and median particle size between textural classes are sometimes obvious while in other cases they are minimal. For example, a silty clay (SiC) obviously has a higher clay content and smaller median particle size than a coarse sand (CoS) would have, but a silt loam (SiL) and a loam (L) could have identical clay contents (Figure 1) and fairly minimal differences in median particle size. The scores for individual map unit components were based on average values of sand, silt, and clay content for each textural class or subclass, and not on actual sand, silt, and clay contents for individual soils in the database. In other words, a silt loam is always given a score of 8 even though its clay content could vary from 0 to 27% and its sand content could vary from 0 to 50% (Figure 1). It should be noted that differences in sand, silt, and clay content between soils within the same textural class could result in significant differences in soil hydraulic properties within individual textural classes.
(3 Median particle size is the point on a particle size distribution curve which corresponds to the grain size at which 50 percent of the material in the sample being analyzed is finer (smaller in diameter) and 50 percent is coarser.)
Table 1--Textural classes and subclasses used by USDA (Soil Survey Division Staff, 1993) and scores assigned to them in this project.
| Score | Texture Name | Texture Abbreviation |
|---|---|---|
| 21 | Coarse Sand | CoS |
| 20 | Sand | S |
| 19 | Fine Sand | FS |
| 18 | Very Fine Sand | VFS |
| 17 | Loamy Coarse Sand | LCoS |
| 16 | Loamy Sand | LS |
| 15 | Loamy Fine Sand | LFS |
| 14 | Loamy Very Fine Sand | LVFS |
| 13 | Coarse Sandy Loam | CoSL |
| 12 | Sandy Loam | SL |
| 11 | Fine Sandy Loam | FSL |
| 10 | Very Fine Sandy Loam | VFSL |
| 9 | Loam | L |
| 8 | Silt Loam | SiL |
| 7 | Silt | Si |
| 6 | Sandy Clay Loam | SCL |
| 5 | Clay Loam | CL |
| 4 | Silty Clay Loam | SiCL |
| 3 | Sandy Clay | SC |
| 2 | Silty Clay | SiC |
| 1 | Clay | C |
Figure 1--Textural triangle from the Soil Survey Manual (pg. 138) by Soil Survey Division Staff (1993) U.S. Department of Agriculture.
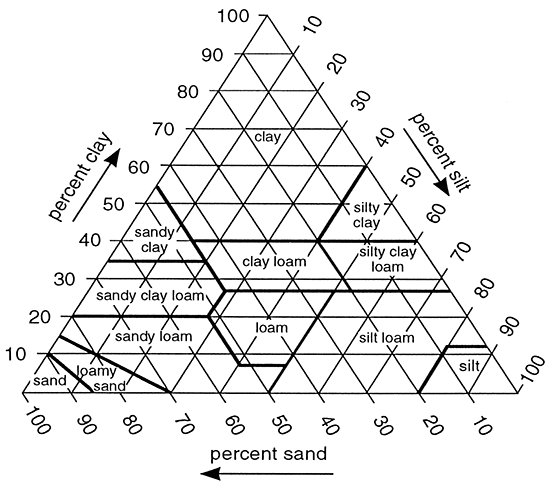
Not all of the textural subclasses in Table 1 are included in Figure 1. The subclasses of sands, loamy sands, and sandy loams are based on the dominant sand grain size in the soils. For instance the sand textural class has "More than 85 percent sand… " and " …the percentage of silt plus 1.5 times the percentage of clay is less than 15." (Soil Survey Division Staff, 1993 pg. 137), but sands are divided into four subclasses based on the relative amounts of coarse, medium, fine, and very fine sand particle separates as defined in Table 2. Descriptions of the criteria used to subdivide sands, loamy sands, and sandy loams are included in Table 3.
Placement in textural classes is based on the particle size fractions which are smaller than two millimeters (i.e. very coarse sand or smaller). The presence of larger particles is indicated by the addition of a modifier indicating that larger material is present in the soil. For example, if 15 to 35 percent of the whole soil is composed of rock fragments with diameters between 2 and 75 millimeters, the modifier gravelly is added to the texture, thus a loam becomes a gravelly loam. Such modifiers were not formally included in the classification scheme, but informally the presence of rock fragments were assumed to indicate an increase in permeability and these textures were scored accordingly within their particular textural class.
Table 2--Soil separates or grain size classes as defined by the United States Department of Agriculture (Soil Survey Division Staff, 1993)
| Descriptive Class | Size Classes (in millimeters) |
|---|---|
| Boulders | >600 |
| Stones | 250-600 |
| Cobbles | 75-250 |
| Coarse gravel | 20-75 |
| Medium gravel | 5-20 |
| Fine gravel | 2-5 |
| Very coarse sand | 2.0-1.0 |
| Coarse sand | 1.0-0.5 |
| Medium sand | 0.5-0.25 |
| Fine sand | 0.25-0.10 |
| Very fine sand | 0.10-0.05 |
| Silt | 0.05-0.002 |
| Clay | <0.002 |
Table 3--Criteria for subdividing sands, loamy sands, and sandy loams from Soil Survey Manual (Soil Survey Division Staff, 1993)
| Texture | Description | |
|---|---|---|
| Sands | Contain more than 85 percent sand, and the percentage of silt plus 1.5 times the percentage of clay is less than 15 percent | |
| Coarse sand | A total of 25 percent or more very coarse and coarse sand and less than 50 percent any other single grade of sand. | |
| Sand | A total of 25 percent or more very coarse, coarse, and medium sand, a total less than 25 percent very coarse and coarse sand, and less than 50 percent fine sand and less than 50 percent very fine sand. | |
| Fine sand | 50 percent or more fine sand, or a total of less than 25 percent very coarse, coarse, and medium sand and less than 50 percent very fine sand. | |
| Very fine sand | 50 percent or more very fine sand | |
| Loamy Sands | Contain between 70 and 91 percent sand and the percentage of silt plus 1.5 times the percentage of clay is 15 or more; and the percentage of silt plus twice the clay is less than 30. | |
| Loamy coarse sand | A total of 25 percent or more very coarse and coarse sand and less than 50 percent any other single grade of sand. | |
| Loamy sand | A total of 25 percent or more very coarse, coarse, and medium sand, a total less than 25 percent very coarse and coarse sand, and less than 50 percent fine sand and less than 50 percent very fine sand. | |
| Loamy fine sand | 50 percent or more fine sand; or less than 50 percent very fine sand and a total of less than 25 percent very coarse, coarse, and medium sand. | |
| Loamy very fine sand | 50 percent or more very fine sand | |
| Sandy loams | Contain 7-20 percent clay, more than 52 percent sand, and the percentage of silt plus twice the percentage of clay is 30 or more; or less than 7 percent clay, less than 50 percent silt, and more than 43 percent sand. | |
| Coarse sandy loam | A total of 25 percent or more very coarse and coarse sand and less than 50 percent any other single grade of sand | |
| Sandy loam | A total of 30 percent or more very coarse, coarse, and medium sand, but a total of less than 25 percent very coarse and coarse sand and less than 30 percent fine sand and less than 30 percent very fine sand; or a total of 15 percent or less very coarse, coarse, and medium sand, less than 30 percent fine sand and less than 30 percent very fine sand with a total of 40 percent or less fine and very fine sand. | |
| Fine sandy loam | 30 percent or more fine sand and less than 30 percent very fine sand; or a total of 15 to 30 percent very coarse, coarse, and medium sand; or a total of more than 40 percent fine and very fine sand, one half or more of which is fine sand, and a total of 15 percent or less very coarse, coarse, and medium sand. | |
| Very fine sandy loam | 30 percent or more very fine sand and a total of less than 15 percent very coarse, coarse, and medium sand; or more than 40 percent fine and very fine sand, more than one half of which is very fine sand, and a total of less than 15 percent very coarse, coarse, and medium sand. | |
After the appropriate score was assigned to each soil component in each STATSGO map unit, an area weighted average textural score (AWATS) was calculated for each map unit. To accomplish this, the textural score for each soil component was multiplied by the component percentage for that soil component. The resulting values were then summed to obtain an area weighted average score. Table 4 contains an example calculation for a map unit in the Kansas and Upper Republican River Valley study area.
Table 4--An example of the database information for a Map Unit from the Kansas-Upper Republican River Valley and the calculation of the area weighted average textural score (AWATS) for the Map Unit.
| Map Unit = Reading-Ivan-Chase (KS361) | ||||||
|---|---|---|---|---|---|---|
| Soil component percentages [compct] |
45 | 28 | 18 | 4 | 4 | 1 |
| Textures [surftext] | SiL | SiL | SiCL | SiL | SiCL | SiC |
| Textural Score | 8 | 8 | 4 | 8 | 4 | 2 |
| Formula for AWATS | [(45x8)+(28x8)+(18x4)+(4x8)+(4x4)+(1x2)] / 100 = 7.06 | |||||
A STATSGO polygon coverage of the entire State of Kansas was clipped using a Kansas and Lower Republican River Basin boundary coverage provided by the Kansas Water Office. The attribute file for this clipped coverage was then unloaded to an ascii tile from which all unique map unit IDs [MUID], Map Unit names [Muname], surface soil textures [Surftext], and the soil component percentages [Compct] for each soil map unit component were extracted. The surface texture scores for each soil map unit component were added to the spreadsheet and an AWATS was calculated for each STATSGO map unit. The area weighted average soil textures were then used to construct the surface soil interpretation map.
For cartographic purposes, the AWATS were used to classify the STATSGO map units in the study area into similar groups. The values used in the classification correspond to the scores applied to the textural subclasses in Table 1, with the important exception that these values represent area weighted average scores for each STATSGO map unit. Users need to remember that the entire map unit does not contain soils with surface textures that correspond to any particular score from Table 1. In fact, most STATSGO map units have soil components that have quite different surface textures than might be expected from the AWATS for entire map unit.
The ranges of AWATS used for the map classification scheme are provided in Table 5. With two exceptions, the AWATS classes correspond to the 12 textural classes used by NRCS. Map units with AWATS less than or equal to 3.5 were lumped together because they represented a small number of map units in the study area. The class range from 7.51 to 8.5 (= silt loam texture) was split into two classes to enhance differentiation of map units in areas dominated by loessial soils. Soils with silt loam surface textures are very common in north-central and northwestern portions of the state. This class split allows map users to visually differentiate between upland versus valley silt loam soils in these areas.
Table 5--Classes of AWATS used in the map legend for the surface soil texture map of the Kansas and Lower Republican River Valleys.
| Description | AWATS | |
|---|---|---|
| Low | High | |
| AWATS ≅ Sandy Clay (SC) or finer (SiC, C) | 1 | 3.5 |
| AWATS ≅ Silty Clay Loam (SiCL) | 3.51 | 4.5 |
| AWATS ≅ Clay Loam (CL) | 4.51 | 5.5 |
| AWATS ≅ Sandy Clay Loam (SCL) | 5.51 | 6.5 |
| AWATS ≅ Silt (Si) | 6.51 | 7.5 |
| AWATS ≅ lower half of Silt Loam (SiL) | 7.51 | 8.0 |
| AWATS ≅ upper half of Silt Loam (SiL) | 8.01 | 8.5 |
| AWATS ≅ Loam (L) | 8.51 | 9.5 |
| AWATS ≅ Sandy Loams (VFSL, FSL, SL, CoSL) | 9.51 | 13.5 |
| AWATS ≅ Loamy Sands (LVFS, LFS, LS, LCoS) | 13.51 | 17.5 |
| AWATS ≅ Sands (VFS, FS, S, CoS) | 17.51 | 21.0 |
Using a ranking scheme such as the one shown in Table 1 to assign integers values to soil textures and then using the assigned integers to calculate area weighted average values for soil texture is one of many possible methods to classify STATSGO map units. This method was chosen because of its simplicity and reproducibility. Other classification schemes which assign dominant textural classes to map units were evaluated. Although the interpretation for a few map units across the State changed slightly as a function of the classification scheme used, the general spatial patterns of soil texture for the State were very similar for all methods.
STATSGO Map Units and their AWATS in the Kansas and Lower Republican River Basins in Kansas.
| MUID | MUNAME | AWATS |
|---|---|---|
| KS349 | IRWIN-LADYSMITH-IRWIN (KS349) | 4.10 |
| KS338 | IRWIN-IRWIN-KIPSON (KS338) | 4.12 |
| KS310 | WYMORE-WYMORE-WYMORE (KS310) | 4.17 |
| KS311 | PAWNEE-PAWNEE-BURCHARD (KS311) | 4.24 |
| KS330 | CLIME-SOGN-MARTIN (KS330) | 4.32 |
| KS391 | CHASE-WABASH-KENNEBEC (KS391) | 4.36 |
| KS141 | MARTIN-LADYSMITH-MARTIN (KS141) | 4.37 |
| KS331 | FLORENCE-LABETTE-CLIME (KS331) | 4.38 |
| KS194 | WABASH- READING-KENNEBEC (KS194) | 4.44 |
| KS143 | MARTIN-PAWNEE-SOGN (KS143) | 4.51 |
| KS111 | SHARPSBURG-SHARPSBURG-SHELBY (KS111) | 4.53 |
| KS335 | MARTIN-WAMEGO-WAMEGO (KS335) | 4.60 |
| KS308 | WYMORE-IRWIN-KIPSON (KS308) | 4.64 |
| KS315 | TULLY-BENFIELD-CLIME (KS315) | 4.64 |
| KS344 | PAWNEE-WYMORE-PAWNEE (KS344) | 4.67 |
| KS132 | PAWNEE-SOGN-LADYSMITH (KS132) | 4.71 |
| KS104 | GRUNDY-GRUNDY-PAWNEE (KS1 04) | 4.73 |
| KS142 | MARTIN-VINLAND-OSKA (KS142) | 4.83 |
| KS120 | MARTIN-GRUNDY-ELMONT (KS120) | 4.90 |
| KS345 | HASTINGS-CRETE-CRETE (KS345) | 4.95 |
| KS301 | CRETE-CRETE-CRETE (KS301) | 5.15 |
| KS114 | PAWNEE-SHELBY-SHELBY (KS114) | 5.18 |
| KS328 | CRETE-CRETE-MAYBERRY (KS328) | 5.28 |
| KS192 | HAYNIE-LETA-HAYNIE (KS192) | 5.32 |
| KS161 | KENOMA-CLlME-KENOMA (KS161) | 5.42 |
| KS314 | KIPSON-HASTINGS-ARMO (KS314) | 5.57 |
| KS373 | KIPSON-PAWNEE-CRETE (KS373) | 5.58 |
| KS377 | WABASH-MUIR-KENNEBEC (KS377) | 5.64 |
| KS304 | KIPSON-HASTINGS-CRETE (KS304) | 5.68 |
| KS151 | LULA-KENOMA-SUMMIT (KS151) | 5.76 |
| KS175 | POLO-SAMPSEL-OSKA (KS175) | 5.77 |
| KS110 | KNOX-MARSHALL-ARMSTER (KS110) | 5.94 |
| KS145 | WOODSON-WOODSON-PAWNEE (KS145) | 5.94 |
| KS009 | GEARY-KIPSON-HOLDER (KS009) | 6.12 |
| KS307 | CRETE-CRETE-LANCASTER (KS307) | 6.12 |
| KS131 | GYMER-SHARPSBURG-LADYSMITH (KS131) | 6.15 |
| KS146 | SHARPSBURG-SHARPSBURG-SHARPSBURG (KS146) | 6.24 |
| KS121 | ELMONT-MARTIN-VINLAND (KS121) | 6.68 |
| KS116 | GOSPORT-SOGN-LADOGA (KS116) | 6.72 |
| KS113 | HIGGINSVILLE-KNOX-KNOX (KS113) | 6.73 |
| KS316 | WAMEGO- ELMONT-KENNEBEC (KS316) | 6.73 |
| KS368 | SMOLAN-SMOLAN-SMOLAN (KS368) | 6.73 |
| KS327 | CRETE-CRETE-HASTINGS (KS327) | 6.88 |
| KS506 | HARNEY-HARNEY-CORINTH (KS506) | 7.03 |
| KS361 | READING-IVAN-CHASE (KS361) | 7.06 |
| KS174 | GRUNDY-POLO-SUMMIT (KS174) | 7.20 |
| KS502 | HARNEY-HOLDREGE-ROXBURY (KS502) | 7.40 |
| KS507 | HARNEY-HARNEY-CRETE (KS507) | 7.68 |
| KS219 | WOODSON-KENOMA-DENNIS (KS219) | 7.70 |
| KS165 | BATES-WOODSON-SUMMIT (KS165) | 7.71 |
| KS510 | HOLDREGE-NUCKOLLS-UL Y (KS51 0) | 7.75 |
| KS122 | GOSPORT-WELDA-SHELBY (KS122) | 7.88 |
| KS501 | HEIZER-BROWNELL-HARNEY (KS501) | 7.96 |
| KS333 | EUDORA-HAYNIE-MUIR (KS333) | 8.00 |
| KS371 | EUDORA-MUIR-NODAWAY (KS371) | 8.00 |
| KS512 | HARNEY-HARNEY-HOLDREGE (KS512) | 8.00 |
| KS010 | HOBBS-HORD-HORD (KS010) | 8.06 |
| KS508 | ULY-HOLDREGE-ULY (KS508) | 8.18 |
| KS503 | HORD-ROXBURY-MCCOOK (KS503) | 8.19 |
| KS193 | EUDORA-EUDORA-KIMO (KS193) | 8.28 |
| KS302 | HEDVILLE-LANCASTER-LANCASTER (KS302) | 8.37 |
| KS372 | MUIR-EUDORA-SUTPHEN (KS372) | 8.57 |
| KS317 | MORRILL-THURMAN-WYMORE (KS317) | 9.47 |
| KS374 | CARR-MUIR-HUMBARGER (KS374) | 9.73 |
| KS369 | WELLS-VALENTINE-ORTELLO (KS369) | 12.02 |
Alyamani, M.S., and Sen, Z., 1993, Determination of Hydraulic conductivity from Complete Grain-Size Distribution Curves: Ground Water 31, no. 4, p. 551-555.
Bloemen, W., 1980, Calculation of Hydraulic Conductivities of Soils from Texture and Organic Matter Content: Zeitschrift fuer Ptlanzenernaehrung und Bodenkunde (Journal of Plant Nutrition and Soil Science), vol. 43, p. 581-605.
Brakensiek, D.L., Rawls, W.J., and Stephens, G.R., 1984, Modifying SCS Hydrologic Soil Groups and Curve Numbers for Rangeland Soils: American Society of Agricultural Engineers, Paper No. PNR-84-203.
Cosby, B.J., Homberger, G.M., Clapp, R.B., and Ginn, T.R., 1984, A Statistical Exploration of the Relationships of Soil Moisture Characteristics to the Physical Properties of Soils: Water Resources Research, vol. 20, p. 682-690.
Campbell, G.S., 1985, Soil Physics with Basic: Developments in Soil Science, vol. 14. Elsevier, Amsterdam.
Fair, G.M., and Hatch, L.P., 1933, Fundamental Factors Governing the Streamline Flow of Water Through Sand: American Water Works Association Journal, vol. 25, p. 1551-1563.
Hazen, A., 1893, Some Physical Properties of Sands and Gravels with Special Reference to Their Use in Filtration: Massachusetts State Board of Health, 24th Annual Report, p. 541-556.
Hulbert, R, and Feben, D., 1933, Hydraulics of Rapid Filter Sand: American Water Works Association Journal, vol. 25, p. 19-45.
Mason, D.D., Lutz, J.F., and Petersen, R.G., 1957, Hydraulic Conductivity as Related to Certain Soil Properties in a Number of Great Soil Groups--Sampling Errors Involved: Soil Science Society of America Proceedings, vol. 22, p. 554-560.
Peterson, G.A., and Power, J.F., 1991, Soil, Crop, and Water Management; in, Managing Nitrogen for Groundwater Quality and Farm Profitability, R.F. Follett, D.R. Keeney, and R.M. Cruse ed.: Soil Science Society of America, Madison, Wisconsin, pp. 189-198.
Rawls, W.J., and Brakensiek, D.L., 1983, A Procedure to Predict Green and Ampt Infiltration Parameters; in, Advances in Infiltration: Proceedings of the National Conference on Advances in Infiltration, Dec. 12-13, Chicago, IL.
Rawls, W.J., Ahuja, L.R., Brakensiek, D.L., Shirmohammadi, A., 1993, Infiltration and Soil Water Movement; in, Handbook of Hydrology, D.R Maidment, ed.: McGraw-Hill, Inc., New York.
Saxton, K.E., Rawls, W.J., Romberger, J.S., and Papendick, R.I., 1986, Estimating Generalized Soil-Water Characteristics from Texture: Soil Science Society America Journal, vol. 49:50, p. 1031-1036.
Shepherd, R.G., 1989, Correlations of Permeability and Grain Size: Groundwater vol. 27, no. 5, p. 633-638
Slichter, C.S., 1899, Theoretical Investigation of the Motion of Ground Waters: U.S. Geological Survey, Annual Report, pt. 2, pp. 295-384.
Soil Survey Division Staff, 1993. Soil Survey Manual: United States Department of Agriculture Handbook No. 18, U.S. Government Printing Office, Washington, D.C.
Sperry, J.M., and Peirce, J.J., 1995, A Model for Estimating the Hydraulic Conductivity of Granular Material Based on Grain Shape, Grain Size, and Porosity: Groundwater vol. 33, no. 6, p. 892-898.
Terzaghi, C., 1925, Principles of Soil Mechanics: Determination of Permeability of Clay: Engineering News-Record vol. 95, p. 832-836.
Tietje, O., and Hennings, V., 1996, Accuracy of the Saturated Hydraulic Conductivity Prediction by Pedo-Transfer Functions Compared to the Variability within FAO Textural Classes: Geoderma, vol. 69, p. 71-84.
U.S. Department of Agriculture, 1994, State Soil Geographic (STATSGO) Data Base, Data Use Information: U.S. Department of Agriculture, Miscellaneous Publication 1492.
Vereecken, H., Maes, J., and Feyen, J., 1990, Estimating Unsaturated Hydraulic Conductivity from Easily Measured Soil Properties: Soil Science, vol. 149, p. 1-12.
Wenzel, L. K., and Fishel, V. C.,, 1942, Methods for Determining Permeability of Water-Bearing Materials, With Special Reference to Discharging-Well Methods: U.S. Geological Survey, Water-Supply Paper 887 [available online]
Kansas Geological Survey, Geohydrology
Placed online Nov. 9, 2016
Comments to webadmin@kgs.ku.edu
The URL for this page is http://www.kgs.ku.edu/Hydro/Publications/1998/OFR98_6/index.html