Kansas Geological Survey, Open-file Report 1997-78
by Donald O. Whittemore
for
National Cooperative Refinery Association,
McPherson Board of Public Utilities,
and
Equus Beds Groundwater Management District No. 2
Study conducted in cooperation with the
Equus Beds Groundwater Management District No. 2
and the
Kansas Department of Health and Environment
KGS Open File Report 1997-78
December, 1997
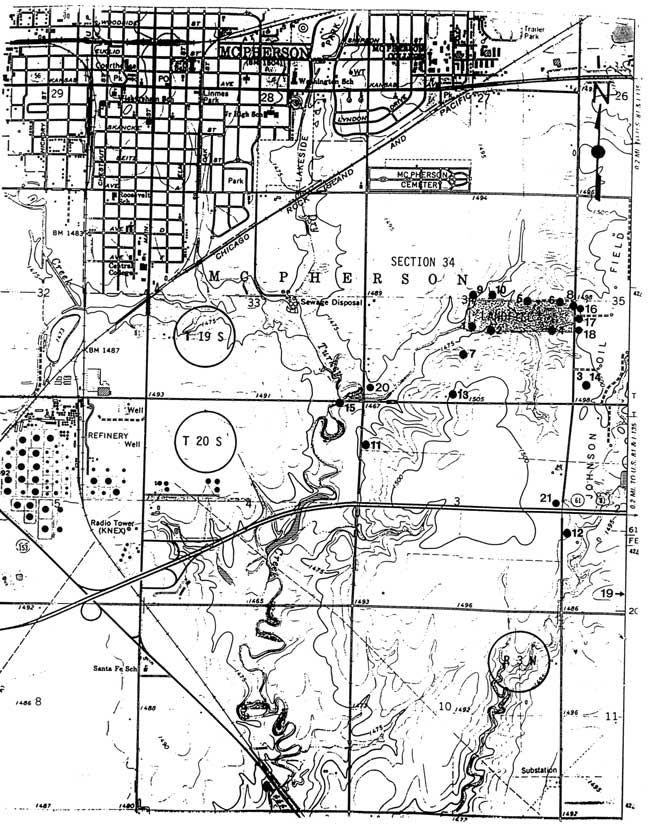
Ground-water quality problems in the area of the municipal landfill southeast of McPherson, Kansas led the Kansas Department of Health and Environment (KDHE) and Equus Beds Groundwater Management District No. 2 (GMD2) to investigate the sources of the contamination (Figure 1). Although volatile organic compounds had been discovered in water samples from monitoring wells close to the site, saline ground waters were also found in these and in domestic wells farther from the landfill. Four sources of salinity were considered as possible contributors to the high chloride content of the ground waters: the landfill, an oil field to the east of the landfill, treated wastewater in Dry Turkey Creek, and the Permian bedrock underlying the Equus Beds aquifer.
Figure 1--Location of study area and sites for water samples. The study area comprises Sec. 35, the east half of Sec. 34, and the west half of Sec. 35, T. 19 S., R. 3 W., and Sec. 3, the east half of sec. 4, and the west half of Sec. 2, T. 20 S., R. 3 W. The numbers next to the circles refer to the water samples listed in Tables 3 and 4.
The Kansas Department of Health and Environment initially requested some assistance from the Kansas Geological Survey (KGS) in the identification of the salinity source(s). Although the KGS gave the KDHE a general indication of the primary source, the data were too limited to clearly separate salinity sources over the entire area of the landfill and nearby domestic wells. The GMD2 then requested assistance from the KGS to analyze samples from most of the available monitoring wells next to the landfill and domestic wells south and southwest of the landfill, and determine the salinity source(s) based on geochemical identification methods. The KGS used chemical data generated from this and previous studies in the area, well construction information for wells, and other hydrogeologic investigations in the region to complete this report.
Staff of the McPherson Board of Public Utilities and GMD2 collected water samples from monitoring and domestic wells and Dry Turkey Creek (Figures 1 and 2). Ground waters were sampled after pumping wells using either a Grundfos pump or bailing. Where possible, 3 casing volumes of water were removed from wells before sampling. The samples were collected in polyethylene bottles that were placed into ice chests. Samples were refrigerated and shipped to the KGS. The waters provided by the KDHE were collected using a Geoprobe sampling device. Sample collection information is summarized in Table 1. Construction data for the sampled wells is listed in Table 2.
Figure 2--Location of monitoring wells in the landfill area. Numbers 1-10 refer to monitoring wells and numbers 16-18 indicate the location of the Geoprobe samples listed in Table 3.
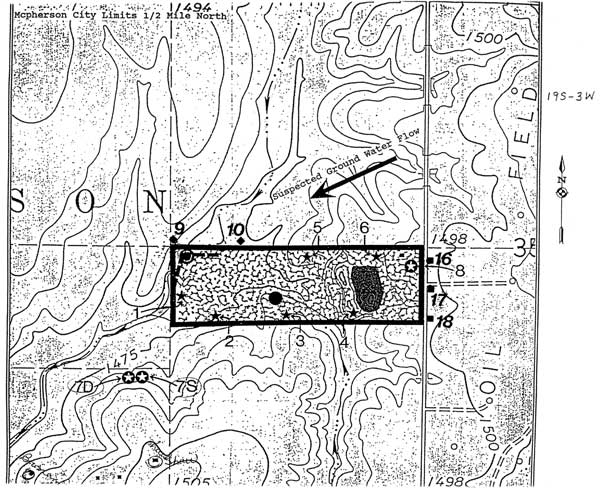
Table 1--Identification, location, and collection information for samples collected for the study and analyzed by the Kansas Geological Survey.
| Sample identification |
Sample type |
Legal location |
Location | Collection date |
Collection time |
Collector name and agency |
Collection method |
Volume pumped, gal |
|---|---|---|---|---|---|---|---|---|
| Geoprobe #1 | Ground wtr. | NW NW SW 35-19S-3W | 19-03W-35CBBB | 3/6/1997 | 11:45 | Poyer/Dallen, KDHE | Probe | NAa |
| Geoprobe #2 | Ground wtr. | NW NW SW 35-19S-3W | 19-03W-35CBBC | 3/6/1997 | Poyer/Dallen, KDHE | Probe | NA | |
| Geoprobe #3 | Ground wtr. | SW NW SW 35-19S-3W | 19-03W-35CBCB | 3/6/1997 | 15:45 | Poyer/Dallen, KDHE | Probe | NA |
| MW-1D | Ground wtr. | SW NW SE 34-19S-03W | 19-03W-34DBBC | 9/22/1997 | 13:00 | Boese & Koci, GMD2 | Pump | 50 |
| MW-2D | Ground wtr. | SW NW SE 34-19S-03W | 19-03W-34DBCA | 9/22/1997 | 12:40 | Boese & Koci, GMD2 | Pump | 42 |
| MW-4 | Ground wtr. | SW NE SE 34-19S-03W | 19-03W-34DACA | 9/22/1997 | 13:35 | Boese & Koci, GMD2 | Pump | 10 |
| MW-5D | Ground wtr. | NW NE SE 34-19S-03W | 19-03W-34DABB | 10/1/1997 | 11:12 | Boese & Koci, GMD2 | Pump | 10 |
| MW-6D | Ground wtr. | NE NE SE 34-19S-03W | 19-03W-34DAAB | 10/1/1997 | 10:35 | Boese & Koci, GMD2 | Pump | 2 |
| MW-7D | Ground wtr. | NE SE SW 34-19S-03W | 19-03W-34CDAB | 10/2/1997 | 13:55 | Koci, GMD2 | Pump | 15 |
| MW-8 | Ground wtr. | NE NE SE 34-19S-03W | 19-03W-34DAAA | 10/1/1997 | 13:24 | Boese & Koci, GMD2 | Pump | 10 |
| MW-9 | Ground wtr. | SW SW NE 34-19S-03W | 19-03W-34ACCC | 10/1/1997 | 12:01 | Boese & Koci, GMD2 | Pump | 15 |
| MW-10 | Ground wtr. | SW SW NE 34-19S-03W | 19-03W-34ACCD | 10/1/1997 | 14:20 | Boese & Koci, GMD2 | Pump | 8 |
| Tim Shaw domestic well | Ground wtr. | SW NW NW 03-20S-3W | 20-03W-03BBC | 9/22/1997 | 15:40 | Boese & Koci, GMD2 | Pump | 35 |
| McBeath domestic well | Ground wtr. | NW NW SW 02-20S-03W | 20-03W-02CBB | 10/1/1997 | 15:38 | Koci, GMD2 | Pump | Not measured |
| John Shaw domestic well | Ground wtr. | SE SE SW 34-19S-03W | 19-03W-34CDD | 10/1/1997 | 15:46 | Boese & Koci, GMD2 | Pump | 105 |
| Johnson Lease | Oil brine | SW 35-19S-03W | 19-03W-35C | 9/25/1997 | 14:45 | Louis, KCC | Tank top | NA |
| Johnson Lease | Oil brine | SW 35-19S-03W | 19-03W-35C | 10/2/1997 | 12:49 | Louis, KCC, and Koci, GMD2 | Tank tap | NA |
| Dry Turkey Creek | Surface wtr. | NE NE NE 04-20S-03W | 20-03W-04AAAB . | 10/1/1997 | 14:03 | Boese, GMD2 | Grab | NA |
| aNA = Not applicable | ||||||||
Table 2--Geoprobe depth, well construction information, and water levels. Most of the information is from WWC-5 water-well records filed at the Kansas Department of Health and Environment and at the Kansas Geological Survey.
| Sample identification |
Collection datea |
Probe or well depth, ft |
Screened interval, ft |
Gravel pack interval, ft |
Lithology along zone of screened interval, depths below land surface |
T.O.C.b elevation, ft |
Depth to water, T.O.C.b, ft |
Water-level elevation, ft |
|---|---|---|---|---|---|---|---|---|
| Geoprobe #1 | 3/6/1997 | 57 | ||||||
| Geoprobe #2 | 3/6/1997 | 57 | ||||||
| Geoprobe #3 | 3/6/1997 | 57 | ||||||
| MW-1D | 9/22/1997 | 75 | 65-75 | 15-75 | Medium sand 48-72 ft, green shale 72-75 ft | 1476.80 | 53.7 | 1422.8 |
| MW-2D | 9/22/1997 | 77 | 67-77 | 15-77 | Medium sand 51-75 ft, green shale 75-78 ft | 1481.92 | 58.5 | 1423.4 |
| MW-4 | 9/22/1997 | 72 | 62-72 | 15-72 | Medium sand 43-62 ft, brown and green clay 62-66 ft, gray shale 66-72 ft | 1490.21 | 58.2 | 1432.0 |
| MW-5 | 10/1/1997 | 74 | 64-74 | 60-74 | Brown and gray clay 63-68 ft, fine gravel and sand 68-73 ft, red and green shale 73-74 ft | 1489.36 | 62.5 | 1426.9 |
| MW-6D | 10/1/1997 | 64 | 54-64 | 52-64 | Fine to medium gravel and sand 47-63 ft, yellow-green and blue-gray shale 63-64 ft | 1493.79 | 62.3 | 1431.5 |
| MW-7D | 10/2/1997 | 86.5 | 76.5-86.5 | 44-86.5 | Medium to coarse sand 62-83.5 ft, brown and green clay 83.5-86.5 ft, green shale 86.5 ft | 65.3 | ||
| MW-8 | 10/1/1997 | 69.5 | 54.4-69.5 | 44-75 | Interbedded gray-brown clay, sand and gravel 44-62 ft, green and blue shale (62-69.5 ft)c | 1500.26 | 52.4 | 1447.8 |
| MW-9 | 10/1/1997 | 79 | 69-79 | 63.5-79 | Medium to coarse sand 59-70 ft with clay seam at 68 ft, gravely sand 70-78 ft, red shale with gray clay 78-79 ft | 1482.74 | 59.1 | 1423.7 |
| MW-10 | 10/1/1997 | 65 | 53.5-63.5 | 50.5-65 | Fine to medium sand 51-54 ft, medium sand 54-60 ft, medium to coarse sand 60-62 ft, green & red shale 62-65 ft | 1479.69 | 54.8 | 1424.9 |
| Tim Shaw well | 9/22/1997 | 90 | 80-90 | 25-90 | Fine to medium sand 60-89, red shale 89-90 | 60.5 | ||
| McBeath Welld | 10/1/1997 | 108 | 60-80 | 25-108 | Clay 21-65 ft, sand and clay 65-75 ft, rock 75-77 ft, green clay 77-85 ft, gray clay and blue shale 85-108 ft | |||
| John Shaw well | 10/1/1997 | 105 e | 80.6 | |||||
| a Water levels were measured on date of sample collection. b T.O.C. = top of casing. c Last depth interval not given, was assumed from above interval and well depth. d Well log for same location, J.D. Herrold listed as owner when drilled in 1988. e Depth measured to bottom of well on sample date. |
||||||||
The water and brine samples were filtered through 0.45 µm membrane filter paper before analysis. Specific conductance was measured to estimate chloride concentrations and determine dilution factors for the optimum concentration range of the analytical method. Chloride, sulfate, and bromide concentrations were determined using automated colorimetric methods on a Technicon AutoAnalyzer II, except for sulfate content in the brine samples which was measured by a turbidimetric procedure. The chloride concentration was corrected for the presence of bromide. Iodide concentration was determined and used in the correction of apparent bromide to true values. The estimated maximum errors in the chloride, sulfate, and bromide determinations are 3%, 5%, and 5%, respectively, except for the bromide content in the samples from MW-1 and MW-2. The bromide error could be larger for these two samples (but <10%) because the iodide concentration and, thus, the iodide correction, was relatively large. The error estimates are based on data periodically collected for samples spiked with standards and on results from participation in the standard reference water program of the U.S. Geological Survey.
Laboratory information and chemical data for the water and brine samples are listed in Table 3. An oil brine collected and analyzed by KGS staff about 14 years ago from the same oil field as for the brine sampled for this study is included in the table. For ease in determining the sample locations, a map locator number is listed in Tables 3 and 4 for reference to the numbered sites in Figures 1 and 2.
Table 3--Chemical Data and Mass Constituent Ratios for Samples Collected for this Study and Analyzed by the Kansas Geological Survey. Included in the list is the analysis of an oil brine collected and analyzed by the Kansas Geological Survey in 1983 from the same oil field as for the brine samples in this study.
| Map locator number |
Sample identification |
Location | Collection Date |
Date received |
Date analysis completed |
KGS project number |
KGS lab number |
Sp.C., lab µS/cm |
SO4 mg/L |
Cl mg/L |
Br mg/L |
Br/Cl X 104 |
SO4/Cl |
|---|---|---|---|---|---|---|---|---|---|---|---|---|---|
| 16 | Geoprobe #1 | 19-03W-35CBBB | 3/6/1997 | 3/10/1997 | 3/26/1997 | BRID-001 | 970033 | 4773 | 111 | 1472 | 5.39 | 36.6 | 0.0754 |
| 17 | Geoprobe #2 | 19-03W-35CBBC | 3/6/1997 | 3/10/1997 | 3/26/1997 | BRID-002 | 970034 | 102 | 681 | 1.95 | 28.6 | 0.150 | |
| 18 | Geoprobe #3 | 19-03W-35CBCB | 3/6/1997 | 3/10/1997 | 3/26/1997 | BRID-003 | 970035 | 3730 | 209 | 907 | 3.09 | 34.1 | 0.230 |
| 1 | MW-ID | 19-03W-34DBBC | 9/22/1997 | 9/25/1997 | 11/3/1997 | BRID-004 | 970404 | 2880 | 37.8 | 386 | 1.63 | 42.1 | 0.0979 |
| 2 | MW-2D | 19-03W-34DBCA | 9/22/1997 | 9/25/1997 | 11/3/1997 | BRID-005 | 970405 | 7395 | 202 | 2110 | 7.10 | 33.7 | 0.0957 |
| 4 | MW-4 | 19-03W-34DACA | 9/22/1997 | 9/25/1997 | 11/3/1997 | BRID-006 | 970406 | 3230 | 1766 | 154 | 0.49 | 31.6 | 11.5 |
| 5 | MW-5D | 19-03W-34DABB | 10/1/1997 | 10/8/1997 | 11/3/1997 | BRID-W9 | 970413 | 3580 | 144 | 828 | 2.62 | 31.6 | 0.174 |
| 6 | MW-6D | 19-03W-34DAAB | 10/1/1997 | 10/8/1997 | 11/3/1997 | BRID-010 | 970414 | 2940 | 120 | 706 | 2.12 | 30.1 | 0.170 |
| 7 | MW-7D | 19-03W-34CDAB | 10/2/1997 | 10/8/1997 | 11/3/1997 | BRID-011 | 970415 | 7810 | 90.0 | 2360 | 9.02 | 38.2 | 0.0381 |
| 8 | MW-8 | 19-03W-34DAAA | 10/1/1997 | 10/8/1997 | 11/3/1997 | BRID-012 | 970416 | 3500 | 1546 | 394 | 1.48 | 37.6 | 3.92 |
| 9 | MW-9 | 19-03W-34ACCC | 10/1/1997 | 10/8/1997 | 11/3/1997 | BRID-013 | 970417 | 3400 | 217 | 729 | 2.52 | 34.6 | 0.298 |
| 10 | MW-10 | 19-03W-34ACCD | 10/1/1997 | 10/8/1997 | 11/3/1997 | BRID-014 | 970418 | 3480 | 85.0 | 868 | 2.72 | 31.4 | 0.0979 |
| 11 | Tim Shaw well | 20-03W-03BBC | 9/22/1997 | 9/25/1997 | 11/3/1997 | BRID-007 | 970407 | 9670 | 85.8 | 3130 | 12.4 | 39.7 | 0.0274 |
| 12 | McBeath well | 20-03W-02CBB | 10/1/1997 | 10/8/1997 | 11/3/1997 | BRID-015 | 970419 | 2930 | 207 | 645 | 2.51 | 38.9 | 0.321 |
| 13 | John Shaw well | 19-03W-34CDD | 10/1/1997 | 10/8/1997 | 11/3/1997 | BRID-016 | 970420 | 5480 | 191 | 1566 | 5.97 | 38.1 | 0.122 |
| 3 | Johnson Lease brine | 19-03W-35C | 9/25/1997 | 10/8/1997 | 11/3/1997 | BRID-008 | 970412 | 173900 | 76 | 101500 | 457 | 45.0 | 0.0007 |
| 14 | Johnson Lease brine | 19-03W-35C | 10/2/1997 | 10/8/1997 | 11/3/1997 | BRID-017 | 970421 | 181000 | 72 | 105000 | 475 | 45.3 | 0.0007 |
| 19 | Johnson Oil Field | 20-03W-02CD | 6/3/1983 | 83275 | 177000 | 2 | 78520 | 344 | 43.8 | 0.00003 | |||
| 15 | Dry Turkey Creek | 20-03W-04AAAB | 10/1/1997 | 10/8/1997 | 11/3/1997 | BRID-018 | 970422 | 2095 | 90.7 | 509 | 0.69 | 13.5 | 0.178 |
Table 4--Chemical Data and Mass Constituent Ratios for Samples Collected and Analyzed by the Kansas Department of Health and Environment and for a Well Water Reported in Williams and Lohman (1949).
| Map locator number |
Sample identification |
Location | Collection Date |
Collection Time |
Date received |
Date analysis reported |
KDHE lab number |
Collector |
|---|---|---|---|---|---|---|---|---|
| 16 | Geoprobe #1 | 19-03W-35CBBB | 3/6/1997 | 11:45 | 3/7/1997 | 3/26/1997 | 701104PT | Poyer/Dallen |
| 18 | Geoprobe #3 | 19-03W-35CBCB | 3/6/1997 | 15:45 | 3/7/1997 | 3/26/1997 | 701106PT | Poyer/Dallen |
| 7 | MW-7S | 19-03W-34DAAB | 10/1/1996 | 14:45 | 10/2/1996 | 10/8/1996 a | 700582PT | Medina |
| 7 | MW-7D | 19-03W-34CDAB | 10/2/1997 | 14:50 | 10/2/1996 | 10/8/1996 a | 70058OPT | Medina |
| 20 | Bowman domestic well | 19-03W-34CCC | 9/12/1996 | 9/13/1996 | 11/3/1997 | 700472PT | Medina/Poyer | |
| 13 | John Shaw domestic well | 19-03W-34CDD | 10/1/1997 | 15:45 | 10/2/1996 | 10/8/1996a | 700581PT | Medina |
| 21 | Fred Johnson stock well b | 20-03W-03ADD | 11/25/38 |
Table 4--Continued.
| Sample identification |
Ca mg/L |
Mg mg/L |
Na mg/L |
Alakalinity as CaCO3 mg/L |
SO4 mg/L |
Cl mg/L |
NO3-N mg/L |
Br mg/L |
Br/Cl X 104 |
SO4/Cl |
Na/Cl |
|---|---|---|---|---|---|---|---|---|---|---|---|
| Geoprobe # 1 | 639 | 125 | 96.6 | 102 | 1543 | 5.68 | 36.8 | 0.066 | 0.063 | ||
| Geoprobe #3 | 503 | 73.2 | 132 | 198 | 959 | 3.39 | 35.4 | 0.206 | 0.138 | ||
| MW-7S | 396 | 47.8 | 437 | 363 | 78.1 | 1200 | 4.24 | 0.065 | 0.364 | ||
| MW-7D | 525 | 78.4 | 750 | 363 | 82.8 | 2030 | 5.85 | 0.041 | 0.369 | ||
| Bowman domestic well | 563 | 82.6 | 789 | 80.2 | 2530 | 6.71 | 0.032 | 0.312 | |||
| John Shaw domestic well | 345 | 58.2 | 542 | 206 | 198 | 1380 | 7.00 | 0.143 | 0.393 | ||
| Fred Johnson stock well | 508 | 180 | 202 | 60 | 2130 | 118 | 0.50 | 18.1 | 1.71 | ||
| aChloride concentration was later corrected by KDHE and reported 11/19/1997. b Well depth 100 ft, elevation 1493 ft, depth to water below land surface 58.9 ft, water level elevation 1433 ft, measured 10/5/1938. |
|||||||||||
Table 4 lists selected data for the study area from the KDHE and a KGS Bulletin (Williams and Lohman, 1949). Other chemical data exist for samples from the monitoring wells that were determined by a commercial laboratory for the McPherson Board of Public Utilities. Error analysis of the commercial laboratory data indicates that some of the commercial laboratory data are too questionable to be valuable for this study. The error analysis was based on examination of charge balances, constituent ratios, and dissolved solids sums and measurements. The KDBE and KGS Bulletin data were also analyzed for errors; the values in Table 4 meet an acceptable criterion for charge balance. Although no alkalinity was reported for three of the KDHE samples in Table 4, the large concentration of other constituents allows use of alkalinity estimates for the charge balance computation for assessing data quality. Other chemical data exist for the Equus Beds aquifer in the region surrounding the study area (Williams and Lohman, 1949; Hathaway et al., 1981).
Unconsolidated clay, silt, sand, and gravel primarily of Quaternary age underlie the landfill area. The saturated sediments comprise part of the Equus Beds aquifer. The bedrock underlying the unconsolidated sediments is the upper part of the Permian Wellington Formation which consists of shale and thin beds of limestone, dolomite, siltstone, gypsum (CaSO4 * H2O), and anhydrite (CaSO4). Although most of the Wellington shale is gray and bluish-gray, some beds are maroon and green near the top of the formation. The Hutchinson Salt Member occurs in the middle of the Wellington Formation and comprises primarily rock salt with lesser amounts of shale and anhydrite (Williams and Lohman, 1949; Leonard and Kleinschmidt, 1976). The Hutchinson Salt Member thins in an easterly direction in McPherson County. Part of this is due to the removal of the salt during dissolution by ground water and part because the original thickness thins across the county. The eastern margin of the "lost-circulation zone" or "saltwater aquifer" of the Wellington Formation formed by dissolution lies a few miles to the west of the landfill (Leonard and Kleinschmidt, 1976; Gogel, 1981). Gogel (1981) indicates that some subsurface salt remains in the main body of the Hutchinson Salt Member a couple miles to the northwest of the landfill and in a small isolated area a few miles to the east of the landfill. Thus, thin beds of salt could possibly still exist at depth in the bedrock below the landfill.
The depth to bedrock in the area of the landfill ranges from 62 feet at the east end of the landfill to 75 feet near the west end based on the lithologic logs of the monitoring wells (Table 2). The topography slopes gently to the west (based on the U.S. Geological Survey topographic quadrangle, see Figures 1 and 2). Therefore, the bedrock surface slopes to the west at an angle slightly greater than that of the topography. Depths to bedrock based on the lithologic logs of MW-7 and domestic wells in Table 2 and other water-supply wells in the general study area indicate that the bedrock surface dips at a greater slope about a mile to the west of the landfill than under the landfill. The Equus Beds aquifer is much thicker to the west due to the presence of the ancient McPherson channel.
Maps of the water-level surface in the aquifer for the region show a generally westward slope in the area of the landfill. The water-table divide between ground-water flow to the Smoky Hill River valley and to the Little Arkansas River valley is south of McPherson and the landfill (Williams and Lohman, 1949; Leonard and Kleinschmidt, 1976; Gogel, 1981). This is in contrast to the surface-water divide which is to the north of the landfill. The water-level surface at the time of water sample collection for this study slopes gently to the west in the landfill area based on measurements for the monitoring and domestic wells (Table 2). The water levels for the monitoring wells next to the landfill were all within one foot or less of the levels measured in September 1996. The water-level surface for both measurement periods has a greater westward slope in the eastern portion of the landfill than in the center and western part.
Comparison of the water levels and depths to bedrock in Table 2 show that the saturated thickness of the Equus Beds aquifer under the landfill area ranges from about 10 feet in the east to nearly 20 feet in the west. The saturated thickness at the location of the Tim Shaw well is approximately 30 feet. The saturated thickness in the landfill area is probably about 10 or more feet thinner than existed before development of the aquifer for ground-water supply (based on comparison with water levels in Williams and Lohman, 1949).
Most of the saline monitoring and supply well waters in the study area are of calcium-chloride to sodium-chloride chemical type. A few are of calcium-sulfate type. The wells yielding water with very high sulfate content were constructed such that a substantial portion of the screened interval or well depth is within the Permian bedrock. MW-4 has a screened interval completed in 4 ft of brown and green clay and 6 ft of underlying gray shale (Table 2). The green clay could be a very highly weathered portion of the upper Permian Wellington Formation. Thus, the well is primarily completed in the bedrock and the upper part of the screened interval is in a low-permeability layer of the Equus Beds sediments that would not contribute much water during sampling. The high sulfate is interpreted as derived from dissolution of gypsum in the Permian bedrock with only a small input of water from the overlying Equus Beds aquifer. The 15 ft screened interval for MW-8 spans 8.6 ft of clay interbedded with sand and gravel and 7.5 ft of underlying bedrock. The clay interbeds could prevent much flow of water from the overlying thicker coarse sands that exist at this site. Again, as for MW-4, most of the water sampled from this well is probably primarily influenced by the bedrock and not the Equus Bed aquifer. The Johnson stock well sampled in 1938 (Table 4), which also yielded high sulfate water, appears to have been completed primarily in the bedrock based on the well depth (100 ft) and depth to water (59 ft), and the bedrock depth (75 ft) at the McBeath well located about one-fourth mile to the south-southeast.
Some construction waste was apparently accepted for disposal at the landfill (KDHE, personal communication). Building demolition or reconstruction waste includes wall board that is composed primarily of gypsum. Waters infiltrating through such landfills with substantial amounts of wall board can have high sulfate concentrations in leachates. However, it does not appear that the McPherson landfill is a large source of sulfate because the monitoring wells that are not screened primarily in bedrock yield waters with sulfate contents that are in the same range or less than the concentrations in the Geoprobe waters just upgradient of the landfill.
The waters with the highest sulfate contents (>1,000 mg/L) have chloride concentrations in the range 154-394 mg/L. The waters with the highest chloride concentrations (>1,000 mg/L) have sulfate concentrations around 200 mg/L or lower. Therefore, the bedrock does not appear to be the main source of the chloride contamination.
The sources contributing to chloride in the ground waters, as well as in the Dry Turkey Creek water, were identified using the geochemical methods of Whittemore (1984, 1988, 1995). These methods primarily include plots of the constituent mass ratios bromide/chloride and sulfate/chloride versus chloride concentration, and points for the water sample data and curves for the mixing of different source waters. Each mixing curve is generated using an algebraic equation for conservative mixing of two end-member waters. Conservative mixing refers to the simple mixing of waters without chemical reactions, such as mineral precipitation or adsorption, that could alter the concentrations of one or both of the constituents. The intersection of two mixing curves can be determined graphically or by solving for simultaneous algebraic equations. The bromide/chloride ratio is multiplied by 10,000 for graphical display to give numbers that range from about one upwards (the lowest mass ratios are near 0.0001 for halite or rock salt dissolution). The logarithmic scales are used in the graphs because they produce a more even distribution (separation) of points for large ranges in concentration and ratios than linear scales.
Figure 3 is a bromide/chloride versus chloride concentration plot containing points for all of the ground waters for which bromide content was determined (Tables 3 and 4). The two dashed curves in Figure 3 enclose a zone representing the mixing of freshwater with natural Permian saltwater. The freshwater end members for the dashed curves are based on fresh ground waters from the Equus Beds area (Whittemore, 1984; and unpublished data for the ongoing Equus Beds Aquifer Mineral Intrusion Study). The saltwater end members for the dashed curves are for saltwaters from the Wellington Formation in the Smoky Hill River valley (Whittemore, et al., 1981) and from the Equus Bed aquifer (ongoing Equus Beds Aquifer Mineral Intrusion Study).
Figure 3--Bromide/chloride mass ratio versus chloride concentration and mixing curves for ground waters and oil-field brines from the study area. Key: M monitoring well; P Geoprobe; D domestic well; O oil-field brine; dashed curves enclose mixing zone for freshwater and halite-dissolution brine; solid curves enclose mixing zone for fresh to saline waters and oil-field brine.
Formation brines associated with hydrocarbons in strata not containing rock salt in Kansas have substantially higher bromide/chloride ratios than for saltwater primarily derived from the dissolution of rock salt. The oil-field brine samples listed in Table 3 have bromide/chloride mass ratios in the range 0.00438-0.00453 (43.8-45.3 after multiplying by 10,000). The oil well sampled in 1983 is known to have been producing from Mississippian strata; the more recently sampled well is presumed to also produce from these strata. The two solid curves in Figure 3 represent the mixing of oil brine with fresh and less saline waters such that all the points for the sampled waters lie within the mixing zone and the end points for the curves extend to the middle of the mixing zone between freshwater and salt-dissolution brine. The maximum analytical error above and below the oil-brine samples with the highest and lowest bromide/chloride ratios was used to determine the oil-brine end members for the two solid curves. The small difference in the bromide/chloride ratio between the brines from the two different oil wells suggests that the oil brine produced from the Johnson Oil Field could generally be in a relatively narrow range.
All of the points for the sampled ground waters plot in Figure 3 at higher bromide/chloride ratios than for the mixing of only freshwaters with salt-dissolution brine. The bromide/chloride ratios for the ground waters range from 0.00286 to 0.00421 (28.6-42.1 after multiplication by 10,000). The primary saltwater source contributing to these waters is interpreted as oil-field brine.
The Geoprobe samples were collected to the east of and across the county road bordering the landfill (Figure 2). The sampling locations are upgradient of the landfill relative to groundwater flow. The sample depths were probably only a few feet below the water table based on the Geoprobe sample depth, the water level in MW-8, and the increasing surface elevation in the eastward indicated by the topographic map. The Geoprobe samples appear to represent waters that would not be affected by leachate from the landfill. Points for the Geoprobe samples plot within the chloride concentration and bromide/chloride ratio ranges for the monitoring and domestic well waters.
Figure 4 is a bromide/chloride versus chloride graph including points for only the Geoprobe and oil-brine samples. The chloride axis extends from 100 to 200,000 mg/L in contrast to the larger range in Figure 3 in order to show more detail for the Geoprobe points. The solid mixing curve in Figure 4 extends from the average bromide/chloride ratio for the oil brines through the points for the Geoprobe samples to the middle of the mixing zone for freshwater and salt-dissolution brine. The dashed mixing curves are the same as in Figure 3.
Figure 4--Bromide/chloride mass ratio versus chloride concentration and mixing curves for ground waters sampled by a Geoprobe east of the landfill. Key: P Geoprobe; O oil-field brine; dashed curves enclose mixing zone for freshwater and halite-dissolution brine; dashed and dotted curve is general average for mixing of freshwater and halite-dissolution brine; solid curve represents mixing of oil-field brine with background water to fit composition of Geoprobe waters.
The points for the Geoprobe samples are consistent with the mixing of varying amounts of oil brine with a relatively constant background concentration of chloride (about 270 mg/L). The background chloride is probably mainly derived from natural dissolution of evaporite minerals in Permian bedrock combined with lower concentrations of surface and near-surface sources. Low concentrations (less than 30 mg/L) of chloride in the Equus Beds aquifer can originate from near-surface natural sources, including chloride from precipitation and soil leaching concentrated by evapotranspiration. The 270 mg/L of chloride not attributed to an oil-brine source is greater than the chloride concentration (118 and 154 mg/L) in the samples from MW-4 and the Johnson stock well. This suggests either that there could be higher chloride contributions from the Permian bedrock to the east or that there is an additional source of salt-dissolution water such as road salt. It is noted that I-35 is only about one-half mile to the east in an upslope and upgradient groundwater direction from the east side of the landfill, thus, runoff from the highway could infiltrate and affect ground-water quality near the Geoprobe sample locations. Another possibility is that, if the original oil brine produced from the oil field had a somewhat lower bromide/chloride ratio than observed recently, the low-chloride end point for the solid mixing curve in Figure 4 would have a lower value and still pass through the Geoprobe points. This would reduce the apparent background chloride concentration.
The concentrations and percentages of chloride interpreted to be derived from oil brine and other sources are listed in Table 5 for the Geoprobe and other samples analyzed by the KGS. The chloride sources for each sample analysis were computed using the intersection of two mixing curves for bromide/chloride versus chloride concentration. One curve represents the mixing of freshwater with halite-dissolution brine and is shown by the dashed-dotted line in Figure 4; the curve is approximately in the center of the mixing zone enclosed by the dashed curves. The other mixing curve (for example, the solid line in Figure 4) extends from the end point for the average oil-field brine through the ratio and chloride content of a particular well-water sample to the intersection with the first curve. The chloride concentration at the intersection point of the two curves represents the value listed in the natural and other column in Table 5. The oil-field brine contribution to the chloride content is the difference between the total chloride concentration and the natural and other value. The computations were made by solving for simultaneous algebraic equations with the aid of a spreadsheet.
Table 5--Estimates of the source contributions to the chloride concentration of monitoring and domestic well waters in the study area. Natural chloride sources are mainly dissolution of Permian evaporite minerals. The estimated chloride concentration for the oil-brine contribution is based on a bromide/chloride weight ratio of 0.00447 for the average oil brine. The chloride percentage is the chloride concentration for a source divided by the total chloride concentration and multiplied by 100. The values in parentheses represent the calculated estimates for the ranges in concentrations and percentages of chloride contributed from different sources. Chloride values in the table may not exactly add to the total chloride concentration because they were based on calculated numbers rounded to two figures. See the text for the method of computation of the source contributions and ranges.
| Sample identification |
Chloride, mg/L | Percent chloride | ||||
|---|---|---|---|---|---|---|
| Total | Oil-field brine | Natural and other | Oil-field brine |
Other sources |
||
| Total | Landfill | |||||
| Geoprobe #1 | 1472 | 1180 (1010-1300) | 300 (180-460) | 0 | 80 (69-88) | 20 (12-31) |
| Geoprobe #2 | 681 | 410 (330-460) | 270 (220-330) | 0 | 61 (48-68) | 39 (32-52) |
| Geoprobe #3 | 907 | 670 (560-740) | 240 (170-350) | 0 | 74 (62-82) | 26 w(18-38) |
| MW-1D | 386 | 350 (260-370) | 36 (10-130) | <50 | 91 (68-97) | 9 (3-32) |
| MW-2D | 2110 | 1550 (1260-1790) | 560 (320-850) | <500 | 73 (60-85) | 27 (15-40) |
| MW-4 | 154 | 94 (49-120) | 60 (39-110) | <30 | 61 (32-75) | 39 (25-68) |
| MW-5D | 828 | 560 (460-630) | 270 (200-360) | <100 | 68 (56-76) | 32 (24-44) |
| MW-6D | 706 | 450 (370-510) | 250 (200-340) | <100 | 64 (52-72) | 36 (28-48) |
| MW-7D | 2360 | 1990 (1740-2180) | 370 (180-620) | <100 | 84 (74-92) | 16 (8-26) |
| MW-8 | 394 | 320 (250-360) | 78 (38-150) | <10 | 80 (63-90) | 20 (10-37) |
| MW-9 | 729 | 540 (450-610) | 180 (120-280) | <50 | 75 (62-83) | 25 (17-38) |
| MW-10 | 868 | 580 (480-650) | 280 (220-380) | <200 | 67 (56-75) | 33 (25-44) |
| Tim Shaw well | 3130 | 2750 (2420-3000) | 380 (130-710) | <50 | 88 (77-96) | 12 (4-23) |
| McBeath well | 645 | 540 (450-610) | 100 (40-190) | 0 | 84 (70-94) | 16 (6-30) |
| John Shaw well | 1566 | 1310 (1140-1440) | 260 (130-430) | <50 | 84 (73-92) | 16 (8-27) |
| Dry Turkey Creek | 509 | 0 | 509 | 0 | 0 | 100 |
The range in the chloride concentration from natural and other sources listed in the parentheses in Table 5 was computed using the maximum analytical error estimated for the bromide and chloride concentrations and the upper and lower curves for the zone of mixing of freshwater and halite-dissolution brine. The low chloride value in the range was determined using the upper bromide/chloride ratio for the error range of the actual sample (bromide content plus analytical error divided by chloride concentration minus analytical error). The curve starting at the average oil-brine end member was extended to intersect with the lower dashed curve shown in Figure 4 to give the low range concentration. The high range value for chloride was computed by using the lower bromide/chloride ratio for the error range in the sample (bromide content minus analytical error divided by chloride concentration plus analytical error) and the intersection with the upper dashed curve in Figure 4. The low and high range concentrations for the oil-brine contribution to chloride were calculated by subtracting the high and low range concentrations, respectively, of chloride from natural and other sources from the total chloride content of the sample.
The maximum concentration of chloride that could possibly be derived from landfill leachate in a well water was estimated by considering the chloride concentration from natural and other sources in the Geoprobe samples relative to the location and construction of the well. The farther the location of a monitoring well from the Geoprobe locations, the lower the background chloride used in the estimate, based on the assumption of dilution during ground-water flow to the west. Purgable organic compounds were detected in many of the monitoring wells around the landfill, including MW-4 (records of the KDHE). Detection of several dissolved organics in MW-4 water, even though this well was completed largely in bedrock shale and overlying clay, indicates that some water from the landfill entered the screened interval. If concentrations of organic compounds are correlated with chloride content in the landfill leachate, the relatively low chloride concentration in the MW-4 water suggests that landfill leachate does not contain high chloride concentrations, at least at this location. Very low levels of organic compounds were found in the water from MW-7. Thus, a low level of landfill leachate chloride might be possible at this site.
The McBeath well is located over one mile to the south of the landfill and would not be expected to be at all affected by the landfill. Records from the KDHE indicate that no organic compounds associated with the landfill were found in samples from the John Shaw and Bowman domestic wells. Considering the distance from the landfill and the fact that ground-water flow is generally to the west in the landfill area, the Tim Shaw and John Shaw well waters should be very minimally or not affected by landfill leachate chloride.
One of the largest unknowns in the estimation of the salinity sources in the monitoring well waters is the use of curves in the zone of mixing of freshwater and halite-dissolution for intersection with the mixing curve for oil brine. The bromide/chloride ratios for given concentrations of chloride in the landfill leachate are unknown. The halite-dissolution source for much of the chloride in the McPherson landfill is thought to be a relatively good starting assumption because there probably are many waste bags in the municipal refuse that were used to contain water-softener salt. If the bromide/chloride ratios of landfill leachate for given chloride contents were larger than for the freshwater and halite-dissolution zone, mixing the leachate with the background salinity entering from the east (as indicated by the Geoprobe samples) would give greater ratios than used in the computations for Table 5 values. The curve-intersection computations would then give smaller oil-field brine contributions and larger other-source contributions to the total chloride. The amount of landfill leachate chloride in the other source category for the monitoring wells would also be greater. The use of the freshwater and halite-dissolution zone curves for the intersection method is appropriate for the Shaw domestic wells due to the distance from the landfill and the general westward flow of the ground water in the landfill area. In addition, samples from these two domestic wells generally have higher chloride concentrations than in the waters from the monitoring wells.
The decreasing sulfate/chloride ratio with increasing chloride concentration for the well waters also fits contamination by the oil-field brine as the primary saltwater source. This is illustrated by a graph of the sulfate/chloride mass ratio versus chloride content for the study area waters and curves for the zone of mixing of lower chloride water with oil brine (Figure 5). Wellington saltwaters have appreciably higher sulfate/chloride ratios than the oil brine from the area (Whittemore, et al., 1981). Similar to the bromide/chloride versus chloride relationships, the Geoprobe and domestic well waters fall in the same band as most of the monitoring well waters. The Johnson stock well water (Table 4) and the samples from MW-4 and MW-8 have substantially higher sulfate/chloride ratios than the mixing line (dashed curve in Figure 5) that passes approximately through the middle of the other water samples. This fits the earlier descriptions of these wells as completed primarily in the Permian bedrock and overlying aquifer clays, and thus more susceptible to deriving high sulfate contents from dissolution of gypsum or anhydrite in the Wellington Formation. Extension of the dashed curve in Figure 5 to chloride concentrations less than 100 mg/L gives sulfate/chloride ratios that occur in ground waters in the Equus Beds aquifer or would result from mixing of small amounts of high sulfate water from the Permian bedrock with Equus Beds waters.
Figure 5--Sulfate/chloride mass ratio versus chloride concentration and mixing curves for ground waters and oil-field brines from the study area. Key: M monitoring well; P Geoprobe; D domestic well; O oil-field brine; solid curves enclose zone of mixing of fresh or mineralized water with oil-field brine; dashed curve represents example of mixing line that passes through band of points for most of the ground waters in the study area.
The water collected from Dry Turkey Creek has a bromide/chloride ratio substantially smaller than the ratios for the ground waters from the monitoring and domestic wells. The water flowing in the creek at the time of sampling was nearly all derived from the discharge of treated municipal wastewater discharged about one-half mile upstream (Figure 1). The primary chloride source fitting the chemistry of the water is mixing of halite-dissolution brine discharged from water softeners with other domestic and commercial wastewater. However, the point for the Dry Turkey Creek water does not plot within the zone of mixing between fresh ground water (McPherson's water supply) and halite-dissolution brine (Figure 6). A mixing curve extending from a halite brine through the creek water to lower chloride concentrations suggests that about 40% of the total 509 mg/L chloride concentration might be from other municipal sources, assuming that no oil-field brine is mixed with the creek water (Figure 6). Possible explanations for the other apparent source could be the evapotranspirative concentration of dissolved solids in the city water supply and the addition of wastewater with a relatively high bromide/chloride ratio.
Figure 6--Bromide/chloride mass ratio versus chloride concentration and mixing lines for Dry Turkey Creek water. Key: T Dry Turkey Creek; O oil-field brine; dashed curves enclose mixing zone for freshwater and halite-dissolution brine; dashed and dotted curve is general average for mixing of freshwater and halite-dissolution brine; solid curve represents mixing of freshwater with average halite-dissolution brine to fit composition of Turkey Creek water; horizontal arrow indicates effect of concentrating dissolved chloride and bromide in freshwater by evapotranspiration.
The evapotranspirative concentration mechanism is shown in Figure 6 as the horizontal arrow extending to the lower chloride end member of the mixing curve passing through the point for the creek water. It is certain that some evapotranspiration concentrates dissolved solids in municipal wastewater, such as by human waste affected by human transpiration and other municipal waste impacted by evaporation such as from humidifiers and cooling systems. However, the order of magnitude concentration indicated by the horizontal arrow in Figure 6 appears excessive. The complete explanation for the additional bromide required to bring the creek water to its observed bromide/chloride ratio before or after mixing with water-softener discharge is unknown at this time.
The chloride concentration of the Dry Turkey Creek sample is much too low to be the salinity source for the ground water in the study area. In addition, the combination of the smaller chloride content and bromide/chloride ratio do not fit the mixing with freshwater as the salinity source for the ground waters. Finally, the ground-water flow direction is generally to the west in the study area, thus water infiltrating to the water table from Dry Turkey Creek would not be expected to flow into the area of the saline ground water that is the focus of this report.
The primary source of chloride contaminating the ground waters of the Equus Beds aquifer in the landfill area is oil-field brine. Oil-brine contamination has added from near 100 to over 2,700 mg/L of dissolved chloride to the well waters sampled. Estimated percentages for the amount of chloride contributed from oil brine range from approximately 60 to 90% out of total chloride concentrations ranging from about 150 to 3,100 mg/L. The main source of high sulfate contents in the well waters of the study area is dissolution of gypsum and anhydrite in the Permian Wellington Formation underlying the Equus Beds aquifer.
The general direction of ground-water flow in the landfill area is westward. Ground water just to the east of the landfill contains chloride concentrations from several hundred to nearly 1,500 mg/L. The chloride concentration attributable to sources other than oil brine just east of the landfill is in the range 240-300 mg/L. Increases in the chloride content of ground waters immediately surrounding the north, south and west sides of the landfill that could be derived from landfill leachate appear to be less than one or two hundred mg/L. Considering the limited increase in chloride from landfill leachate next to the landfill, and the distance and direction to the domestic wells, the landfill leachate contribution to chloride in the domestic well waters south and southwest of the landfill is expected to be less than 50 mg/L. More than 80% of the chloride in the domestic well waters is interpreted to be derived from oil-field brine; the remainder is probably mainly from Permian bedrock.
The probable oil-brine source is directly to the east of the study area where the Johnson Oil Field is located. The discovery well of the Johnson Field opened in early 1932 in Sec. 35, T. 19 S., R. 3 W., the section immediately to the east of the landfill. There were 16 wells in the field by the beginning of 1939 (Ver Wiebe, 1939). Although not a large field, it was relatively productive. Studies by the State Board of Health (former KDHE), the City of Wichita, the USGS, and the KGS in the 1930's (Williams and Lohman, 1949) indicate that the standard practices for disposal of oil brine in McPherson, Harvey, and Reno counties until the late 1930's was to surface ponds, but also included road ditches and diversion to surface streams. Large amounts of oil brine are known to have contaminated fresh ground waters in the Ritz-Canton Field to the east of the Johnson Field and in other oil fields to the south. There is no indication that saltwater disposal practices in the Johnson Field would have been any different from those in nearby fields.
The dense saltwater from the past surface disposal of oil brine in the Johnson Field would be expected to flow primarily downwards through the permeable unconsolidated sediments until reaching less permeable clay layers or the shale of the Permian bedrock. Brine diluted by movement through the aquifer to less dense saltwater would migrate in the direction of groundwater flow generally to the west. The saltwater still dense enough to be driven by gravity flow would spread along the top of the clay layers until reaching locations where the clay thinned or disappeared, then would again migrate downwards. Dense saltwater at the base of the unconsolidated aquifer would move along the shale bedrock surface generally in a westward direction due to the slope of the aquifer base to the west toward the McPherson channel. The westward migration of denser saltwater and dispersion of saline water by the ground-water flow would be expected to carry the contamination into the landfill area. Brine that had reached the aquifer base from different disposal pits could move along the small local valleys in the bedrock surface to produce a distributed pattern of varying salinity in the ground water. This could partially explain the spatial variation in the ground-water salinity observed in the study area. The local distribution and thickness of sand and gravel versus clay units would also affect the range in the salinities found at the different well locations.
Water in Dry Turkey Creek during dry periods is derived mainly from discharge from the municipal wastewater treatment plant of McPherson. The creek water sampled for this study was saline. The primary chloride source contributing to the salinity of the creek water is interpreted as halite-dissolution brine discharged from water softeners. However, about 40% of the chloride content could be from other sources, which are unknown at this time. The ground-water level in the Equus Beds aquifer in the vicinity of Dry Turkey Creek is below the channel. Thus, water from the creek could be expected to infiltrate to the subsurface and recharge the aquifer. The rate of the recharge depends on the permeability of different sections of the creek channel. The saline recharge could be expected to slowly increase the salinity of ground water in the Equus Beds aquifer under the creek and then move in the direction of ground-water flow towards producing water wells to the west.
Michael Dealy of Equus Beds Groundwater Management District No. 2 arranged for the study, coordinated the assistance of the District staff, and reviewed the report. McPherson Board of Public Utilities staff Frank Hallgarth, Tim Shafer, and Jim Bell, with assistance from GMD2 staff Don Koci and Tim Boese, collected 15 water samples and assisted in providing information requested by the Kansas Geological Survey for the study. Cina Poyer of the Kansas Department of Health and Environment assisted by providing information for the study and reviewed the report. Staff of the KDHE also collected 3 water samples that they sent to the KGS for analysis. Doug Louis of the Kansas Corporation Commission collected two of the oil-field brine samples. Lawrence Hathaway analyzed the water samples sent to the KGS.
Funding for the analysis of the 15 water samples collected by BPU and GMD2 staff was provided by the National Cooperative Refinery Association, the McPherson Board of Public Utilities, and Equus Beds Groundwater Management District No. 2. The KGS provided funding for facilities and staff involved in the study and for the analyses of the 3 samples collected by the KDHE.
Special recognition is given to the domestic well owners, who cooperated with the investigation and allowed access to their wells for sampling purposes.
Gogel, T., 1981, Discharge of saltwater from Permian rocks to major stream-aquifer systems in central Kansas: Kansas Geological Survey, Chemical Quality Ser. 9, 60 p.
Hathaway, L.R., Waugh, T. C., Galle, O.K., and Dickey, H.P., 1981, Chemical quality of irrigation waters in the Equus Beds area, south-central Kansas: Kansas Geological Survey, Chemical Quality Ser. 10, 45 p.
Leonard, R.B., and Kleinschmidt, M.K., 1976, Saline water in the Little Arkansas River basin area, south-central Kansas: Kansas Geological Survey, Chemical Quality Ser. 3, 24 p.
Ver Wiebe, W. A., 1939, Exploration for oil and gas in western Kansas during 1939: Kansas Geological Survey, Bulletin 28, 106 p.
Whittemore, D.O., 1984, Geochemical identification of salinity sources, in R.H. French (ed.), Salinity in Watercourses and Reservoirs (Proceedings of the International Conference on State-of-the-Art Control of Salinity): Ann Arbor Science, Butterworth Publishers, Stoneham, MA, p. 505-514.
Whittemore, D.O., 1988, Bromide as a tracer in ground-water studies: Geochemistry and analytical determination: Proceedings Ground Water Geochemistry Conference, National Water Well Association, Dublin, OH, p. 339-360.
Whittemore, D.O., 1995, Geochemical differentiation of oil and gas brine from other saltwater sources contaminating water resources: Case studies from Kansas and Oklahoma: Environmental Geosciences 2, 15-31.
Whittemore, D.O., Basel, C.L., Galle, O.K., and Waugh, T.C., 1981, Geochemical identification of saltwater sources in the Smoky Hill River Valley, McPherson, Saline, and Dickinson counties, Kansas: Kansas Geol. Survey, Open-File Report 81-6, Lawrence, KS, 78 p.
Williams, C.C., and Lohman, S.W., 1949, Geology and ground-water resources of a part of south-central Kansas: Kansas Geological Survey, Bull. 79, 455 p. [available online]
Kansas Geological Survey, Geohydrology
Placed online Nov. 11, 2008; originally released December, 1997
Comments to webadmin@kgs.ku.edu
The URL for this page is http://www.kgs.ku.edu/Hydro/Publications/1997/OFR97_78/index.html