Kansas Geological Survey, Open-file Report 96-28
KGS Open File Report 96-28
June 1996
The complete report is available as an Adobe Acrobat PDF file (650 kB).
This study was undertaken to try to determine the sources of high nitrate-N found in ground water in the alluvial valley of the Solomon River. The study area includes selected towns and farmsteads located along the North and South Forks of the Solomon River basin in Phillips, Smith, Rooks, and Osborne counties. The cities that had wells sampled along the North Fork of the Solomon River were Kirwin, Glade, Portis, and Downs. Along the South Fork of the river, wells were sampled at Stockton, Alton, Woodston, Osborne, and Osborne Rural Water District 1A. Nitrate-N concentrations exceeding the MCL have been reported in wells at each of these locations in the past KDHE Hays field office, 1996 personal communication.
The purpose of this study was to determine the possible sources for nitrate which are causing elevated nitrate-N concentrations (generally greater than the U.S. Environmental Protection Agency value of 10 mg/L) in both domestic and municipal wells in this area. Samples were collected from 14 domestic wells, eight municipal wells, and one rural water district well in the area. No irrigation wells were sampled during this survey because of the early sampling period (March 1996).
Samples analyses included complete water chemistry, nitrogen-15 isotope determination, coliform bacteria, and atrazine. Comparisons were made between these chemical analyses and data collected along the North Fork of the Solomon River in 1947 by Leonard (1952).
Sites for collection of water samples were selected based on several criteria.
All samples were analyzed for major cations (calcium, magnesium, sodium, potassium) and anions (chloride, bicarbonate, sulfate, nitrate, and fluoride), in addition to pH, specific conductance, temperature, and calculated total dissolved solids by the Analytical Services section of the Kansas Geological Survey. All of the complete analyses were within 2% charge balance of cations and anions (appendix A, table A-1). A sample from each site was also collected for nitrogen-15 (15N) isotope analysis which was performed at the University of Virginia Department of Environmental Sciences. A one-gallon sample was collected for atrazine analysis and was analyzed by the Kansas Department of Agriculture (KDA), Division of Laboratories.
Water samples were collected from 14 domestic wells, eight municipal wells, and one rural water district well from March 18 to 22, 1996. A hose supplied by the KGS was attached to a spigot at the house or at a hydrant near the well and water run until the specific conductance and temperature stabilized (approximately 10 to 15 minutes). Samples were collected in acid-rinsed 500-mL polyethylene bottles, 250-mL bottles treated with 1 mL (10% HCl acid) for preservation of nutrients, and 125-mL bottles for nitrogen isotope analyses. Additional samples were collected in a one-gallon amber bottle for atrazine analysis and 200-mL samples were collected for coliform bacteria analysis by the Phillips County Health Department LEPP program. Three samples were not analyzed for coliform bacteria because of logistical constraints of getting the samples to the Phillips County Health Department.
Samples were labeled with an id number, legal location, and owner's name. Samples were stored on ice throughout the week. Samples for bacterial analysis were processed the evening of collection by personnel at the County health department. Atrazine samples were delivered to KDA on March 22, 1996, and refrigerated until analyzed. Samples for complete chemical analyses were refrigerated until analyzed. Samples for nitrogen isotope analysis were frozen and then sent in a cooler with blue ice by Federal Express overnight to the University of Virginia for analysis.
The computer Statistical Package for the Social Sciences (SAS Institute, Inc., 1991) was used to perform basic statistical analysis of the water-chemistry data. The data set was very small (total of 23 samples), so nonparametric statistical methods were used for most of the analyses. The level of significance for accepting or rejecting the results of a particular test was set at α = 0.10. This level was selected because the data were collected based on site availability rather than from a planned, ordered sampling grid. Also, because the data set is small, the higher level of significance indicates that a greater level of doubt is acceptable in the data analysis. The statistics presented in this preliminary study are indicators of possible trends occurring in the area. Future work should provide more information that will help to determine if the statistical results are realistic.
The Mann-Whitney U test (which is comparable to the parametric T-test) was used to determine if observations of differences in chemistry from ground water near the North and South Forks of the Solomon River were statistically significant. This test evaluates whether the data are drawn from the same or different populations and is used for sample sets of uneven size (Siegel, 1953; Helsel and Hirsch, 1992). The two groups of data are ranked from smallest to largest with their assigned id to identify which group the values are from. The test is calculated based on ranks of data rather than variation around the mean as is done in the T-test.
Correlation coefficients were calculated using the Spearman rho (ρ) value (Siegel, 1953; Helsel and Hirsch, 1992). This is the nonparametric equivalent of the parametric statistic's Pearson's correlation coefficient r. The difference between the two tests is that the parametric test uses the mean value of the data in the calculation of the correlation coefficient and the Spearman rho is calculated based on the relative ranks of the two variables to each other. Thus, the effect of very large and very small values is minimized and does not influence the calculated value as much as with the Pearson's correlation coefficient r.
Simple linear regression (Helsel and Hirsch, 1992) was used to determine a predictive equation for estimating one parameter, such as nitrate or chloride concentration, from another parameter such as specific conductance, which is easily measured. The Pearson's correlation coefficient (r) was used as an estimate of how well the equation of the line describes the data. Although this is a parametric statistic, the correlation coefficient was used in the hopes that the audience reading this report would find it more understandable than trying to calculate a nonparametric equivalent equation for the line.
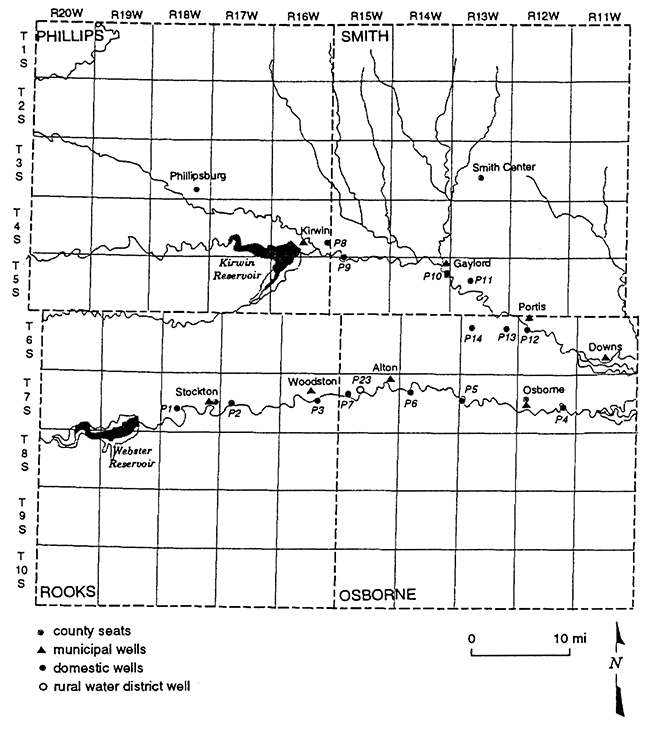
The area of study covers portions of both the North and South Forks of the Solomon River. The township and range designations are from T4S-R16W (near Kirwin Reservoir) to T6S-R11W (Downs, KS) on the North Fork of the Solomon River and T7S-R18W (west of Stockton, KS) to T7S-R12W (Osborne, KS) on the South Fork of the Solomon River (fig. 1).
Figure 1--Location of 23 sampling sites located on the North and South Forks of the Solomon River. Sites include domestic, municipal, and rural water district wells.
The geology of the area includes Cretaceous Greenhorn Limestone, Carlile Shale, and Niobrara Chalk formations overlain by Recent alluvial deposits in the river valley proper and Quaternary terrace deposits adjacent to the river valley. All of the sampled wells pump water from either alluvium or Quaternary terrace deposits (Leonard, 1952). Depth of sampled wells ranged from 25 to 94 ft and included both dug and drilled wells. Data concerning well depths are given in appendix A, table A-2.
Soils in the area are generally silt loams to sandy loams and have a large component of calcareous loess as a source material. The presence of the calcareous component in the sediment suggests that the pH of the soil tends to be basic.
Ground-water flow is generally towards the river or contributing tributaries in the area. Work by Leonard (1952), the Bureau of Reclamation (1984), and McClain et al. (1995) indicates that ground-water flow is generally towards the river. The impact of irrigation well pumping has generally resulted in decreased ground-water base flow to the river, particularly in the upper reaches of the Solomon basin. The Solomon River basin is developed as irrigation districts which use outflow from Kirwin and Webster Reservoirs as a primary source of water. Two irrigation districts are within the study area.
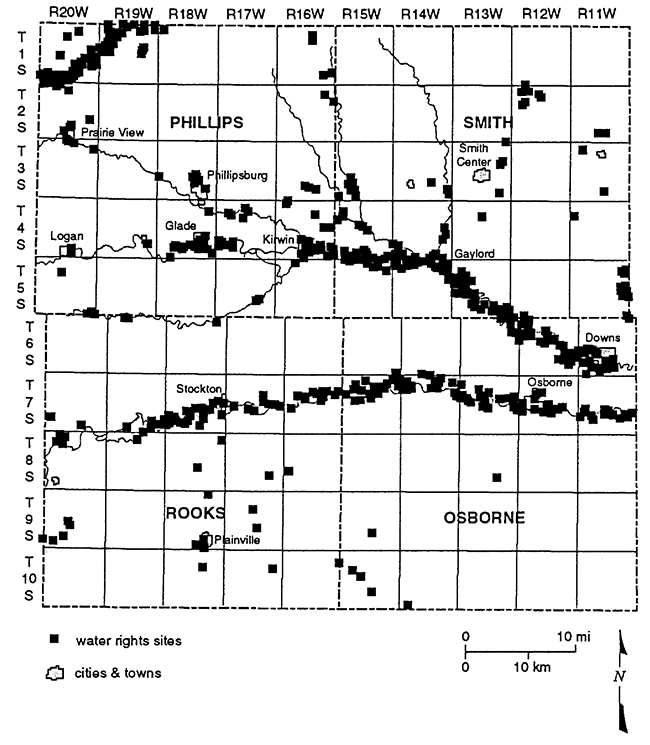
Water-rights appropriation data were obtained from the Division of Water Resources field office in Stockton, KS. These data were plotted by legal location on a map generated by the geographic information system ARC/INFO (ESRI, 1991; fig. 2). This map shows the location of the water rights in the study area. In general, most of the water rights are clustered along the North and South Forks of the Solomon River although there are clusters occurring along smaller drainages in the study area. Of the 310 surface- and ground-water rights appropriated in the study area of Phillips, Smith, Rooks, and Osborne counties, 78% are ground-water rights and 22% are surface-water rights. The majority of the water rights in the area are for irrigation and occur within the river basin or along tributaries.
Figure 2--Location of granted surface- and ground-water rights for study area. Note that the primary occurrence is adjacent to major stream and river channels.
Flood irrigation is the primary method used. An unlined canal system exists for moving surface water from the river to the fields. There are a few center-pivot systems in the area, but these are not common. Figures 3A to 3D show the cumulative water-rights appropriations for each county in the study area. As can be seen, water-right appropriations generally increased until 1984, when a moratorium was imposed on the granting of water rights in the area.
Figure 3--Graphs A and B show total fertilizer sold and cumulative surface- and ground-water rights for Phillips and Smith counties, KS. Graphs show general increasing trend in both fertilizer sold and water rights granted from 1940s to 1990s.
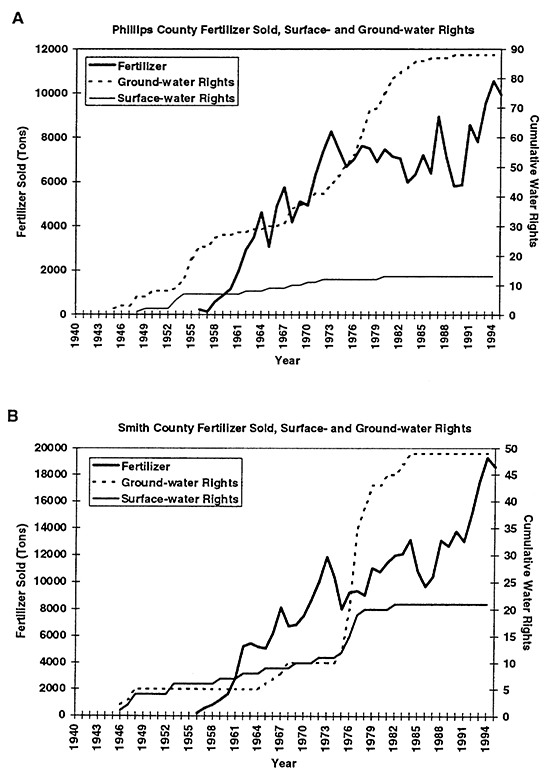
Figure 3--Graphs C and D show total fertilizer sold and cumulative surface- and ground-water rights for Rooks and Osborne counties, KS. Graphs show general increasing trend in both fertilizer sold and water rights granted from 1940s to 1990s.
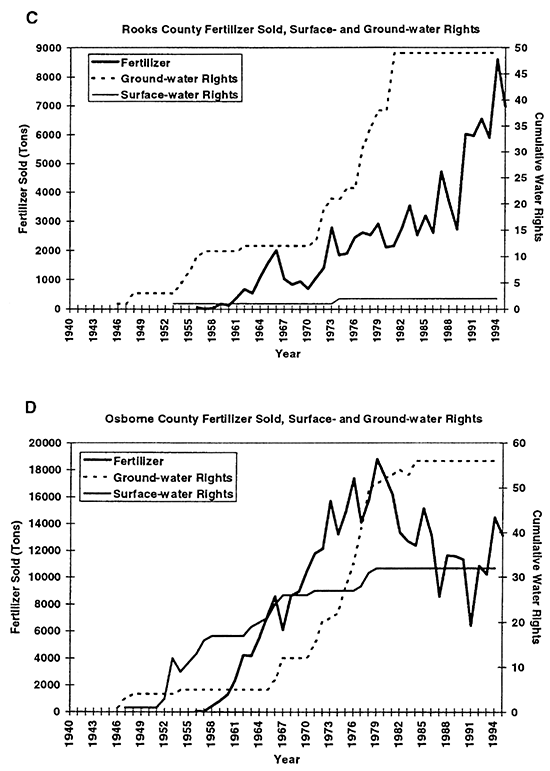
Table 1 summarizes fertilizer use and crops grown in the study area. In general, anhydrous ammonia is applied in September if winter wheat is grown, and in April, May, or June for corn, sorghum, or milo crops. Dryland-farming technique in semi-arid areas is to grow one crop per growing season in order to conserve moisture in the soil. If winter wheat is planted and harvested in June, the field is often left fallow until the following spring when corn or milo is planted. If corn or milo is planted and harvested in October, the field is frequently left fallow until the next fall when winter wheat is planted. Irrigated farms may do a spring corn and/or milo rotation with harvest in the fall, but corn is most frequently planted in the area.
Table 1--Summary of Fertilizer Use and Crops Grown in Study Area
| Crop Grown |
Irrigated Fields Fertilizer (lbs N/acre) |
Dryland Fields Fertilizer (lbs N/acre) |
|---|---|---|
| Corn | 170-300 | 60-100 |
| Sorghum | 70-100 | 30-100 |
| Wheat | 70-90 | 50-70 |
| Milo | 40-90 | 30-60 |
Statistical tabulation of fertilizer use began in the early to mid 1950s (KBA, 1946- 1995). The solid line in figures 3A to 3D shows the quantity of fertilizer sold per county per year. The fertilizer includes all types such as anhydrous ammonia, mixed nitrogen blends, super phosphate, and other combinations. The primary fertilizer used in this area is anhydrous ammonia. Figures 3A to 3D show that fertilizer use and water-right appropriations in the area have increased in the study area over time.
Previous ground-water and geologic investigations in the study area are generally restricted to the North Fork of the Solomon River in Phillips, Smith, Osborne, and Mitchell counties. Work by Leonard (1952) discusses the geology, ground-water resources, and general water chemistry in this part of the current study area. There has not been any recent geologic work except for a study of the surficial geology in Phillips County by Johnson (1993).
In general, the ground-water-bearing units in the area consist of Recent alluvium associated with the present North and South Forks of the Solomon River, Quaternary terrace deposits which occur within the present valley of the Solomon River, and a few wells that were drilled in the Cretaceous Niobrara Formation. In general, the Cretaceous Greenhorn Limestone, Carlile Shale, and Niobrara Formation underlie the alluvial and terrace deposits in the river valley and do not contribute ground water to users in the area.
Water samples were collected from 14 domestic and/or stock wells, eight municipal wells, and one rural water district well. Complete major ion chemical analyses plus fluoride, boron, and nitrate were performed on all samples. Fecal coliform and total coliform analyses were performed on 20 of the samples. Nitrogen-15 isotope analyses were performed on all samples. Atrazine analyses were preformed on all samples. Appendix A (table A-1) gives the chemical data for all samples collected in this preliminary study.
The mean and median values for the chemistry of the ground water around the North and South Forks of the Solomon River for 1996 and 1947 are given in table 2. Silica and bicarbonate concentrations appear higher in the northern portion of the study area whereas nitrate-N appears higher in the southern portion of the study area. However, when the Mann-Whitney U nonparametric test is used to compare the chemistry of the two forks of the Solomon River, no statistical difference is observed (see Methods section).
Table 2--Summary Statistics on Major Water Chemistry from North and South Forks of Solomon River Basin, 1947 and 1996. Number of total samples for 1996 are 23. Number of total samples for 1947 are 26.
| North Fork of Solomon River (1996) | |||||||||
|---|---|---|---|---|---|---|---|---|---|
| TDS | SiO2 | Ca | Mg | Na+K | HCO3 | SO4 | CI | NO3-N | |
| Minimum | 672.9 | 31.1 | 134 | 15.7 | 51.7 | 334 | 78.8 | 44.9 | 2.3 |
| Maximum | 1394.6 | 58.2 | 240 | 56.4 | 133.5 | 482 | 586 | 167 | 38.4 |
| Mean | 951.7 | 45.7 | 183.8 | 24.9 | 92.3 | 419.9 | 236.3 | 86 | 16.6 |
| Median | 1015.2 | 45.3 | 188 | 23 | 83.5 | 426 | 229 | 69.5 | 15.5 |
| North Fork of Solomon River (1947) | |||||||||
| TDS | SiO2 | Ca | Mg | Na+K | HCO3 | SO4 | CI | NO3-N | |
| Minimum | 363 | 25 | 63 | 9.6 | 12 | 290 | 8 | 8 | 0.07 |
| Maximum | 1080 | 41 | 235 | 31 | 154 | 597 | 233 | 119 | 90 |
| Mean | 685 | 31.5 | 135.7 | 19.1 | 65.4 | 397 | 111 | 42.5 | 13.9 |
| Median | 671 | 29 | 122 | 19 | 66 | 378 | 131 | 34 | 4.1 |
| South Fork of Solomon River (1996) | |||||||||
| TDS | SiO2 | Ca | Mg | Na+K | HCO3 | SO4 | CI | NO3-N | |
| Minimum | 576.4 | 24.2 | 135 | 12.5 | 44.3 | 323 | 77.8 | 44.6 | 2.8 |
| Maximum | 1942.6 | 42.7 | 395 | 47.6 | 203.2 | 441 | 587 | 518 | 58.4 |
| Mean | 1044.1 | 32.4 | 209.7 | 27.7 | 98.2 | 374.6 | 283.3 | 141.6 | 14.5 |
| Median | 967.9 | 33.7 | 201 | 23.8 | 82.6 | 379 | 237 | 119.3 | 10.2 |
Comparison of values from the North Fork of the Solomon River for 1996 and 1947 shows a statistical difference between all parameters except for potassium (K) and magnesium (Mg). The difference in concentrations between the two time periods is most likely related to evaporative concentration and recycling of irrigation water and the increased use of fertilizer during the almost 30-year time period.
A visual examination of the water-chemistry samples from 1996 is shown in the trilinear diagram in figure 4 (Piper, 1944; Hem,1985). This graph is constructed by conversion of chemical analyses in mg/L to milliequivalents/L (meq/L) based on the weight and charge of the chemical constituent. Conversion of meq/L to percentage based on the total cation and anion balances permits comparison of the water chemistry on a single diagram. Classification of the water-types is based on the dominant cation-anion sequence that best fits the data.
Figure 4--Trilinear diagram comparing ground-water chemistry of samples from North and South Forks of Solomon River, 1996. North Fork samples have a slightly more calcium bicarbonate component than the South Fork samples. The South Fork samples show somewhat higher chloride and sulfate concentrations. Values are presented as percentages of total cation and anion concentrations.
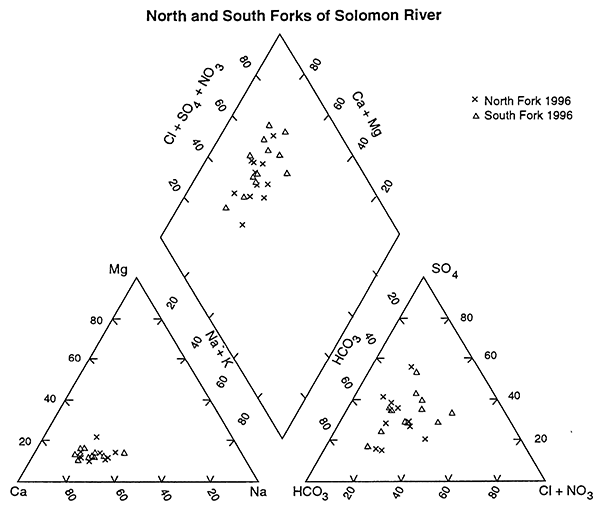
Figure 4 shows the ground-water chemistry from the 1996 data from the two stretches of the Solomon River basin. This figure lends support to the statistical result that the ground water from around the North and South Forks of the Solomon are not different. It appears that some samples from around the South Fork may have water with higher concentrations of chloride and sulfate than samples from the North Fork, although the reason for this is not clear at this time.
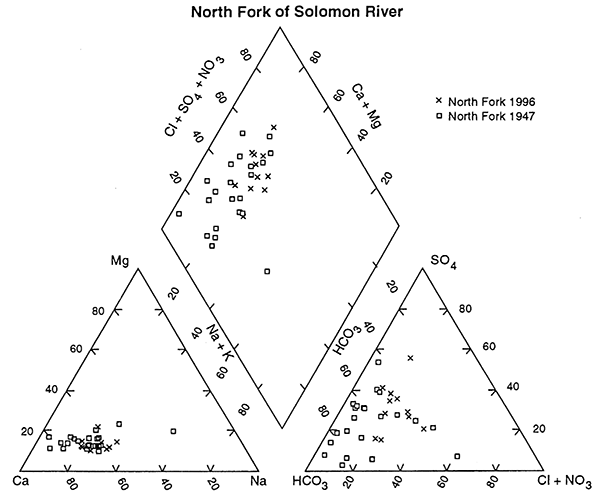
Comparison of only the ground-water chemistry of the North Fork of the Solomon River for 1947 and 1996 supports the statistical result that there has been in a change in the water chemistry over time (fig. 5). The cluster of points at the calcium bicarbonate end of the graph is from the 1947 data and the more general clustering of the 1996 data occurs towards the higher calcium sulfate, chloride water end of the graph, again indicating that changes have occurred over time.
Figure 5--Trilinear diagram of ground-water chemistry samples from North Fork of Solomon River collected in 1947 and 1996. Note that the 1947 samples generally plot in the more calcium bicarbonate field and the 1996 samples plot further into the increased concentrations of chloride, sulfate, and nitrate, suggesting that evaporation concentration processes have occurred in this area. Values are presented as percentages of total cation and anion concentrations.
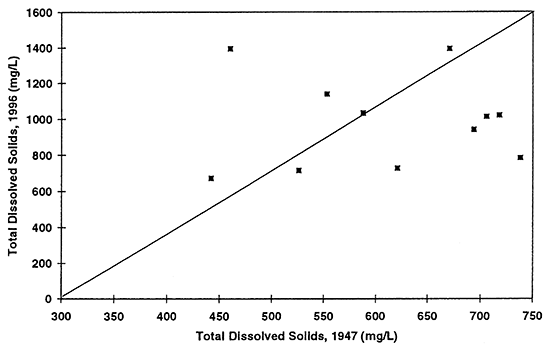
Some additional comparisons of ground-water chemistry are possible between the data collected in 1947 and 1996 for the North Fork of the Solomon River. Figures 6 to 9 show comparisons of water samples collected from similar township, range, and sections (or nearby sections). These wells are not the same wells sampled during both time periods. These graphs show whether there has been an overall increase, decrease, or no change in the concentrations of chloride, sulfate, nitrate, and total dissolved solids. The diagonal line in each graph represents that no change in concentration has occurred during the time period of interest. Values above the line show an increase in concentration, values below the line show a decrease in concentration. Each point represents a comparison of a discrete sample collected during the two years of interest.
Figure 6--Graph shows nitrate-N concentration for ground-water samples from 1947 and 1996. Diagonal line represents no change in concentration. Drinking-water limit is 10 mg/L. Most of the points plot above the equal value line indicating that nitrate-N concentration has increased in the ground water over time.
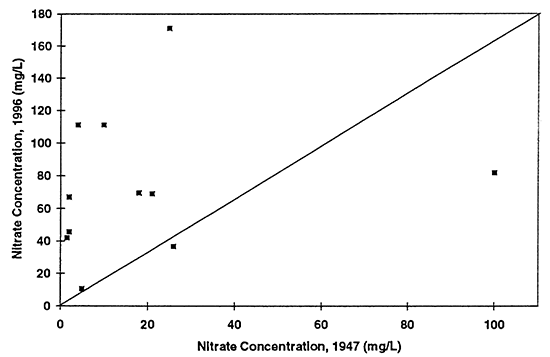
Figure 7--Graph shows relationship between ground-water sulfate concentrations from samples collected in 1947 and 1996. Drinking-water limit is 250 mg/L. Diagonal line represents no change in concentration over time. A few points are above the line indicating increased concentration, while the majority of points are below the line suggesting that natural gypsum in soil or use of gypsum in farming has decreased over time resulting in decreased concentrations over time.
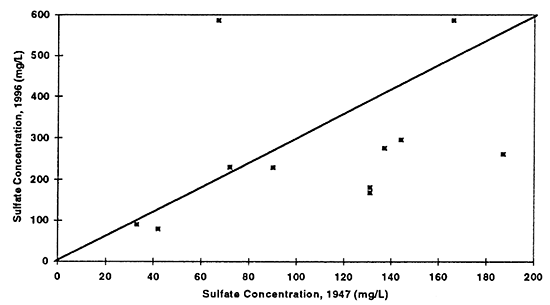
Figure 8--Graph shows chloride concentrations in ground water for 1947 and 1996. Drinking-water limit is 250 mg/L. Diagonal line represents no change in concentration over time. All values are below the drinking-water limit. Presence of a few points above the equal value line suggests that evaporation concentration has occurred resulting in increased values in ground water.
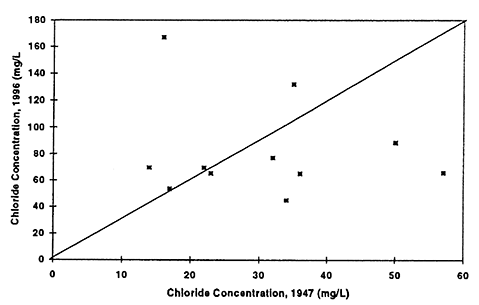
Figure 9--Graph shows total dissolved solids concentration in ground water for 1947 and 1996. Diagonal line represents no change in concentration over time. Presence of a few points above the equal value line suggests that evaporation concentration has occurred resulting in increased values in ground water.
Nitrate-N (fig. 6) shows the most dramatic difference. The majority of points plot above the equal value line indicating that an increase in nitrate-N concentration of the ground water in this area has occurred between 1947 to 1996. The other constituents show some increase in concentrations but also some decreases. Sulfate, chloride, and total dissolved solids are all indicators of evapotranspiration processes and dissolution processes over time.
Simple correlation coefficients were calculated to determine if chloride, sulfate, and nitrate contributed to the specific conductance values observed from the 1996 samples. Table 3 lists the Spearman ρ (rho) nonparametric equivalent to the correlation coefficient and the p value (level of significance of the test) to determine the significance in relation to an α = 0.10. If p ≤ α, then the correlation is considered significant and a relationship is observed between the data. If p ≥ α, then the correlation is considered not significant and no relationship exists between the tested data. Pairs of data that were not correlated are shown by a blank in table 3. A positive correlation coefficient ρ shows an increasing trend.
Table 3--Spearman rho (ρ) values for selected chemical parameters.
| Chemical Parameter |
Chloride | Sulfate | Nitrate |
|---|---|---|---|
| Sulfate | ρ = 0.472 p = 0.026 |
||
| Nitrate | ρ =0.516 p = 0.014 |
||
| Specific Conductance |
ρ = 0.799 p = 0.001 |
ρ = 0.829 p = 0.0001 |
ρ = 0.413 p = 0.05 |
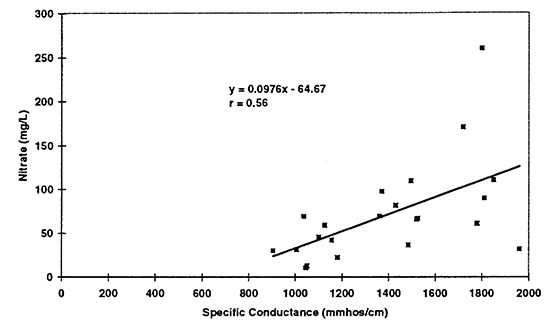
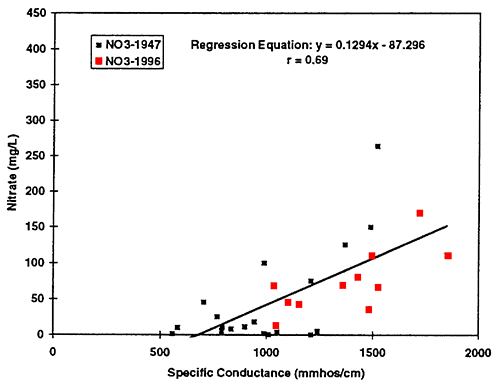
The values in table 3 show an increasing trend in the data. Figures 10 to 12 show the scatter plots for the three constituents mentioned above. Simple linear regression was run on the data for specific conductance and chloride, nitrate, and sulfate from all samples collected in 1996 (23 total). Because no statistical difference was found between the North and South Forks of the Solomon River, all of the data were combined to determine possible trends. The equations for these lines could be used to make a rough calculation of the sulfate, chloride, and nitrate concentration in ground water based on the specific conductance readings. The graph for nitrate and specific conductance shows that an increase in nitrate may result in an increase in specific conductance but it is not as strong a relationship as that of chloride or sulfate.
Figure 10--Simple linear regression of sulfate versus specific conductance for 1996 data. Correlation coefficient of r = 0.79 suggests that sulfate is a strong contributor to total dissolved solids in the ground water as reflected by the specific conductance readings.
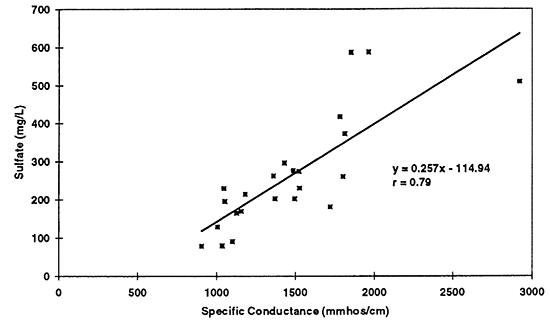
Figure 11--Simple linear regression of chloride versus specific conductance for 1996 data. Correlation coefficient of r = 0.87 suggests that chloride is a strong contributor to total dissolved solids in the ground water as reflected by the specific conductance readings.
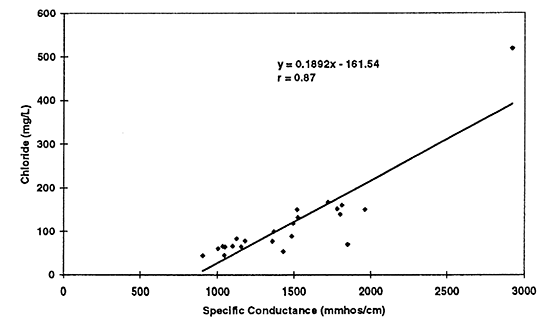
Figure 12--Scatter graph of nitrate (not as nitrate-N) versus specific conductance for 1996 data. Correlation coefficient of r = 0.56 suggests that nitrate contributes to total dissolved solids in the ground water but not to the same degree as sulfate and chloride.
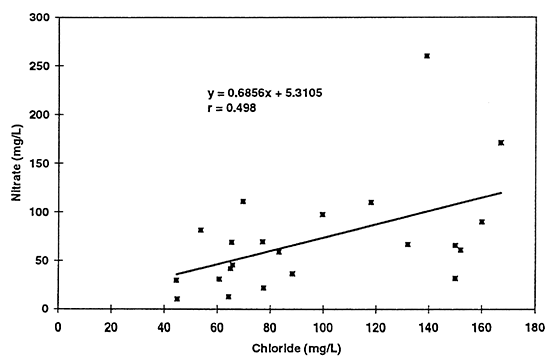
All of the graphs show an increasing trend of pairs of values suggesting the possibility that evaporative concentration processes have an overall impact on the ground-water quality in the area. Of particular curiosity is the correlation of nitrate with chloride concentration (table 3; fig. 13). Potassium chloride is not normally used as a supplemental fertilizer in this area to supply potassium. The fact that both constituents appear to increase in some sort of relationship to each other, again suggests that concentration of salts (including nitrate) may be a result of the use of flood irrigation, which is the dominant form of irrigation in the study area.
Figure 13--Scatter graph of nitrate (not as nitrate-N) with chloride for 1996 data. Correlation coefficient of r = 0.498 suggests that a relationship exists but that a linear model may not be the best fit for the data.
Scatter plots of data collected from ground water in the North Fork of the Solomon River basin illustrate the change in chemistry that has occurred between 1947 and 1996 (figs. 14 to 16). These three graphs support the statistical test results that a difference exists in the overall chemistry between the two time periods. Regression equations were determined for chloride, sulfate, and nitrate using specific conductance as the estimator for the concentrations of these ions in ground water. The figures show an increased trend of concentration of the ions with increased specific conductance, indicating that these ions contribute to the increased salinity of the ground water. The equations developed from this data set should only be used to estimate chemical values from the North Fork of the Solomon River.
Figure 14--Graph shows increased chloride concentration as reflected by increased specific conductance values. Regression equation is useful only for specific conductance values greater than approximately 600 mmhos/cm. Use of the equation at values of less than 600 mmhos/cm will result in spurious chloride concentrations.
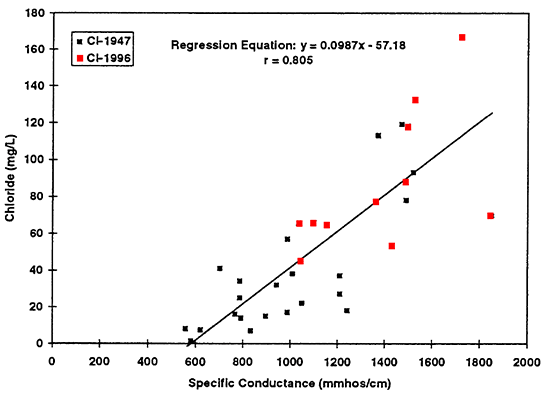
Figure 15--Graph shows increased sulfate concentration as reflected by increased specific conductance values. Regression equation is useful only for specific conductance values greater than approximately 450 mmhos/cm. Use of the equation at values of less than 450 mmhos/cm will result in spurious sulfate concentrations.
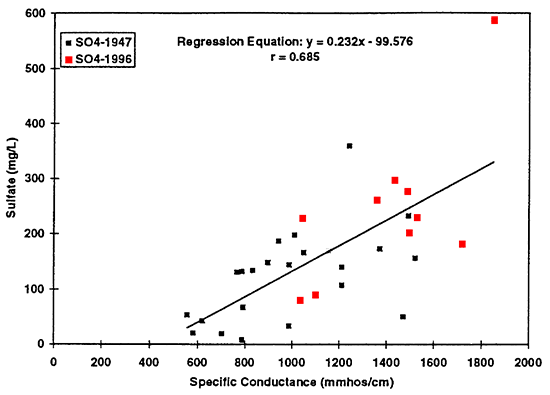
Figure 16--Graph shows increased nitrate concentration as reflected by increased specific conductance values. Regression equation is useful only for specific conductance values greater than approximately 670 mmhos/cm. Use of the equation at values of less than 670 mmhos/cm will result in spurious nitrate concentrations. Nitrate values divided by 4.43 give nitrate-N concentrations.
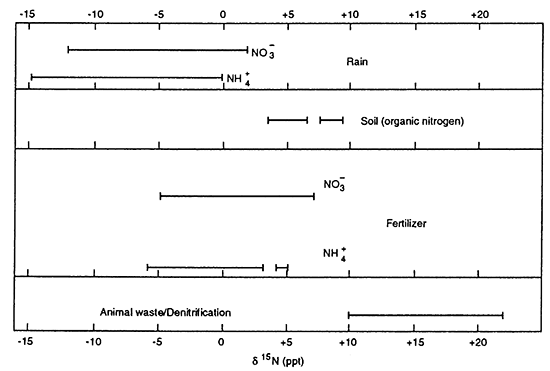
Nitrogen-15 isotopes have been used throughout the United States as a tool for delineating potential sources for nitrate contamination in ground water. Work by Kreitler (1975), Kreitler and Jones (1975), Kreitler (1979), Heaton (1986), Herbel and Spalding (1993), Gormly and Spalding (1979), Spalding and Kitchen (1988), and Spalding and Exner (1993) indicate that nitrogen-15 values from nitrogen species in the vadose zone and ground water can be used for identification of sources of contamination. Figure 17 shows the ranges of δ15N (del (δ) nitrogen-15) for a variety of source materials (after Heaton, 1986). Units for isotope values are in parts per thousand (ppt) which is represented by the symbol ‰. The typical isotope range for fertilizer nitrogen is -5 to +8 ‰. The range for animal waste is + 10 ‰ and above.
Figure 17--Range of δ15N values for different source materials. Fertilizer values range from -5 to +8 ‰ for both ammonium- and nitrate-based fertilizers. Animal waste is generally greater than +10 ‰, usually with a nitrate-N concentration greater than 10 mg/L. Denitrification processes can also result in δ15N greater than + 10 ‰, but nitrate-N values are generally less than 3 mg/L. Nitrogen isotope values obtained from literature review of Heaton (1986).
The δ15N for ammonium-N based fertilizer in Nebraska is approximately -1 ‰ while the δ15N for nitrate-N based fertilizers is approximately +4 ‰ (Gormly and Spalding, 1979). While the actual signature for the fertilizer used in the study area is not available, it is likely that a combination of both ammonium- and nitrate-based fertilizers were used and that the δ15N of the fertilizer would be between -1 ‰ and +4 ‰. This means that any observed increase in the nitrogen isotope value is due to fractionation enrichment of the isotope. Fractionation is the process by which the lighter isotope 14N is preferentially released and the heavier isotope 15N is concentrated in the remaining nitrogen compound whether it is ammonium, nitrate, or organic nitrogen.
Fractionation enrichment can occur by several processes: volatilization of ammonia and then nitrification of the remaining dissolved ammonium ion to nitrate; or denitrification of the nitrate and/or ammonium ion by microbes in which case the nitrate is converted to nitrous oxide or nitrogen gas and removed from the system. Work by Herbel and Spalding (1993) indicated that nitrate that started from fertilizer with an isotopic value of around +1.5 ‰ could obtain a nitrogen isotope value of +8 ‰ because of volatilization and/or denitrification processes. In their study the abundance of carbonate increased in collected cores with depth, indicating that the pH of the system became more alkaline with depth (pH=8.5). This pH is within the range where volatilization of ammonia may occur, thereby enriching the remaining nitrogen compounds with 15N. In the current study, alluvial and terrace deposit sediments are described as having numerous calcareous layers throughout the profile. It is very likely that a similar enrichment process to that found by Herbel and Spalding (1993) may be occurring in the study area. This will be addressed in a later section of this report.
Work by Heaton (1986) and Mariotti et al. (1988) showed that denitrification processes can result in enriched 15N isotope values in the same range as animal waste. However, these studies indicated that generally there is a large decrease in nitrate concentration with an increase in 15N value. Denitrification enrichment up to +20 ‰ with nitrate concentrations of 0.2 mg/L has been observed in ground water in south-central Kansas (Townsend and Sleezer, 1995).
The variability of cause of isotope enrichment means that the use of 15N isotopes for source detection is not a straightforward process. The careful observation of surface geomorphology, stratigraphy, geochemistry of the ground water, and land use need to be included in the evaluation of the data (Townsend et al., 1994).
Geomorphologic processes can affect the thickness of the unsaturated zone, stream-channel morphologies, surface-soil types, and general land forms in an area. Topographic and slope position in a landform were found to be an important factor in determining whether denitrification processes occurred in the Palouse loess in Washington (Geyer et al., 1992). Factors associated with slope position, such as a shallow water table and impeding stratigraphic layers, helped to explain higher denitrification potential at a bottom slope position. Presence of impeding stratigraphic layers such as silt/clay over/under sand zones can permit areas for denitrification if water is perched above a clay or for nitrification of ammonium to nitrate if pH and temperature conditions are correct.
Geochemistry of the ground water (reducing or oxidizing conditions) helps to determine if nitrate concentration will be high or low and whether denitrification might occur. Denitrification is the process of nitrate breakdown by microbes in the soil and lor ground water. Denitrification occurs optimally with a pH around 7, low oxygen concentration, an abundant microbial population, and sufficient organic carbon as an energy source (Paul and Clark, 1989). Presence of very low nitrate concentration, measurable ammonium, iron, and manganese, and a hydrogen sulfur odor were found to be indicators of chemically reducing conditions in ground water in Harvey County, Kansas (Townsend and Sleezer, 1995). These indicators plus the enriched δ15N suggested that denitrification was responsible for the low nitrate concentration in these ground waters. In another portion of the county, these indicators were not present and the nitrate concentrations were high with enriched nitrogen isotopes above +10 ‰ because of animal-waste point sources.
Land-use observations and farm-chemical-use records are important for categorizing the possible source materials responsible for the observed nitrate in the ground water. Use of fertilizer alone or in combination with manure will result in different isotopic signatures in the soil and ground water. Presence of septic system lateral fields, abandoned septic systems, feedlots, abandoned feedlots, or manure storage facilities would provide sources for an animal-waste isotope signature (+10 ‰) and an observable high nitrate-N concentration in the ground water (Kreitler, 1975; Townsend and Sleezer, 1995). In general, the presence of nitrate-N in ground water at concentrations of greater than 3 mg/L indicates that an anthropogenic source is impacting the ground-water system (Madison and Brunett, 1985).
Most of the studies cited above deal with areas with shallow water tables of 20 to 50 ft depths. The depth to water in this study ranged from 15 to 30 ft (S. Ross, 1996, personal communication). Because high nitrate values have been observed in a number of municipal wells in the area, it seemed appropriate to use nitrogen-15 to try to identify sources for the nitrate. Table 4 gives the site id number, nitrate value, nitrogen-15 isotope value, depth of well, and a description of the general land use surrounding the well. As indicated in figure 17 (after Heaton, 1986), the range of δ15N values for fertilizer is from approximately 0 to greater than +8 ‰ with a high nitrate-N concentration. Values of δ15N greater than +10 ‰ and with high nitrate-N concentrations have frequently been observed to occur where an animal-waste source (whether human or animal feedlot) is suspected. Another alternative is that the presence of calcareous sediments plus application of fertilizer in the warmer months of the year has resulted in conditions conducive to volatilization of the anhydrous fertilizer. This condition results in fractionation of the isotope and thus enriched nitrogen-15 values in the remaining nitrate, which then migrates downward over time to result in enriched, high levels of nitrate in the ground water.
Table 4-- Nitrate-N and nitrogen isotope data for wells sampled in 1996.
| ID Number |
Nitrate-N (mg/L) |
δ15N ‰ |
Depth (feet) |
Bacterial Screening |
Description of Site Around Well |
|---|---|---|---|---|---|
| P-1 | 7.2 | 7.9 | 80 | Absent | Septic system not near well. Alfalfa field upgradient of farmstead. |
| P-2 | 2.8 | 12.8 | 60 | Present | Well near cattle stock tank. Irrigated and dryland fields nearby. |
| P-3 | 6.9 | 7.4 | 35 | Absent | Well located near garden. Irrigated fields. Septic system not near well. |
| P-4 | 14.8 | 9.1 | 30 | Present | Irrigated fields around farmstead. Dug well. Possible livestock in the past. |
| P-5 | 13.7 | 14.3 | 60 | Absent | Well upgradient of septic system. Irrigated fields around farmstead. |
| P-6 | 4.9 | 9.4 | 30 | Absent | Well upgradient of cattle pens and septic system. Dryland fields nearby. |
| P-7 | 20.2 | 8.2 | 25 | Absent | Dug well. Septic system not nearby. Irrigated fields and cattle pens near well. |
| P-8 | 24.9 | 10.9 | 70 | Absent | Well near septic system and animal pens. |
| P-9 | 38.4 | 13.5 | 47 | Absent | Well in aarden. Irrigated fields nearby. |
| P-10 | 15.6 | 11.05 | 60 | Absent | Irrigated fields. Well upgradient of stock pens and septic system. |
| P-11 | 18.3 | 13.5 | 55 | Absent | Livestock pens nearby. Irrigated fields surround farmstead. |
| P-12 | 10.2 | 11.9 | 30 | Absent | Well upgradient of septic system. Calf pens downgradient of well. Overpumping might induce contamination. Irrigated fields around farmstead. |
| P-13 | 2.3 | 10.9 | 90 | Absent | Well on hill with stock pen nearby. Irrigated fields. |
| P-14 | 24.7 | 13.35 | 60 | Present | Septic system not nearby. Cattle pens and irrigated fields nearby. Well 50+ years old. |
| P-15 | 8.2 | 13.7 | 74 | Absent | Kirwin City well. Grain elevators close by. Coop elevator nearby. Irrigation around town. Possible fertilizer spill in 1960s. |
| P-16 | 9.4 | 12.7 | 55 | Absent | Gaylord well. Near dryland and irrigated fields. Farmstead upgradient. |
| P-17 | 15.03 | 13.05 | 55 | Absent | Portis. City on septic systems. Ground-water flow to SE to river. Dryland farms nearby, community center nearby. Coop upgradient. |
| P-18 | 15.5 | 8.9 | 94 | Absent | Downs. Irrigated and dryland fields around well. Feedlots 1/2 to 1 mile upgradient, |
| P-19 | 21.9 | 8.1 | 50 | Absent | Osborne. Irrigated and dryland fields around well. Cattle sale barn about 1/4 mile away. |
| P-20 | 58.4 | 12.06 | 53 | Present | Alton. Old well, dug. Old homesteads nearby. Dryland fields. |
| P-21 | 2.8 | 17.2 | 50 | Not Done | Stockton. Old fertilizer plant west of town. Dryland farms and cattle rotated through area. Coop NE of well. |
| P-22 | 6.7 | 7.2 | 59 | Not Done | Woodston. Dryland farms around well. Coop NE of well. Irrigated fields north of town. |
| P-23 | 13.3 | 6.15 | 36 | Not Done | Osborne Rural Water District 1A. Nearby irrigation wells have nitrate-N > 10 mq/L. |
The δ15N values were plotted against both nitrate and depth of well and no correlation was observed. Also, no correlation was observed between nitrate concentration and depth of well sampled. The sample size possibly is too small to observe correlations but, multiple sources of nitrate more likely are interacting to result in the observed values and thus do not permit determination of a specific source for all samples.
Presence or absence of coliform bacteria in the ground water was tested by personnel from the Phillips County Health Department LEPP program as discussed in the Methods section of this report. The results of this test are listed in tables 4 and in appendix A, table A-1. These data, along with the nitrogen-15 data, help to clarify to some extent possible sources of nitrate in the ground water.
Ground-water samples from the study area were tested for the herbicide atrazine as another possible indicator of agrichemical contamination reaching the ground water. The results of the atrazine analyses were negative (not present) for all of the samples (appendix A; table A-1). Considering the quantity and type of clays (bentonitic and montmorillonitic) present in the alluvial and terrace deposits, it is likely that the atrazine was bound to the clays and did not migrate through the unsaturated zone to the ground water. However, possible attachment of the atrazine to clays or organic matter in the unsaturated zone provided sites for breakdown of atrazine into its daughter products. The Kansas Department of Agriculture, Division of Laboratories, . does not have the technology available at this time to determine the occurrence of daughter products of atrazine. If future work is done in this area, obtaining analyses for daughter products in order to determine the fate of atrazine in the soil and ground water would be useful.
The samples that appear to fall most readily into the fertilizer and/or natural soil range for δ15N are sites P-1, P-3, P-6, P-7, P-18, P-19, P-22, and P-23. The range of δ15N for these sites is from 6.2 to 9.4 and the nitrate-N from 4.9 to 14.8. Most of these sites have irrigated fields nearby or another possible natural source of nitrogen such as alfalfa fields that would result in the observed range of nitrogen-15 values. A few of the wells have the possibility of livestock present in the past or a potential commercial source of nitrate nearby. The nitrogen-15 values could also represent a mixture of fertilizer and natural soil nitrogen. These wells range in depth from 25 to 94 ft and do not have coliform present in the water. The lack of coliform may indicate that animal waste was not a significant nitrate source.
Another grouping of samples are those that appear to be influenced by animal waste whether it is from septic tanks or animal waste. These sites also have coliform bacteria present in the water samples. These sites are P-4, P-14, and P-20. These three wells are 30 to 60 ft in depth. Two of the wells are hand dug. One has a windmill attached suggesting that at one time livestock may have been present in the area. Site P-20, the City of Alton well, is located near two abandoned homesteads that may have decayed septic systems leaking to the ground water. This well is located to the west of the city and the dominant ground-water flow is to the east-southeast suggesting that any septic waste from the city as a whole would generally move away from this well site. Site P-14 is an old well, with cattle pens upgradient of the well. It is an old farmstead and the high nitrate and δ15N values may be related to past waste storage practices at the farmstead. Site P-17 (City of Portis) did not have coliform present in the well sample but this may have been due to chlorination equipment that entered into the well prior to distribution to the city water system. This well has nitrate-N of 15 mg/L and a δ15N value of +13.05 ‰ which is indicative of possible animal-waste contamination. This city is still on septic systems and the ground-water flow is to the south-southeast with a sizable portion of the city being upgradient of this well and an abandoned community center facility located across the street from this well. In addition, the fields surrounding this well are dryland farmed and have lower fertilizer use than irrigated fields (table 4).
A third group of wells are P-2, P-13, and P-21. These sites have enriched δ15N values (> +10 ‰) but low nitrate-N values (< 3 mg/L). These sites may have denitrification processes occurring in the vadose zone that facilitate breakdown of the nitrate and enrichment of the isotope values. At this time determining if this occurs or not is not possible.
The final group of samples includes P-5, P-8, P-9, P-10, P-11, P-12, P-15, P-16, and P-17. These wells all have nitrate-N concentrations of 8.2 to 38.4 mg/L and δ15N values of +10.9 to +14.3 ‰. No coliform were observed in these water samples. The range of nitrate-N and nitrogen-15 values would suggest the possibility of animal waste as a source for the nitrate. However, most of these sites are located upgradient of septic systems or animal pens and have irrigated fields nearby. These sites possibly are the result of enriched isotopic values from volatilization of ammonia from use of anhydrous ammonia in the irrigated fields surrounding these homesteads.
Volatilization of anhydrous ammonia is likely to occur in calcareous sediments such as occur throughout the study area. From the information obtained in this study, anhydrous ammonia is applied generally in the spring when the maximum moisture, temperature, and bacterial conditions are present for volatilization of ammonia and nitrification of residual ammonium that is not released to the air or used by the plants. Manure is not commonly used as a fertilizer in this area, and although small feedlots are present in the area, the sites are not concentrated in the valley proper of the Solomon River.
A study was undertaken along the North and South Forks of the Solomon River basin from Kirwin Reservoir in Phillips County to Downs, KS, in Osborne County, and from Stockton, KS, in Rooks County to the City of Osborne in Osborne County. The general findings were:
Although the results of the nitrogen-15 analyses are somewhat inconclusive, the combination of the high nitrate-N values, the nitrogen-15 results, and the analysis of the general water chemistry indicating probable evaporative concentration of flood irrigation water indicate that overall, farming and farm-related activities in the area are having an impact on the ground-water quality. The sources of nitrate contamination appear to be multiple and intermixed, which will provide a challenge to attempts to correct the problem.
The results of this preliminary study indicate that further research is needed to better define the possible sources of nitrate to the ground water in the area. Some possible areas for future research are listed below:
Environmental Systems Research Institute (ESRI), 1991, ARC-INFO Users Guide: Version 5.0.11, Redlands, CA.
Geyer, D. J., Keller, C. K., Smith, J. L., and Johnstone, D. L., 1992, Subsurface fate of nitrate as a function of depth and landscape position in Missouri Flat Creek watershed, U.S.A.: Journal of Hydrology, 11:127-147.
Gormly, J. R., and Spalding, R. F., 1979, Sources and concentrations of nitrate-nitrogen in ground water of the central Platte region, Nebraska: Ground Water, 17:291-301.
Heaton, T. H. E., 1986, Isotopic studies of nitrogen pollution in the hydrosphere and atmosphere: a review: Chemical Geology, 59:87-102.
Helsel, D. R., and Hirsch, R. M., 1992, Statistical Methods in Water Resources: Studies in Environmental Science 49, Elsevier, Amsterdam, 529 p.
Hem, J. D., 1985, Study and interpretation of the chemical characteristics of natural water: 3rd edition, U.S. Geological Survey, Water-Supply Paper 2254, 263 p. [available online]
Herbel, M. J., and Spalding, R.F., 1993, Vadose zone fertilizer-derived nitrate and δ15N extracts: Ground Water, 31:376-382.
Johnson, W. C., 1993, Surficial geology and stratigraphy of Phillips County, Kansas, with emphasis on the Quaternary period: Kansas Geological Survey, Technical Series 1, 66 p. [available online]
Kansas Board of Agriculture (KBA), 1946-1995, Kansas fertilizer tonnage report: Available from 1946 to 1995, Division of Inspections, Topeka, KS.
Kreitler, C. W., 1975. Determining the source of nitrate in ground water by nitrogen isotope studies: Texas Bureau of Economic Geology, Report 83, 57 p.
Kreitler, C. W., 1979, Nitrogen-isotope ratio studies of soils and ground-water nitrate from alluvial fan aquifers in Texas: Journal of Hydrology, 42:147-170.
Kreitler, C. W., and Jones, D. C., 1975, Natural soil nitrate: the cause of the nitrate contamination of ground water in Runnels County, Texas: Ground Water, 13:1:53-61.
Leonard, A., 1952, Geology and ground-water resources of the North Fork Solomon River in Mitchell, Osborne, Smith, and Phillips counties, Kansas: Kansas Geological Survey, Bulletin 98, 150 p. [available online]
Madison, R. J., and Brunett, J. O., 1985, Overview of the occurrence of nitrate in ground water of the United States; in, National water summary 1984 hydrologic events, selected water-quality trends, and ground-water resources. U.S. Geological Survey, Water-Supply Paper 2275, p. 93-105. [available online]
Mariotti, A., Landreau, A., and Simon, B., 1988, Nitrogen-15 biogeochemistry and natural denitrification processes in groundwater: application to the Chalk aquifer of northern France: Geochimica et Cosmochimica Acta, 52:1869-1878.
McClain, T. J., Sophocleous, M., Bassler, R. E., Bader, C., and Mitchell, J. E., 1995, Solomon basin study, report to the Kansas Water Office: Kansas Geological Survey, Open-file Report 95-38, 148 p.
Paul, E. A., and Clark, F. E., 1989, Soil Microbiology and Biochemistry: Academic Press, New York, p. 149-165.
Piper, A. M., 1944, A graphic procedure in the geochemical interpretation of water analyses: American Geophysical Union, Transactions, 25:914-923.
SAS Institute, Inc., 1991, Master index to SAS system documentation: Version 6.09, Third edition, Gary, North Carolina.
Siegel, S., 1956, Nonparametric Statistics for the Behavioral Sciences: McGraw-Hill Book Co., New York, 312 p.
Spalding, R. F., and Exner, M. E., 1993, Occurrence of nitrate in ground water--a review: Journal of Environmental Quality, 22:392-402.
Spalding, R. F., and Kitchen, L. A., 1988, Nitrate in the intermediate vadose zone beneath irrigated cropland: Ground Water Monitoring Review, 7(2):89-95.
Townsend, M. A., and Sleezer, R. O., 1995, Pollution prevention demonstration project Harvey County, Kansas: EPA final report, Kansas Geological Survey, Open-file Report 95-74, 130 p.
Townsend, M. A., Macko, S. A., Young, D. P., and Sleezer, D. O., 1994, Natural 15N isotopic signatures in ground water: a cautionary note on interpretation: Kansas Geological Survey, Open-file Report 94-29, 24 p.
U.S. Bureau of Reclamation, 1984, Solomon River basin water management study, Kansas: Special Report, April 1984.
Table A-1--Chemical Analyses of ground-water from North and South Forks of Solomon River, 1996
| Sample ID |
Date Collected |
Legal Location T-R-Sec |
TDS mg/l |
Sp. Cond. µmhos/cm |
Lab pH |
SiO2 mg/l |
Ca mg/l |
Mg mg/l |
Na mg/l |
K mg/l |
Sr mg/l |
|---|---|---|---|---|---|---|---|---|---|---|---|
| P1 | 3/19/1996 | 7S-18W-21AA | 1450.6 | 1960 | 7.60 | 36.4 | 307 | 46.7 | 88.3 | 10.4 | 3.50 |
| P2 | 3/19/1996 | 7S-17W-20B | 1942.6 | 2920 | 7.50 | 42.7 | 395 | 47.6 | 183 | 13.9 | 3.78 |
| P3 | 3/19/1996 | 7S-16W-16AA | 654.4 | 1005 | 7.80 | 29.5 | 138 | 16.3 | 58.2 | 5.8 | 1.50 |
| P4 | 3/19/1996 | 7S-12W-23AA | 1007.1 | 1520 | 7.60 | 27 | 208 | 23.3 | 83 | 5.6 | 1.60 |
| P5 | 3/19/1996 | 7S-13W-18DA | 1248.7 | 1780 | 7.70 | 24.2 | 257 | 40.1 | 80.3 | 13.3 | 2.97 |
| P6 | 3/19/1996 | 7S-14W-8A | 779.5 | 1180 | 7.80 | 26.4 | 163 | 18.7 | 65.8 | 4.8 | 1.77 |
| P7 | 3/19/1996 | 7S-15W-8CC | 1253.6 | 1810 | 7.80 | 34.7 | 194 | 33.9 | 159 | 20.2 | 1.42 |
| P8 | 3/20/1996 | 4S-16W-25C | 1394.7 | 1850 | 7.60 | 31.8 | 240 | 56.4 | 103 | 7.7 | 3.73 |
| P9 | 3/20/1996 | 5S-15W-5BD | 1139.6 | 1720 | 7.40 | 38.7 | 235 | 21.8 | 96.7 | 6.6 | 1.69 |
| P10 | 3/20/1996 | 5S-14W-12CB | 943.6 | 1360 | 7.75 | 38.6 | 198 | 27.1 | 59.7 | 9.4 | 1.66 |
| P11 | 3/20/1996 | 5S-13W-17BC | 1015.3 | 1430 | 7.70 | 48.6 | 200 | 24.3 | 74.1 | 17.9 | 1.46 |
| P12 | 3/20/1996 | 6S-12W-8CD | 715.3 | 1100 | 7.75 | 45.3 | 137 | 15.7 | 77.9 | 9 | 1.24 |
| P13 | 3/20/1996 | 6S-13W-11 | 728.4 | 1045 | 7.80 | 50.5 | 134 | 19.4 | 66.1 | 8.3 | 1.13 |
| P14 | 3/20/1996 | 6S-13W-7 | 1017.6 | 1495 | 7.60 | 58.2 | 215 | 23 | 64.7 | 15.7 | 1.34 |
| P15 | 3/21/1996 | 4S-16W-27CBD | 1022.1 | 1485 | 7.95 | 50.3 | 170 | 28.3 | 113 | 20.5 | 1.53 |
| P16 | 3/21/1996 | 5S-14W-11DCB | 785.5 | 1155 | 7.80 | 45.1 | 156 | 18.5 | 70.2 | 15.8 | 1.60 |
| P17 | 3/21/1996 | 6S-12W-5CBB | 1033.9 | 1525 | 7.80 | 51.2 | 188 | 23.6 | 109 | 18.6 | 1.73 |
| P18 | 3/21/1996 | 6S-11W-21CBB | 672.9 | 1035 | 7.80 | 45.3 | 149 | 16.4 | 45.2 | 6.5 | 0.92 |
| P19 | 3/21/1996 | 7S-12W-19BB | 928.7 | 1370 | 7.80 | 36.6 | 212 | 24.4 | 53.2 | 10.2 | 1.45 |
| P20 | 3/21/1996 | 7S-15W-11AA | 1267.1 | 1800 | 7.80 | 36.8 | 228 | 29.2 | 125 | 11.7 | 2.51 |
| P21 | 3/22/1996 | 7S-18W-23CBD | 696.0 | 1050 | 7.75 | 32.8 | 139 | 17.9 | 63 | 9 | 1.46 |
| P22 | 3/22/1996 | 7S-16W-9DDC | 576.4 | 905 | 7.65 | 34.8 | 135 | 12.5 | 39.5 | 7.4 | 0.83 |
| P23 | 3/22/1996 | 7S-15W-8BD | 724.2 | 1125 | 7.80 | 27.4 | 140 | 21.6 | 60.9 | 7.3 | 1.38 |
| * TDS = Total Dissolved Solids calculated from all analytical chemistry values. * Sp. Cond. = Specific Conductance measured in laboratory. |
|||||||||||
Table A-1 (cont.)--Water Chemistry Analyses from North and South Forks of Solomon River, 1996
| Sample ID |
Date Collected |
Legal Location T-R-Sec |
HCO3 mg/l |
SO4 mg/l |
Cl mg/l |
F mg/l |
NO3-N mg/l |
B ppb* |
Bacterial Screening |
Atrazine Detects |
|
|---|---|---|---|---|---|---|---|---|---|---|---|
| P1 | 3/19/1996 | 7S-18W-21 AA | 384 | 587 | 150 | 0.44 | 7.2 | 117 | Absent | None | |
| P2 | 3/19/1996 | 7S-17W-20B | 441 | 509 | 518 | 0.33 | 2.8 | 84 | Present | None | |
| P3 | 3/19/1996 | 7S-16W-16AA | 376 | 128 | 60.7 | 0.30 | 7.0 | 181 | Absent | None | |
| P4 | 3/19/1996 | 7S-12W-23AA | 342 | 274 | 150 | 0.30 | 14.9 | 99 | Present | None | |
| P5 | 3/19/1996 | 7S-13W-18DA | 407 | 417 | 152 | 0.47 | 13.8 | 184 | Absent | None | |
| P6 | 3/19/1996 | 7S-14W-8A | 376 | 214 | 77.5 | 0.49 | 5.0 | 87 | Absent | None | |
| P7 | 3/19/1996 | 7S-15W-8CC | 382 | 372 | 160 | 0.26 | 20.3 | 258 | Absent | None | |
| P8 | 3/20/1996 | 4S-16W-25C | 376 | 586 | 69.5 | 0.51 | 25.1 | 144 | Absent | None | |
| P9 | 3/20/1996 | 5S-15W-5BD | 447 | 181 | 167 | 0.18 | 38.6 | 157 | Absent | None | |
| P10 | 3/20/1996 | 5S-14W-12CB | 407 | 262 | 77 | 0.42 | 15.7 | 93 | Absent | None | |
| P11 | 3/20/1996 | 5S-13W-17BC | 442 | 296 | 53.6 | 0.19 | 18.4 | 97 | Absent | None | |
| P12 | 3/20/1996 | 6S-12W-8CD | 463 | 89.8 | 65.7 | 0.24 | 10.3 | 154 | Absent | None | |
| P13 | 3/20/1996 | 6S-13W-11 | 334 | 229 | 44.9 | 0.33 | 2.3 | 137 | Absent | None | |
| P14 | 3/20/1996 | 6S-13W-7 | 426 | 202 | 118 | 0.13 | 24.8 | 90 | Present | None | |
| P15 | 3/21/1996 | 4S-16W-27CBD | 482 | 276 | 88.4 | 0.23 | 8.3 | 222 | Absent | None | |
| P16 | 3/21/1996 | 5S-14W-12DCB | 411 | 169 | 64.9 | 0.20 | 9.5 | 138 | Absent | None | |
| P17 | 3/21/1996 | 6S-12W-5CBB | 432 | 230 | 132 | 0.18 | 15.1 | 242 | Absent | None | |
| P18 | 3/21/1996 | 6S-11W-21CBB | 399 | 78.8 | 65.3 | 0.24 | 15.6 | 74 | Absent | None | |
| P19 | 3/21/1996 | 7S-12W-19BB | 389 | 202 | 99.6 | 0.26 | 22.0 | 130 | Absent | None | |
| P20 | 3/21/1996 | 7S-15W-11AA | 355 | 260 | 139 | 0.27 | 58.7 | 82 | Present | None | |
| P21 | 3/22/1996 | 7S-18W-23CBD | 326 | 195 | 64.3 | 0.43 | 2.9 | 39 | Not done | None | |
| P22 | 3/22/1996 | 7S-16W-9DDC | 394 | 77.8 | 44.6 | 0.26 | 6.7 | 75 | Not done | None | |
| P23 | 3/22/1996 | 7S-15W-8BD | 323 | 164 | 83.2 | 0.28 | 13.4 | 143 | Not done | None | |
| * ppb = parts per billion. | |||||||||||
Table A-2--Well location, depth, type, and land owner for sample sites from North and South Forks of Solomon River, 1996
| Sample ID |
Date Collected |
Legal Location T-R-Sec |
Well Depth (ft) |
Well Type |
Owner |
|---|---|---|---|---|---|
| P1 | 3/19/1996 | 7S-18W-21 AAB | 80 | Drilled | D. Baughmann |
| P2 | 3/19/1996 | 7S-17W-20BC | 60 | Drilled | E. Kriley |
| P3 | 3/19/1996 | 7S-16W-16AD | 35 | Drilled | M. Strutt |
| P4 | 3/19/1996 | 7S-12W-23AA | 30 | Dug | D. Darnell |
| P5 | 3/19/1996 | 7S-13W-18DA | 60 | Drilled | R. Bloomer |
| P6 | 3/19/1996 | 7S-14W-8AD | 30 | Dug | J. A. Guttery |
| P7 | 3/19/1996 | 7S-15W-8CC | 25 | Dug | E. Dibble |
| P8 | 3/20/1996 | 4S-16W-25CBD | 70 | Drilled | R. Westbrook |
| P9 | 3/20/1996 | 5S-15W-5BDB | 47 | Drilled | F. Sweat |
| P10 | 3/20/1996 | 5S-14W-12CBC | 60 | Drilled | R. Horning |
| P11 | 3/20/1996 | 5S-13W-17BCC | 55 | Drilled | K. Dannenberg |
| P12 | 3/20/1996 | 6S-12W-8CD | 30 | Dug | S. Noel |
| P13 | 3/20/1996 | 6S-13W-11 | 90 | Drilled | J. Caldwell |
| P14 | 3/20/1996 | 6S-13W-7 | 60 | Drilled | M. Kaiser |
| P15 | 3/21/1996 | 4S-16W-27CBDC | 74 | Drilled | Kirwin #6 |
| P16 | 3/21/1996 | 5S-14W-11DCBD | 55 | Drilled | Gaylord #4 |
| P17 | 3/21/1996 | 6S-12W-5CBB | 55 | Dug | Portis #3 |
| P18 | 3/21/1996 | 6S-11W-21CBB | 94 | Drilled | Downs #8 |
| P19 | 3/21/1996 | 7S-12W-19BBB | 50 | Drilled | Osborne #3 |
| P20 | 3/21/1996 | 7S-15W-11 AA | 53 | Dug | Alton #1 (Old Well) |
| P21 | 3/22/1996 | 7S-18W-23CBD | 50 | Drilled | Stockton #12 |
| P22 | 3/22/1996 | 7S-16W-9DDC | 59 | Drilled | Woodston #3 |
| P23 | 3/22/1996 | 7S-15W-8BD | 36 | Drilled | Osborne RWD 1A |
Kansas Geological Survey, Geohydrology
Placed online Dec. 1, 2016
Comments to webadmin@kgs.ku.edu
The URL for this page is http://www.kgs.ku.edu/Hydro/Publications/1996/OFR96_28/index.html