Kansas Geological Survey, Open-file Report 94-58
KGS Open File Report 94-58
December 1994
The complete report is available as an Adobe Acrobat PDF file (3 MB).
Differences in nitrate concentrations in ground water in two areas in Kansas can be explained by variation in agricultural practices and vadose zone characteristics. Where crop rotation predominates and wide-spread fine-textured layers are present, nitrate levels are often below the drinking water standard. Where irrigated corn is grown and fine-textured layers are discontinuous, nitrate levels are often above the drinking water standard.
The presence of high nitrate in shallow ground water is indicative of the conservative movement of nitrate from the surface to the water table. Lower nitrate concentrations in areas where fine-textured layers are more continuous suggest that retention and/or denitrification can slow the rate of nitrate movement to ground water and decrease the amount available for leaching.
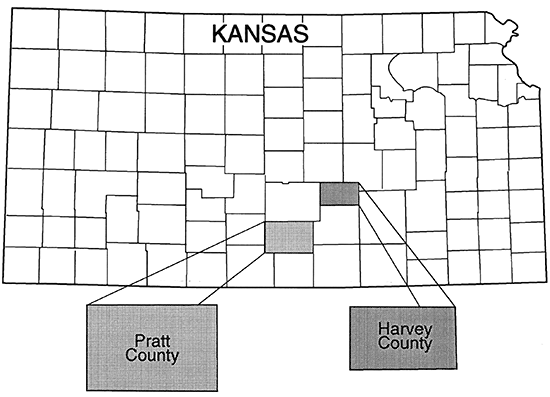
The study areas are located in south-central Kansas in Pratt and Harvey counties (fig. 1). Both areas grow corn, milo, wheat, and soybeans. The major differences between the two areas are (1) the soil/vadose zone stratigraphy; (2) the areal extent of sandy soils used for row crop agriculture; and (3) the difference in cropping practices throughout each area.
Figure 1--Location map of Harvey and Pratt Counties, Kansas.
This paper compares the results from a 5 year study on sandy soils at one site in Pratt County with data from one growing season at 4 sites in Harvey County. Both studies used soil cores and soil water lysimeters to collect information on nitrate-N concentrations in the vadose zone. Ground water samples for nitrate-N analysis were collected from monitoring, domestic, and irrigation wells near both study areas. Nitrogen-15 isotopes were used determine sources for nitrate found in the ground water. Land use practices in terms of fertilizer application and crop grown are only discussed for 1990-1992 in order to simplify the comparison of observed differences in the two counties.
Approximately 31% of the area in the Great Bend Prairie region of south-central Kansas is composed of sandy soils. Much of this area is used for irrigated corn. The major soil at the study site in Pratt County is the Attica fine sandy loam. The Attica series formed in dune sand and is characterized by low clay content, low organic matter concentration, and low cation-exchange capacity.
Farming practices at the Pratt County site include continuous corn, double cropping with winter wheat or rye in the fall as a cover crop, and com/soybeans on a two or three year rotation. Continuous corn was grown at the site for several years prior to the start of the study in 1987. Table 1 shows that a total of 225 kg N/ha was applied to spring and fall crops planted at the site in 1990 and 1991. Fertilizer is applied prior to spring and fall planting usually as anhydrous ammonia. Timing of fertilizer application corresponds with the period of highest precipitation from March to October. This practice, in areas of sandy soils, potentially increases the risk of nitrate movement to ground water.
Table 1--Land Use Practice Pratt County Site 1990-1992
| Year | Spring | Fertilizer | Fall | Fertilizer |
|---|---|---|---|---|
| 1990 | Corn | 112 kg N/ha Anhydrous-NH3 23 kg N/ha 28% N Solution |
Wheat | 90 kg N/ha Anhydrous-NH3 Cover crop |
| 1991 | Corn | 112 kg N/ha Anhydrous-NH3 23 kg N/ha 28% N Solution 1 pint N-Serve |
Rye | 90 kg N/ha Anhydrous-NH3 Cover crop |
| 1992 | Soybeans | Wheat | 90 kg N/ha Anhydrous-NH3 |
Work by Kissel (1982) showed that the period of maximum precipitation in Kansas is from April through September. The potential for nitrate leaching is maximized if fertilizer application corresponds with large rainfall events. High nitrate was found in the soil water and ground water at the site during the period from 1989 to 1992. Results reported from work at the site in 1988-1989 showed the rapid movement of nitrate associated with fertilizer application through the vadose zone to ground water as influenced by precipitation and irrigation (Townsend and Marks, 1990).
Continuous corn was grown for several years prior to the beginning of the study in 1989. In 1989 wheat was grown and after harvest the field was treated with 2,4-D to address a bindweed problem. In the fall of 1989 wheat was planted and then corn in spring of 1990. The effects of variation in crop use of the field, and hence variation in quantity of fertilizer used, were observed by the decreased nitrate-N concentration in the shallow ground water (30 ft; 9 m) from 1989-1992 (fig. 2).
Figure 2--Nitrate-N concentration in ground water from Pratt County, Kansas.
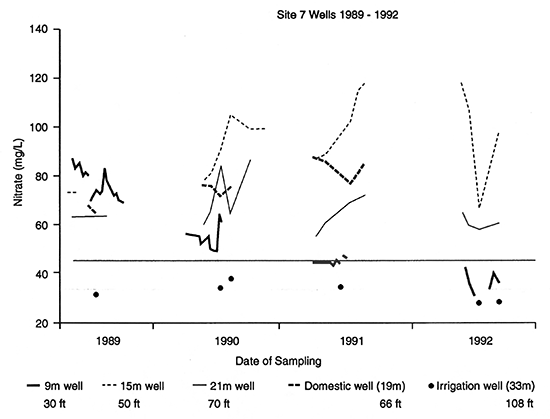
The presence of high nitrate in the shallow ground water in 1989 with decrease over time indicates a response time of several years for nitrate concentration in the shallow ground water to reflect past land use practices. Deeper ground water (50-70 ft; 15-21 m) shows an increase in nitrate-N concentration during the same time period again illustrating a time lag on the movement of nitrate. The presence of nitrate deeper in the aquifer indicates that the discontinuous fine-textured layers in the vadose zone and aquifer are not retarding the movement of nitrate at least to the depth of 70 ft (21 m).
Well logs for the irrigation well, monitoring wells, and domestic well south east of the site indicate the presence of fine-textured strata throughout the vadose zone and aquifer. Previous work at the monitoring site showed that the presence of fine-textured layers slowed the movement of nitrate-N and water in the vadose zone and where these zones are absent nitrate movement moves more rapidly to the ground water (Townsend and Marks, 1990).
Fine-textured horizons deeper in the aquifer may be more continuous. The deeper ground water, as represented by the irrigation well at the site (108 ft; 33 m), shows a fairly stable nitrate-N concentration for the period of study (fig. 3). A new domestic well at the landowner's residence at a depth of 80 ft (24 m) shows several fine-textured zones in the vadose zone and aquifer. The new well has very low nitrate-N concentration (2 mg/L) which supports the idea that fine-textured layers either are protecting deeper ground water or at least slowing the vertical migration of nitrate to deeper ground water.
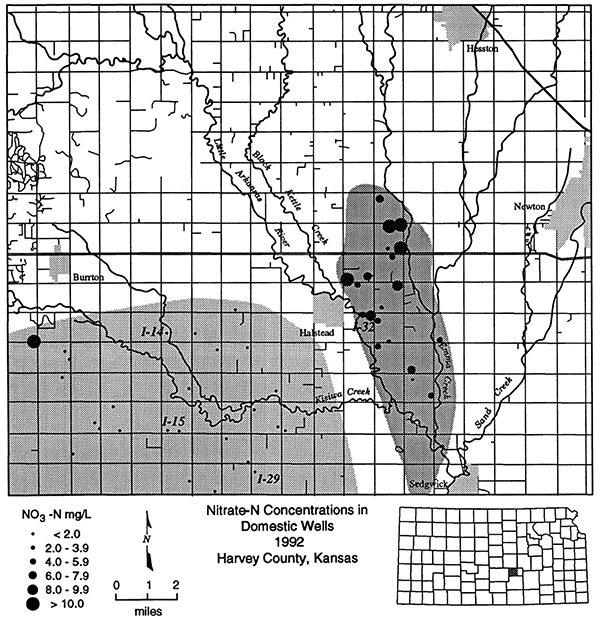
Figure 3--Nitrate-N concentration in domestic wells in Harvey County, Kansas. Soil-water sampling and soil pit sites shown as I-15, I-14, I-29, and I-32.
15N isotope data from the soil-water samplers in the field, monitoring wells, and a downgradient domestic well (60 ft; 18 m) indicate that fertilizer is the major contributor of nitrate-N (δ15N = +3.8 - +5.7 ‰; Heaton, 1986; Gormly and Spalding, 1979; Kreitler, 1979).
In Harvey County, crop rotation of com/soybeans for one to two years with no crops planted during the fall and winter is common practice on irrigated fields. Alfalfa or grain sorghum may also be included in the rotation. Application of fertilizer occurs primarily in February or March with sidedressed application later in the growing season if needed (Table 2). Although the fertilizer application rate is similar to that used in Pratt County, the practice of crop rotation and the potential retention of nitrate in the shallow vadose zone by fine-textured layers permits greater utilization of nitrate-N by crops.
Site I-15 was unusual in that continuous corn was grown here from 1990-1992. However, as figure 3 shows, ground-water nitrate-N concentrations in the vicinity are low.
Table 2--Land Use Practices in Harvey County, 1990-1992
| Site | Season | 1990 | 1991 | 1992 |
|---|---|---|---|---|
| I-14 | Spring | Soybeans 20 kg N/ha |
Corn 223 kg N/ha |
Corn 223 kg N/ha |
| I-15 | Spring | Corn 224 kg N/ha |
Corn 224 kg N/ha |
Corn 224 kg N/ha |
| I-29 | Spring | Alfalfa 0 |
Corn 235 kg N/ha |
Corn 235 kg N/ha |
| I-32 | Spring | Corn 199 kg N/ha |
Corn 199 kg N/ha |
Corn 199 kg N/ha |
In general the nitrate-N content of ground water in Harvey County is below the drinking water limit of 10 mg/L. During a previous study, we divided the county into two areas based on the following criteria: drainage density, continuity of fine-textured strata in the vadose zone, general farming practice in the area, and surface soil texture. The two areas are shown by dark and light gray in figure 3.
The region of dark gray in figure 3 is characterized by higher drainage density with less continuous fine-textured strata in the vadose zone, general water chemistry similar to recharge water, predominantly dryland farming, and generally sandy textured surface soils. These factors combined with a greater density of dairy farms in the area result in a greater risk of possible point source contamination as indicated by high nitrate-N concentrations (20 to 46 mg/L) and 15N isotopes (+10 to +15 ‰) in the animal waste range (Heaton, 1986; Kreitler, 1979; Kreitler, 1975).
The region of light gray in figure 3 is characterized by low drainage density, nearly continuous fine-textured layers in the shallow vadose zone, predominantly irrigated farming, and finer textured surface soils. Ground water chemistry in this area indicates a reducing environment with ammonium present and low nitrate-N (2 mg/L). 15N isotope values (+11 to + 16 ‰) indicate denitrification processes occur either in the unsaturated or saturated zone (Heaton, 1986; Herbel and Spalding, 1993).
The difference in nitrate concentration in ground water from these two areas in Harvey County indicates that fine-textured zones in the vadose zone and aquifer play an important role in decreasing the movement of nitrate to the ground water either by retardation of flow and/or permitting denitrification processes to occur. Conversely, the dissection of fine-textured layers in the vadose zone can permit the conservative movement of nitrate through the vadose zone to the ground-water table.
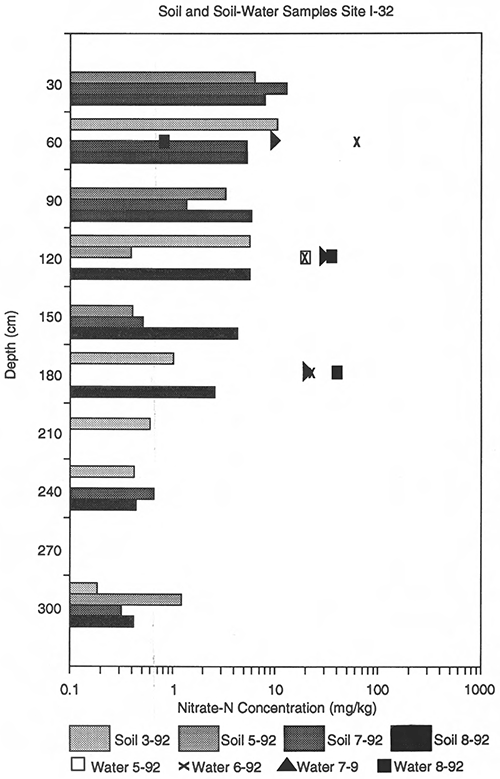
A comparison of the soil stratigraphy at each site in both counties illustrates the stark contrasts in horizonation between sites (figs. 4 to 8). Measurable nitrate-N was found in both soils and soil-water at all sites as indicated in figures 9 to 13. All of the sites presented in this paper had irrigated corn for at least two years. At all of the sites nitrate-N concentration from soil-water samples were higher than those measured in soil samples from the same depth and time period. Based on these observations we assume that the soil water represents the mobile phase of soil nitrate.
The effect of the presence or absence of fine-textured layers on the movement of nitrate and water is indicated by the quantity and nitrate concentration of the sample retrieved from the soil-water samplers (figs. 9 to 13). The impacts of the lack of fine-textured layers on the movement of nitrate and water in the vadose zone are best illustrated by figures 4, 5, 9, and 10. The Pratt County site (site 7) has discontinuous finer-textured layers throughout the soil profile and Site I-29 (Harvey County) lacks fine-textured layers. Both sites show rapid movement of nitrate in soil water to depth. Figures 6 to 8 and 11 to 13 illustrate the effect of fine-textured layers on limiting the movement of water and nitrate below the 1.8 meter depth even though adequate water was available via rainfall or irrigation.
Figure 4--Particle size distribution for Attica soil at site 7, Pratt County.
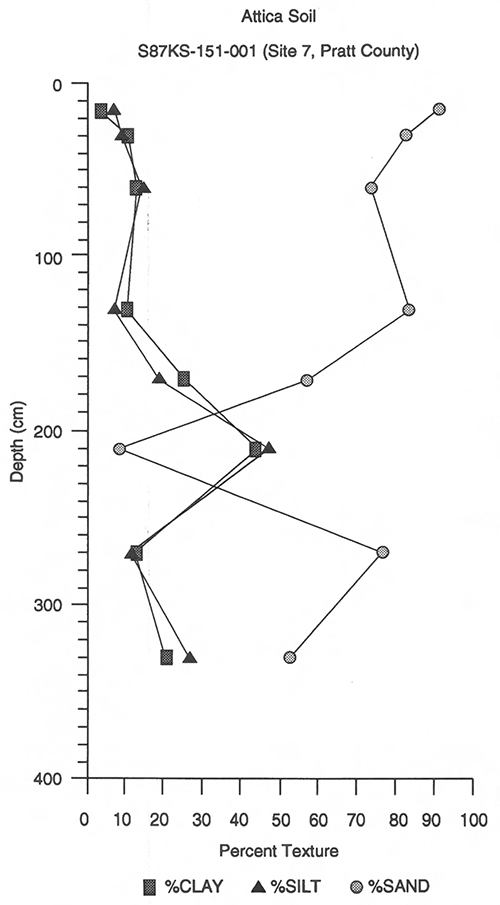
Figure 5--Particle size distribution for Pratt soil at site I-29, Harvey County.
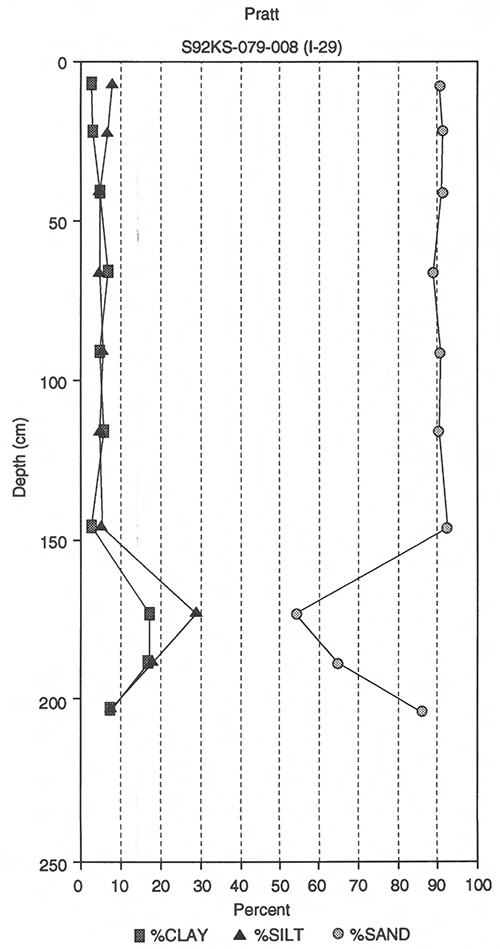
Figure 6--Particle size distribution for Pratt soil at site I-15, Harvey County.
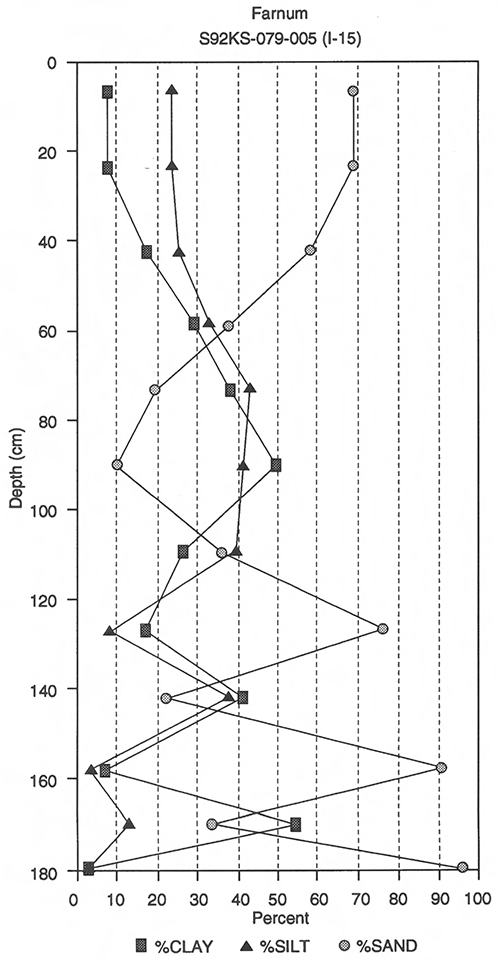
Figure 7--Particle size distribution for Pratt soil at site I-14, Harvey County.
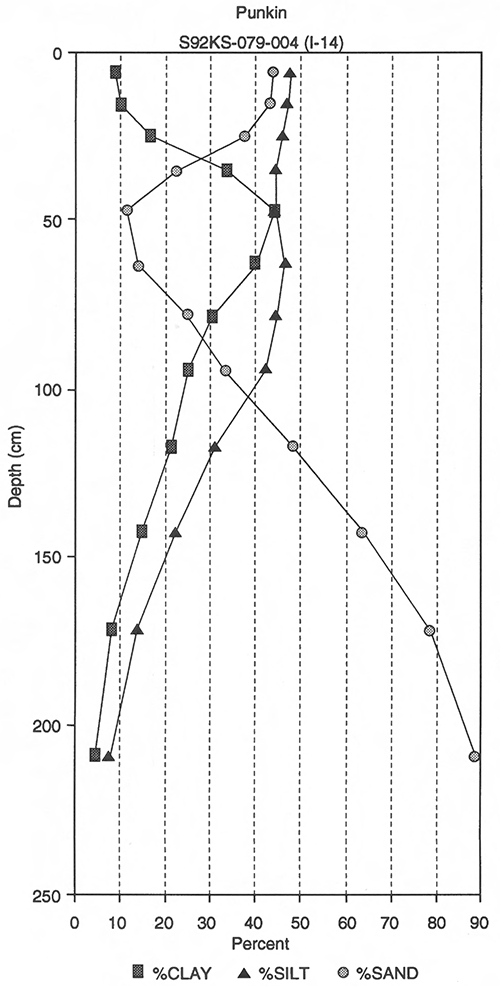
Figure 8--Particle size distribution for Pratt soil at site I-32, Harvey County.
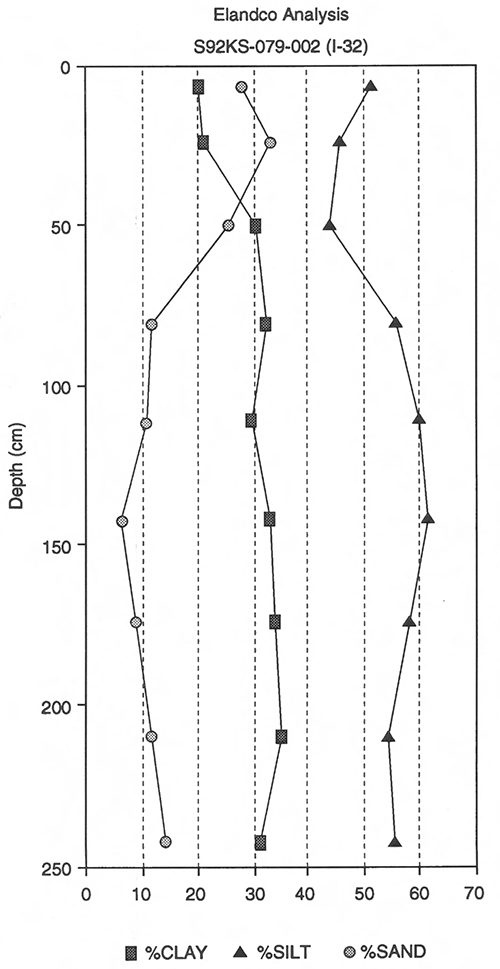
Figure 9--Nitrate-N concentrations from soil-water and soil cores, site 7, Pratt County.
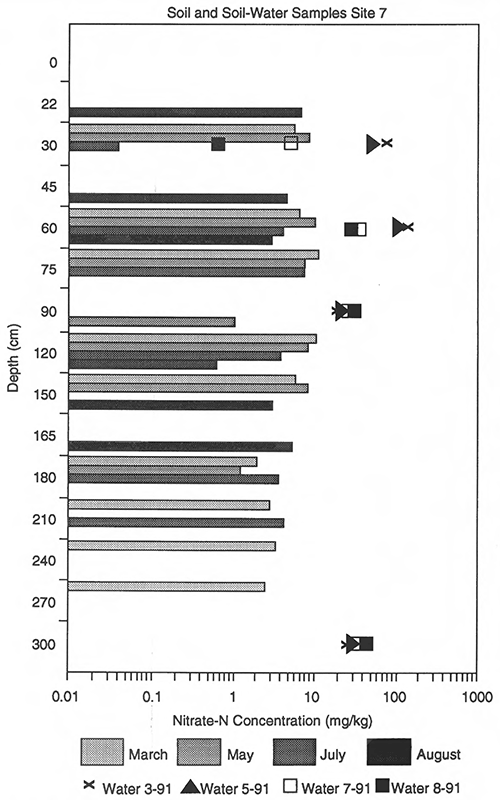
Figure 10--Nitrate-N concentrations from soil-water and soil cores, site I-29, Harvey County.
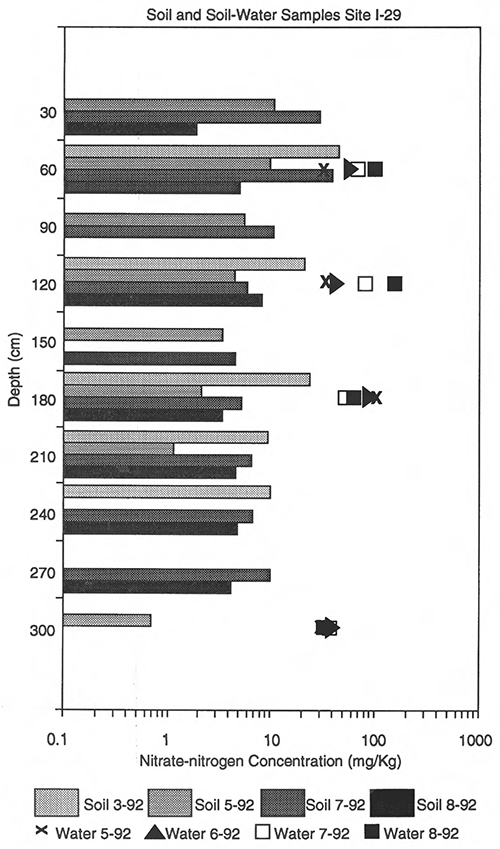
Figure 11--Nitrate-N concentrations from soil-water and soil cores, site I-15, Harvey County.
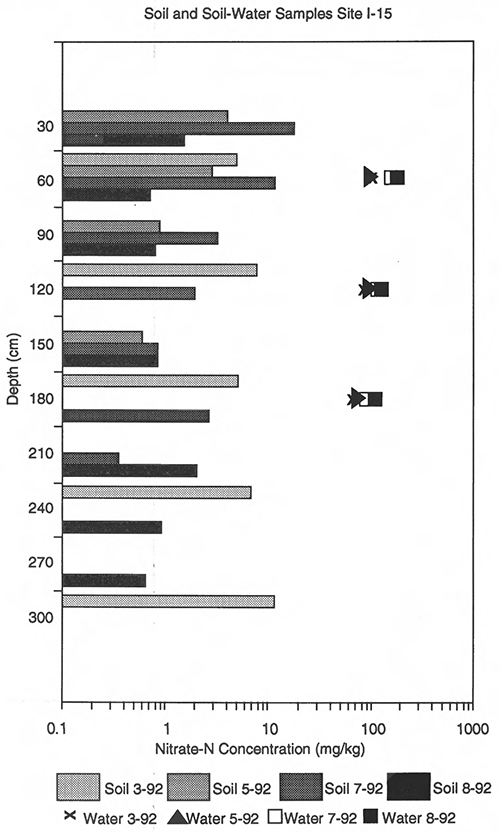
Figure 12--Nitrate-N concentrations from soil-water and soil cores, site I-14, Harvey County.
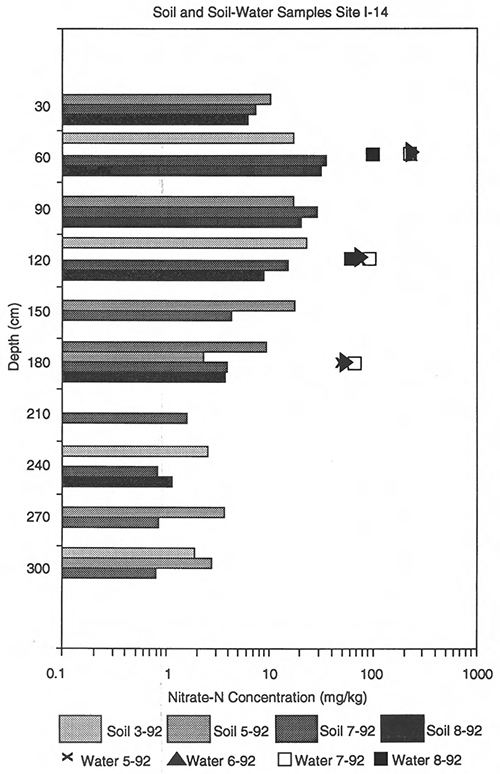
Figure 13--Nitrate-N concentrations from soil-water and soil cores, site I-32, Harvey County.
The presence of continuous fine-textured horizons in the shallow vadose zone results in lower nitrate-N values in ground water because of retardation of flow of water and nitrate and/or denitrification processes. Although the quantity of fertilizer used was similar in both counties, the planting of a single crop per year and crop rotation practices in conjunction with more favorable soil stratigraphy may permit greater utilization of excess nitrate by plants. Nitrate pollution potential is thus reduced by a combination of anthropogenic and natural factors in certain areas of Harvey County. In areas with more permeable soils and discontinuous fine-textured horizons, the timing of fertilizer application with multiple cropping practices in the maximum precipitation period during the spring and fall may increase the risk of nitrate transport to the ground water.
Gormly, J. R, and Spalding, R. F., 1979, Sources and concentrations of nitrate-nitrogen in ground water of the central Platte region, Nebraska: Ground Water, vol. 17, p. 291-301.
Heaton, T. H. E., 1986, Isotopic studies of nitrogen pollution in the hydrosphere and atmosphere: a review: Chemical Geology, vol. 59, p. 87-102.
Herbel, M. J., and Spalding, R. F., 1993, Vadose zone fertilizer-derived nitrate and δ15N extracts: Ground Water, vol. 31, p. 376-382.
Kreitler, C. W., 1975, Determining the source of nitrate in ground water by nitrogen isotope studies: Report 83, Bureau of Economic Geology, Univ. Texas, Austin, 57 p.
Kreitler, C. W., 1979, Nitrogen-isotope ratio studies of soils and groundwater nitrate from alluvial fan aquifers in Texas: Jour. Hydrology, voL 42, p. 147-170.
Townsend, M. A., and Marks, E. T., 1990, Occurrence of nitrate in soil and ground water in sandy soils in south-central Kansas; in, Proceedings of the 1990 Cluster of Conferences, Agricultural impacts on ground water quality, February 20-21, 1990: Natl. Water Well Assoc., Dublin, OH, p. 145-157.
Kansas Geological Survey, Geohydrology
Placed online Nov. 14, 2016
Comments to webadmin@kgs.ku.edu
The URL for this page is http://www.kgs.ku.edu/Hydro/Publications/1994/OFR94_58/index.html