Kansas Geological Survey, Open-file Report 91-59
A Report for the Kansas Water Office and the Kansas Corporation Commission
KGS Open File Report 91-59
First report December, 1991
Addendum September, 1992
Also available as an Acrobat PDF file.
Five water samples were collected by the Kansas Water Office from the Saline and Smoky Hill rivers during low-flow conditions in October, 1991, and sent to the Kansas Geological Survey for geochemical identification of saltwater sources. A concern was whether oil brines were contributing to the natural salinity of the river waters. The description of the sample locations are in Table 1. Information for three samples of Saline River water collected near the Haberer salt marsh in northwest Russell County by Donald Whittemore as part of the Dakota Aquifer Program are also listed in Table 1. The samples are listed in downstream order for each river.
Table 1--Location description for water samples collected from the Saline and Smoky Hill rivers. The samples are listed in downstream order for each river. The first three samples from the Saline River were collected by the Kansas Geological Survey; the other samples were collected by the Kansas Water Office. Locations are in township, range, section, and quarter sections from largest to smallest quarters, where A = NE, B = NW, C = SW, and D = SE.
| Location | Collection date |
Estimated flow, cfs |
Location description |
|---|---|---|---|
| Saline River samples | |||
| 12S 15W 15ABBB | 7-07-88 | N | About 1 mile upstream of Haberer salt marsh |
| 12S 15W 14CAA | 7-07-88 | N | About 100 ft below stream from Haberer salt marsh |
| 12S 15W 13CBA | 7-07-88 | N | At bridge about 1 mile downstream of Haberer salt marsh |
| 12S 14W 34ADDD | 10-29-91 | <1 | At gaging station near bridge of US 281, 4 miles north of Russell |
| 12S 13W 25BCCC | 10-29-91 | <1 | At bridge of road north from Bunker Hill |
| Smoky Hill River samples | |||
| 15S 14W 02BCCC | 10-30-91 | <2 | At bridge of US 281, 6.5 miles south of Russell |
| 14S 13W 32ADAD | 10-30-91 | 2.5 | At bridge of road 4.5 south and 1 mile east of Homer |
| 14S 13W 36ADDA | 10-30-91 | 3 | At bridge of road 5 miles south of Bunker Hill |
| 14S 11W 31BADC | 10-30-91 | 3 | At bridge of road 3 miles south of Dorrance |
| N = flow not estimated | |||
The samples were analyzed for specific conductance and chloride, bromide, sulfate, and fluoride concentrations (Table 2). Also included in Table 2 are the results for the three samples of Saline River water in the vicinity of the Haberer salt marsh.
The salinity of the Saline River water increases and that of the Smoky Hill River decreases downstream in the region for which the data is given. Relative changes in sulfate concentrations generally follow changes in chloride contents of the river waters. Fluoride concentrations do not change appreciably in each river section sampled.
Table 2--Specific conductance and dissolved constituent concentrations for river water samples. The samples are listed in the same order as in Table 1.
| Sample description | Specific conductance, µS/cm |
Cl, mg/L |
SO4, mg/L |
F, mg/L |
Br, mg/L |
|---|---|---|---|---|---|
| Saline River samples | |||||
| Upstream of salt marsh | 2,430 | 405 | 531 | 0.5 | 0.52 |
| At salt marsh | 3,600 | 735 | 595 | 0.6 | 0.69 |
| Downstream of salt marsh | 3,650 | 747 | 601 | 0.6 | 0.7 |
| North of Russell | 16,150 | 4,650 | 1,431 | 0.75 | 1.7 |
| North of Bunker Hill | 25,300 | 7,720 | 2,100 | 0.72 | 1.97 |
| Smoky Hill River samples | |||||
| South of Russell | 7,020 | 1,879 | 530 | 0.56 | 2.69 |
| South of Homer | 6,450 | 1,702 | 538 | 0.55 | 2.29 |
| South of Bunker Hill | 4,590 | 1,184 | 293 | 0.56 | 2.14 |
| South of Dorrance | 4,230 | 1,061 | 313 | 0.55 | 1.92 |
The salinity sources were identified based on mixing curves and background data for halite solutions in Permian strata, ground waters in the Dakota aquifer system, and oil brines in central Kansas. Figure 1 is a plot of the weight ratio of bromide/chloride x 104 versus chloride concentration for the river water samples. Each curve on the diagram represents the conservative mixing between two end-point waters.
Figure 1--Weight Ratio of Bromide/Chloride versus Chloride Concentration. Legend: s Saline River waters; h Smoky Hill River waters.
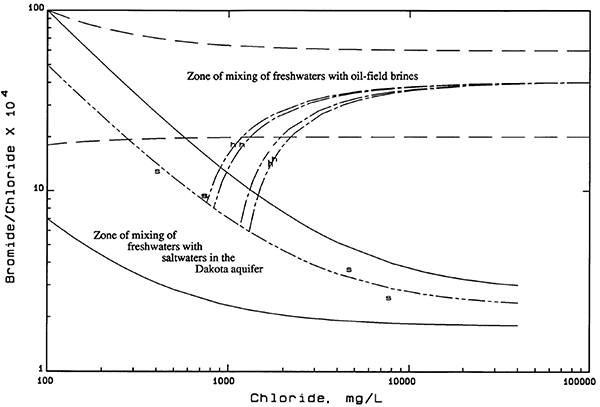
The two solid curves represent the boundaries of a zone of mixing of freshwaters and saltwaters in the Dakota aquifer in Central Kansas. The main source of salinity in Dakota aquifer waters is saltwater from underlying Permian strata, especially the Cedar Hills Sandstone. The points for the Saline River waters plot within the Dakota aquifer zone. The curve with long and short dashes within the Dakota aquifer zone was calculated as best fitting the Saline River samples. The Saline River waters fit well with mixing of freshwaters with a salinity source predominantly from the Dakota aquifer. The amount of any oil-field brine in the river waters, if present, would contribute less than a few percent to the chloride concentration.
The two curves with long dashes in Figure 1 represent the boundaries of the zone of mixing of freshwaters in the Dakota aquifer with most oil brines in central Kansas. The points for the Smoky Hill River samples plot between the mixing zones with oil brines and Dakota aquifer saltwaters, indicating that the source of salinity in the Smoky Hill River appears to be a mixture of freshwater, Dakota aquifer saltwaters, and oil brine. The curves with short and long dashes passing through the points for the Smoky Hill River samples represent the mixing of average oil brine with Dakota ground waters diluted by freshwater. The curves were calculated such that the end point within the Dakota aquifer mixing zone fell on the mixing curve through the Saline River waters. The Saline River mixing curve was felt to best represent the natural chemistry of waters in the Smoky Hill River based on the available data.
The chloride concentrations of the intersections of the curves through the Smoky Hill River points with the Saline River mixing curve represent the natural source in the waters. These values are listed in Table 3 along with the contribution from oil brine calculated as the difference between the natural source and total concentration of chloride. The estimated error in each of the natural and oil-brine sources of chloride concentration in Table 3 is ±100 mg/L. The values in Table 3 are dependent on the true natural mixing curve for the Smoky Hill River and the average bromide/chloride ratio of the oil brines contaminating the waters. A higher oil-brine ratio would give a mixing line with a greater curvature resulting in an interpretation of a higher contribution of natural chloride and a lower percentage of oil-brine contamination. If the mixing curve for natural salinity relationships in the Smoky Hill River were shifted to higher bromide/chloride values than that of the Saline River mixing curve, the result would be similar, i.e., a larger natural and a smaller oil-brine source of chloride.
Table 3--Estimate of the Natural and Oil-Brine Contributions to the Chloride Concentration of the Water Samples from the Smoky Hill River. Values in the table are chloride concentrations in mg/L. The oil-brine percentage is the percent of total chloride that is attributed to an oil-brine source. The estimated error in the natural and oil-brine chloride values is ±100 mg/L.
| Sample description | Chloride, mg/L | Oil brine % |
||
|---|---|---|---|---|
| Total | Natural | Oil brine | ||
| South of Russell | 1,879 | 1,300 | 580 | 28 |
| South of Homer | 1,702 | 1,160 | 540 | 32 |
| South of Bunker Hill | 1,184 | 830 | 350 | 30 |
| South of Dorrance | 1,061 | 760 | 300 | 28 |
The estimated contribution of oil brine to the total chloride concentration of the Smoky Hill River waters is approximately 30% and does not change significantly downstream. This suggests that the oil brine input to the Smoky Hill River is predominantly upstream of all the sample sites. Although the estimated percentages increase to the sampling site south of Homer, then decrease to the site south of Dorrance, the error is thought to be greater in the estimates than the differences in the percentage values. If the differences are significant, then they suggest that some oil brine is entering the river just upstream of the site south of Homer while the river water is being diluted by additional freshwaters.
Although the sulfate concentrations increase appreciably, the sulfate/chloride ratios of the Saline River waters decrease from upstream of the Haberer salt marsh to the downstream site north of Bunker Hill. The ratio at the site north of Bunker Hill is still much greater than the very low ratios for most oil brines in central Kansas. The sulfate/chloride ratio reflects the input of the sodium-chloride water with high sulfate contents in the saltwater-containing portions of the Dakota aquifer. Sulfate concentrations generally decrease while sulfate/chloride ratios remain relatively constant downstream in the section of the Smoky Hill River sampled. The sulfate/chloride ratios are in the same range as those for the Saline River waters north of Russell and Bunker Hill. If the oil brine contribution to the chloride and sulfate were subtracted from the Smoky Hill River samples, the sulfate/chloride ratios would be higher and closer to the range expected for Saline River waters with chloride concentrations between 1,000 and 1,800 mg/L.
The fluoride concentrations are lower in both river water samples than in ground water in the Dakota aquifer in the vicinity of the sampling sites. This reflects dilution of the Dakota aquifer water entering the base of the alluvium with freshwaters in the alluvium derived from direct recharge or recharge through outcropping strata overlying the Dakota Formation.
There is no detectable oil brine in the Saline River waters collected at low flow in Russell County. Oil brines contribute approximately 30% of the total chloride concentration in the Smoky Hill River waters collected at low flow between south of Russell to south of Dorrance. Most of the oil-brine source of chloride is probably entering the Smoky Hill River upstream of the bridge at US 281 south of Russell.
Samples of the Smoky Hill River waters should be collected at low flow upstream of the bridge at US 281 south of Russell to establish where the main oil-brine contribution to the salinity is entering the river. The possible sources of the oil brine might be (1) saltwater plumes in the alluvium from past disposal of oil brines in surface ponds and in ditches in the floodplain of the river and tributary streams, (2) saltwater from oil-producing zones flowing up poorly plugged or unplugged boreholes under increased pressures from water flooding operations, and/or (3) intrusion of saltwater from the Dakota aquifer contaminated by past oil-brine disposal into the Dakota aquifer system or the Cedar Hills Sandstone. These possibilities should be investigated to determine the most likely source(s). Samples from wells in the Smoky Hill River alluvium and the Dakota aquifer underlying the alluvium could also be collected to help interpret the source of the oil brine contamination.
Water samples were collected by the Kansas Water Office in January, 1992 from the Smoky Hill River, the South Fork of the Solomon River, wastewater effluents of Stockton and Hays, and a well in the Cedar Hills Sandstone. The samples were analyzed at the Kansas Geological Survey and the source of the salinity in the samples was determined by multicomponent mixing curves. Addendum Table 1 lists the results of the analyses and Addendum Table 2 gives the interpretation of the data. The procedures are similar to those in KGS Open-File Report 91-59 of December, 1991 which reported the results and salinity interpretation of water samples collected by the Kansas Water Office in October, 1991 from the Smoky Hill and Saline rivers in Russell County. The oil-brine contribution to the salinity in the Smoky Hill River samples collected in October, 1991 has been revised in this current report as a result of the data for the waters collected upstream of the earlier samples. The interpretation of the salinity source (essentially all natural ground-water intrusion) for the Saline River waters remains the same as in the December, 1991 report.
Addendum Table 1--Analytical Data for Samples Collected from the Smoky Hill River and South Fork Solomon River Basins January, 1992. Additional samples include a wastewater discharge that enters the river in each basin, and a subsurface sample from the Cedar Hills Sandstone. The river-water samples are listed in downstream order.
| Sample description | Specific conductance, µS/cm |
Cl, mg/L |
SO4, mg/L |
F, mg/L |
Br, mg/L |
|---|---|---|---|---|---|
| Smoky Hill River | |||||
| 1E of Pfeifer | 1,790 | 134.1 | 633 | 0.28 | Int. |
| 3W of Russell County line | 2,440 | 408.5 | 422 | 0.90 | 0.240 |
| 1E of Ellis County line | 3,310 | 723.9 | 399 | 0.80 | 0.320 |
| 4E of Ellis County line | 3,500 | 760.5 | 401 | 0.89 | 0.310 |
| Above jet. with Big Creek | 6,810 | 1781.0 | 556 | 0.75 | 0.500 |
| Big Creek near jet. | 1,800 | 329.9 | 203 | 0.59 | 0.576 |
| 2W of US 283 Highway | 3,800 | 909.9 | 340 | 0.64 | 0.688 |
| US 281 Highway, S of Russell | 3,600 | 843.3 | 328 | 0.63 | 0.744 |
| South of Homer | 3,310 | 790.0 | 293 | 0.58 | 0.976 |
| Bunker Hill Road | 3,200 | 746.1 | 268 | 0.53 | 1.040 |
| South of Dorrance | 3,700 | 902.4 | 292 | 0.51 | 1.160 |
| Hays wastewater | 1,690 | 219.7 | 299 | 1.02 | 0.158 |
| South Fork Solomon River | |||||
| 1E of Graham County line | 1,645 | 156.6 | 281 | 0.40 | 0.277 |
| 3W of Stockton | 1,380 | 137.8 | 318 | 0.39 | 0.207 |
| Just south of Stockton | 1,650 | 234.2 | 260 | 0.30 | 0.162 |
| South of Woodston at gage | 1,450 | 148.1 | 298 | 0.30 | 0.278 |
| South of Alton | 1,165 | 100.6 | 255 | 0.29 | 0.196 |
| South of Bloomington | 1,135 | 89.4 | 229 | 0.28 | 0.180 |
| Osborne at gage | 1,125 | 87.5 | 229 | 0.27 | 0.178 |
| North of Corinth | 1,145 | 88.4 | 232 | 0.26 | 0.177 |
| Stockton wastewater | 3,300 | 638.3 | 371 | 0.38 | 0.185 |
| Cedar Hills Sandstone well | 52,600 | 18,420.0 | 4,937 | 0.94 | 7.900 |
| Int. = Interference in analysis of sample for bromide | |||||
Addendum Table 2--Estimate of the natural and oil-brine contributions to the chloride concentration of the water samples from the Smoky Hill and Solomon rivers. The oil-brine percentage is the percent of total chloride that is attributed to an oil-brine source. The estimated error in the chloride concentration percentage estimates for the oil brine contribution is plus or minus the percentage listed up to a maximum of ±20%.
| Sample description | Chloride, mg/L | Oil brine % |
|||
|---|---|---|---|---|---|
| Total | Natural | Waste effluent |
Oil brine | ||
| Smoky Hill River samples collected October 1, 1991 | |||||
| South of Russell, US 283 | 1,879 | 1,350 | b | 530 | 28 |
| South of Homer | 1,702 | 1,250 | b | 450 | 26 |
| South of Bunker Hill | 1,184 | 730 | b | 450 | 38 |
| South of Dorrance | 1,061 | 670 | b | 390 | 37 |
| Smoky Hill River samples collected January 1, 1992 | |||||
| 1E of Pfeifer | 134 | 134 | c | d | d |
| 3W of Russell County line | 408 | 408 | c | <20 | <5 |
| 1E of Ellis County line | 724 | 724 | c | <30 | <5 |
| 4E of Ellis County line | 760 | 760 | c | <40 | <5 |
| Above jet. with Big Creek | 1,781 | 1,781 | c | <90 | <5 |
| Big Creek near jet. | 330 | 230 | b | 100 | 30 |
| 2W of US 281 Highway | 910 | 810 | b | 100 | 11 |
| South of Russell, US 281 | 843 | 740 | b | 100 | 12 |
| South of Homer | 790 | 640 | b | 150 | 19 |
| Bunker Hill Road | 746 | 560 | b | 190 | 25 |
| South of Dorrance | 902 | 700 | b | 200 | 22 |
| South Fork Solomon River samples collected January 1992 | |||||
| 1E of Graham County line | 157 | 157 | c | <10 | <10 |
| 3W of Stockton | 138 | 138 | c | <10 | <10 |
| Just south of Stockton | 234 | 140 | 90 | <10 | <5 |
| South of Woodston @ gage | 148 | >130 | <20 | <10 | <10 |
| South of Alton | 101 | >90 | <10 | <10 | <10 |
| South of Bloomington | 89.4 | >80 | <10 | <10 | <10 |
| Osborne @ gage | 87.5 | >80 | <10 | <10 | <10 |
| North of Corinth | 88.4 | >80 | <10 | <10 | <10 |
| b = Amount contributed by any waste effluent is probably less than a few percent. c = Amount contributed by any waste effluent is unknown, but probably small. d = Percentage could not be calculated due to interference in bromide determination. |
|||||
Waters from the South Fork of the Solomon River in Rooks and Osborne counties contain a greater concentration of sulfate (in mg/L) than chloride. The main influence on the major dissolved constituents is probably mineralized ground-water discharge from Upper Cretaceous rocks. In general, the waters become fresher in the downstream direction as the river flow increases. The chloride concentration remains below the recommended limit for drinking water of 250 mg/L. One sample site, that just south of Stockton, appears to have an anomalously high chloride concentration in comparison to the other sites. The change in the chemistry of the water from this site fits mixing with the wastewater discharge from the town of Stockton. The estimated increase in chloride concentration from this source is 90 mg/L. Downstream the river water chemistry returns to a more consistent trend for all of the sites except for the Stockton location. The next site downstream of Stockton (south of Woodston site) probably does not contain more than 20 mg/L chloride that could be attributed to the sewage effluent.
The salinity source in the Smoky Hill River waters upstream of the junction with Big Creek is essentially all natural ground-water discharge. In Ellis County the waters are characterized by a higher sulfate content (in mg/L) than chloride content, probably reflecting the influence of the Upper Cretaceous rocks. The amount of chloride from wastewater discharges from towns is unknown but is probably small. As the waters approach the Ellis-Russell county line, the sulfate concentration decreases and the chloride increases. After the county line, the chloride content of the river increases substantially while the sulfate decreases slightly to a relatively constant value, then increases as a large influx of saline water enters just above the junction with Big Creek. The increase in salinity in Russell County fits the chemistry of saltwater in the Dakota and the underlying Permian based on the Dakota Program studies. Any oil-brine contribution, if present, does not contribute more than about 5 percent of the chloride concentration.
The water from Big Creek just above the confluence with the Smoky Hill River appears to contain oil brine; the oil-brine contribution to the chloride concentration is estimated as 30%. The chemistry of the Big Creek sample fits the mixing of natural discharge, wastewater discharge, and oil brine, although the wastewater discharge contribution to the total chloride concentration is probably no more than several percent. The water in the Smoky Hill River below the junction with Big Creek becomes less saline as a result of the dilution with Big Creek water. The river water continues to drop in salinity although the salinity increased at the site south of Dorrance for the January, 1992 sampling in comparison with the continued decrease at the Dorrance site for the October, 1991 sampling.
The salinity of the Smoky Hill River waters below Big Creek was appreciably greater during October, 1991 than in January, 1992. The oil-brine contribution to the total chloride concentration was greater in the more saline waters collected in 1991. During October, 1991 oil brine contributed an estimated 30-38 percent of the total chloride compared to 11-25 percent in January, 1992. The lower percentage in 1992 probably reflected the larger flow which diluted the water and provided a greater percentage of natural dissolved constituents. Dilution by additional discharge to the river in a downstream direction does not appear to decrease the percentage of the oil-brine contribution to the chloride content during either of the sampling periods. In fact, the percent oil-brine chloride increased for both of the sample sets in river south of Bunker Hill. The conclusion is that oil-brine contamination occurs within both the Big Creek watershed and along the Smoky Hill River valley downstream of Big Creek in Russell County, with substantial addition of chloride in the stretch between the sites south of Homer and Bunker Hill.
The well-water sample from the Cedar Hills Sandstone is very saline. Although its bromide/chloride ratio is slightly higher than for equivalent chloride concentrations in the Dakota aquifer in the general area, any oil brine present could not contribute more than a few percent of the total chloride concentration assuming the average oil-brine composition for the area.
Kansas Geological Survey, Geohydrology
Placed online Jan. 6, 2015; originally released Dec. 1991 and Sept. 1992
Comments to webadmin@kgs.ku.edu
The URL for this page is http://www.kgs.ku.edu/Hydro/Publications/1991/OFR91_59/index.html