Kansas Geological Survey, Open-file Report 83-14
KGS Open File Report 83-14
A Report for the Big Bend Groundwater Management District No. 5
June 1983
Read the PDF version (600 kB)
Slightly saline water has been found in the irrigation well of Richard Newell, located in the center of the SE of Section 19, T. 24 S., R. 10 W., approximately 3 miles west-southwest of the town of Sylvia, western Reno County. The chloride concentration of a sample collected from this well during July, 1977 was 311 mg/L (Hathaway, et al., 1978). Subsequently, 10 samples were collected from the well over the course of the 1982 irrigation season to determine whether the groundwater quality would change with pumping. The specific conductances and chloride concentrations increased appreciably during pumping from July to September. The low weight ratios of sodium/chloride (0.36-0.40) in the samples suggested that oil-field brine could be affecting the quality of water at this site. Sodium/chloride ratios are usually 0.5 ± 0.1 for oil-field brines in Kansas, and about 0.65 for halite (rock salt) solutions in near-surface Permian rocks. However, the ratio can be appreciably decreased by sodium adsorption in clay-containing sediments if the salt water enters a freshwater portion of an aquifer. Thus, the more conclusive method for distinguishing oil-field brine from halite-solution brine sources of salinity based on bromide/chloride ratios and mixing curves (Whittemore et al., 1981; Whittemore, 1983) was applied to the same 10 samples collected from the Newell well. This report gives the results of the chemical identification of the salinity source.
Bromide concentrations were measured by an automated phenol red method on a Technicon AutoAnalyzer (Basel, et al., 1982). Dissolved chloride and sulfate were determined by automated spectrophotometric methods on the same instrument using ferric thiocyanate and methyl thymol blue, respectively.
The chloride concentration of the well waters increased from 260 to 397 mg/L during the irrigation season pumping (Table 1). The bromide/chloride weight ratios remained nearly constant for the same samples, averaging 0.00290. Ratios for 5 of these samples are plotted versus chloride concentration in Figure 1 (the points marked B).
Figure 1--Ratios of Br/Cl for freshwater and brine-mixing zones, Great Bend Prairie. Symbols: ![]() domestic or irrigation well,
domestic or irrigation well, ![]() observation well, + oil-field brine. (reproduced from Whittemore, 1983).
observation well, + oil-field brine. (reproduced from Whittemore, 1983).
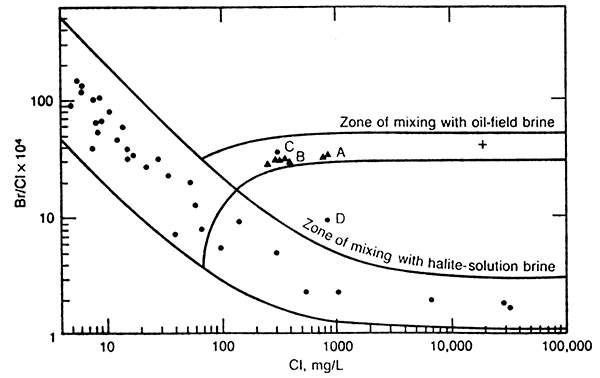
Table 1--Dissolved Constituent Concentrations and Ratios for Water Samples from R. Newell Irrigation Well.
| Date Collected mon/day/yr |
Specific Conductance µmho/cm |
Na mg/l |
Cl mg/L |
SO4 mg/L |
Br mg/L |
Na/Cl | SO4/Cl | Br/Cl × 104 |
|---|---|---|---|---|---|---|---|---|
| 7/27/1977 | 1410 | 138 | 311 | 28 | 0.44 | 0.090 | ||
| 7/20/1982 | 1200 | 104 | 260 | 25 | 0.71 | 0.40 | 0.096 | 27 |
| 7/27/1982 | 1340 | 118 | 305 | 26 | 0.90 | 0.39 | 0.085 | 30 |
| 8/01/1982 | 1400 | 129 | 323 | 26 | 0.95 | 0.40 | 0.080 | 29 |
| 8/07/1982 | 1440 | 131 | 334 | 26 | 0.99 | 0.39 | 0.078 | 30 |
| 8/13/1982 | 1480 | 134 | 345 | 26 | 1.03 | 0.39 | 0.075 | 29 |
| 8/21/1982 | 1500 | 132 | 354 | 27 | 1.06 | 0.37 | 0.076 | 30 |
| 8/25/1982 | 1500 | 133 | 356 | 27 | 1.06 | 0.37 | 0.076 | 30 |
| 8/29/1982 | 1510 | 135 | 357 | 26 | 1.08 | 0.38 | 0.073 | 30 |
| 9/05/1982 | 1510 | 143 | 397 | 26 | 1.08 | 0.36 | 0.065 | 27 |
| 9/18/1982 | 1510 | 142 | 392 | 26 | 1.10 | 0.36 | 0.066 | 28 |
The curves in Figure 1 are the boundary lines for the zone of mixing of fresh waters in the Great Bend Prairie aquifer with salt waters derived from the underlying Permian rocks, and the zone of mixing of certain of the aquifer waters with oil-field brine. The observation well data represent water samples from the well network of the Big Bend Groundwater Management District and Kansas Geological Survey, in which sites include a well screened in the upper saturated zone of the freshwater aquifer, another at the base of the aquifer, and a third well in the top of the underlying bedrock. The oil-field brine shown was obtained from south-central Stafford County and has a bromide/chloride ratio in the same range as most oil brines from other areas of Kansas. Chloride concentrations in irrigation and shallow observation well waters within a 6 mile (10 km) radius of the Newell Irrigation well and greater than 1 mile (1.6 km) from a permanently flowing stream, ranged from 13 to 181 mg/L and averaged about 70 mg/L. Thus, the freshwater endpoints for drawing a zone of mixing with oil-field brine were determined by the bromide/chloride ratios at 70 mg/L chloride on the boundary lines of the mixing zone for halite-solution brine. The points for the Newell well waters fall within the zone of mixing of the fresh waters in the surrounding area with oil-field brine, and lie appreciably above the zone of mixing with halite-solution brine.
The sulfate concentrations in the irrigation well waters (Table 1) remained nearly constant during the summer pumping. This also suggests that oil-field brine has polluted the groundwater because oil brines in Kansas typically have low sulfate/chloride ratios. The observation wells in the Permian bedrock underlying the aquifer at the two sites nearest the Newell well yield waters containing only a few thousand mg/L chloride and sulfate/chloride weight ratios of 0.14 to 0.15. Samples from the observation wells at the base of the aquifer at the same two sites have chloride concentrations of 1300 to 1500 mg/L and sulfate/chloride ratios of 0.13 to 0.14. If the source of the salt water causing the increase in chloride concentration in the Newell well was upconing of saline water from the underlying Permian strata, the sulfate concentration would have been expected to at least double (to over 50 mg/L) by the end of the 1982 irrigation season.
The main source of salt water contaminating the groundwater pumped by the Newell irrigation well is oil-field brine. The geochemistry of the irrigation and well waters from the area suggests that only up to about 100 mg/L of the chloride concentration in the Newell well water could be contributed by the saline waters naturally occurring at the base of and immediately underlying the aquifer.
Basel, C.L., Defreese, J.D., and Whittemore, D.O., 1982, Interferences in automated phenol red method for determination of bromide in water: Analytical Chemistry 54:2090-2094.
Hathaway, L.R., Galle, O.K., Waugh, T.C., and Dickey, H.P., 1978, Chemical quality of irrigation waters in Ford County and the Great Bend Prairie of Kansas: Kansas Geological Survey, Chemical Quality Ser. 7, 41 p. [available online]
Whittemore, D.O., 1983, Geochemical identification of salinity sources; in, Proceedings of International Symposium on State-of-the-Art Control of Salinity, R.H. French, ed.: Ann Arbor Science, Ann Arbor, Michigan (in press).
Whittemore, D.O., Basel, C.L., Galle, O.K., and Waugh, T.C., 1981, Geochemical identification of saltwater sources in the Smoky Hill River Valley. McPherson, Saline, and Dickinson Counties, Kansas: Kansas Geological Survey Open-file Rep. 81-6, 78 p. [available online]
Kansas Geological Survey
Placed online Feb. 17, 2017
Comments to webadmin@kgs.ku.edu
The URL for this page is http://www.kgs.ku.edu/Hydro/Publications/1983/OFR83_14/index.htm