![]()
Prev Page--Utilization || Next Page--Geologic Formations
Ground Water, continued
Chemical Character of the Water
The chemical character of ground water in Sumner County is indicated by the analyses of 219 samples given in Table 6, and the analyses of 13 samples shown graphically in Figure 9. The analyses were made by Howard Stoltenberg in the Water and Sewage Laboratory of the Kansas State Board of Health. Samples of water were collected from wells and test holes distributed as uniformly as possible within the county and representing the principal water-bearing formations of the area. Analyses of samples from all municipal supplies and of samples collected during 1943 and 1944 as part of an earlier study also are included. In areas where the ground water has been contaminated by oil-field brines, samples were collected from closely spaced test holes to determine the extent of contamination. Analyses of 15 samples of surface water (Table 7) are included to show the effects of contamination. Because chloride and sulfate are the critical constituents in ground water in much of Sumner County, 71 samples were analyzed only for one or both of these substances.
Figure 9--Graphic representation of analyses of water from principal water-bearing formations in Sumner County.
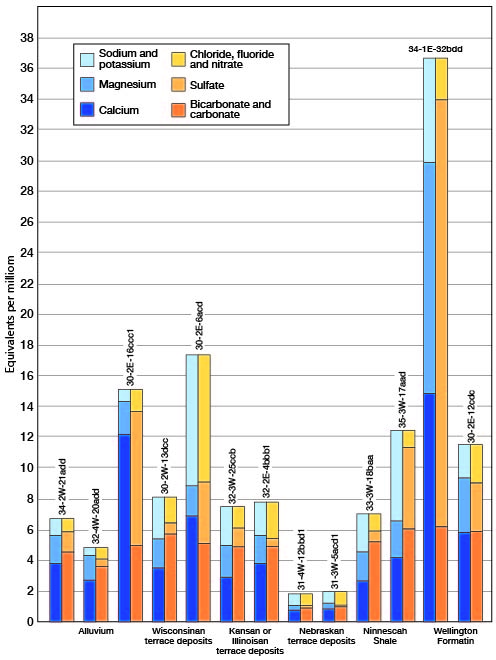
The relation of the geology to the quality of water in an aquifer is discussed in a later section.
The results of the analysis of water samples listed in Table 6, Table 7, and Table 8 are given in parts per million. Factors for converting parts per million of mineral constituents to equivalents per million are given in Table 9. The parts per million of a constituent are multiplied by the conversion factor to obtain the equivalents per million of that constituent.
Table 7--Partial analyses of water from wells and test holes in Sumner County.
| Well number | Depth, feet |
Geologic source |
Date of collection |
Temperature (deg. F) |
Sulfate (SO4) |
Chloride (Cl) |
|---|---|---|---|---|---|---|
| 30-2E-6bcb | 47-52 | Wisconsinan terrace deposits | 5/23/1944 | 114 | ||
| 30-2E-6bdd | 20-25 | Wisconsinan terrace deposits | 5/23/1944 | 33 | ||
| 30-2E-7abc1 | Wisconsinan terrace deposits | 9/8/1955 | 147 | |||
| 30-2E-17acb1 | 38.6 | Wisconsinan terrace deposits | 8/9/1956 | 1,240 | 65 | |
| 30-2E-17bba | 50-55 | Wisconsinan terrace deposits | 5/20/1944 | 54 | ||
| 30-2E-19aba | 67-72 | Wisconsinan terrace deposits | 5/20/1944 | 43 | ||
| 30-2E-19bcc | 46-51 | Wisconsinan terrace deposits | 5/19/1944 | 34 | ||
| 30-2E-19ccb | 39-41 | Alluvium | 6/14/1956 | 24 | ||
| 30-2E-20ccc | 20 | Wisconsinan terrace deposits | 8/23/1943 | 62 | 20 | |
| 30-2E-28aba | 20 | Alluvium | 8/23/1943 | 64 | 76 | |
| 30-2E-29aab | 58-60 | Wisconsinan terrace deposits | 6/18/1956 | 347 | ||
| 30-2E-29aba2 | 54-56 | Wisconsinan terrace deposits | 6/14/1956 | 451 | ||
| 30-2E-29add | 37-39 | Wisconsinan terrace deposits | 6/18/1956 | 328 | ||
| 30-2E-29baa | 56-58 | Wisconsinan terrace deposits | 6/18/1956 | 435 | ||
| 30-2E-29bbb | 47-49 | Wisconsinan terrace deposits | 6/14/1956 | 31 | ||
| 30-2E-30ccc | 11-13 | Wisconsinan terrace deposits | 9/7/1955 | 14 | ||
| 30-2E-30dba | 36.3 | Wisconsinan terrace deposits | 8/9/1956 | 46 | 16 | |
| 30-2E-33bbb | 20 | Wisconsinan terrace deposits | 8/23/1943 | 62 | 15 | |
| 30-2E-34bbb | 17-19 | Alluvium | 6/13/1956 | 39 | ||
| 30-1E-1aac | 45-50 | Alluvium | 6/8/1944 | 118 | ||
| 30-1E-1abb | 47-49 | Wisconsinan terrace deposits | 7/3/1956 | 143 | ||
| 30-1E-1acd | 34-36 | Alluvium | 7/4/1956 | 82 | ||
| 30-1E-2abb | 51-56 | Wisconsinan terrace deposits | 6/9/1944 | 81 | ||
| 30-1E-3aaa | 45-47 | Wisconsinan terrace deposits | 7/4/1956 | 33 | ||
| 30-1E-3abb | 33-38 | Wisconsinan terrace deposits | 6/9/1944 | 28 | ||
| 30-1E-3bbb | 19-21 | Wisconsinan terrace deposits | 9/5/1956 | 18 | ||
| 30-1E-4aab | 9-14 | Wisconsinan terrace deposits | 6/9/1944 | 20 | ||
| 30-1E-4bab | 25-30 | Illinoisan or Kansan terrace deposits | 6/9/1944 | 29 | ||
| 30-1E-6bbb | 61-67 | Illinoisan or Kansan terrace deposits | 6/7/1944 | 22 | ||
| 30-1E-9add | 26-28 | Illinoisan or Kansan terrace deposits | 7/5/1956 | 17 | ||
| 30-1E-11aaa | 48-50 | Wisconsinan terrace deposits | 7/3/1956 | 75 | ||
| 30-1E-13bab | 20 | Wisconsinan terrace deposits | 8/23/1943 | 24 | ||
| 30-1E-13daa | 33.0 | Wisconsinan terrace deposits | 9/7/1955 | 23 | ||
| 30-1E-14aaa | 58-60 | Wisconsinan terrace deposits | 7/3/1956 | 31 | ||
| 30-1E-14ccd | 20 | Wisconsinan terrace deposits | 8/23/1943 | 65 | 40 | |
| 30-1E-18cbc | 30.0 | Wisconsinan terrace deposits | 9/1/1955 | 235 | ||
| 30-1E-23aab | 19-21 | Wisconsinan terrace deposits | 7/3/1956 | 27 | ||
| 30-1E-25aba | 20 | Wisconsinan terrace deposits | 8/23/1943 | 45 | ||
| 30-1E-25baa | 31-36 | Wisconsinan terrace deposits | 5/18/1944 | 28 | ||
| 30-1E-28ccc | 30-32 | Wisconsinan terrace deposits | 9/7/1955 | 40 | ||
| 30-1E-33cdc | 29-31 | Wisconsinan terrace deposits | 6/7/1956 | 755 | ||
| 30-1E-33ddd | 29-31 | Alluvium | 6/6/1956 | 70,100 | ||
| 30-1E-34add | 25-27 | Wisconsinan terrace deposits | 8/11/1956 | 11,700 | ||
| 30-1E-34bbc | 31-33 | Wisconsinan terrace deposits | 6/6/1956 | 178 | ||
| 30-1E-34bcc | 40-42 | Wisconsinan terrace deposits | 6/6/1956 | 15,100 | ||
| 30-1E-34ccb | 36-38 | Wisconsinan terrace deposits | 6/6/1956 | 64,400 | ||
| 30-1E-34ccd | 37-39 | Alluvium | 6/8/1956 | 115,000 | ||
| 30-1E-34dcd | 37-39 | Alluvium | 6/8/1956 | 12,200 | ||
| 30-1E-35aaa | 36-38 | Illinoisan or Kansan terrace deposits | 9/7/1955 | 15 | ||
| 30-1E-35bcc | 20-25 | Wisconsinan terrace deposits | 5/17/1944 | 96 | ||
| 30-1E-35cbc | 31-33 | Wisconsinan terrace deposits | 6/11/1956 | 2,070 | ||
| 30-1W-2abb | 30-35 | Wisconsinan terrace deposits | 6/7/1944 | 15 | ||
| 30-1W-5abb | 29-31 | Wisconsinan terrace deposits | 8/31/1955 | 13 | ||
| 30-1W-13aaa | 40.0 | Wisconsinan terrace deposits | 9/1/1955 | 71 | ||
| 30-4W-23ddd | 45.8 | Ninnescah Shale | 8/13/1956 | 58 | 27 |
| Well number | Depth, feet |
Geologic source |
Date of collection |
Temperature (deg. F) |
Sulfate (SO4) |
Chloride (Cl) |
|---|---|---|---|---|---|---|
| 31-2E-2ddd | 17-19 | Wisconsinan terrace deposits | 6/18/1956 | 8.0 | ||
| 31-2E-3aba | 12-14 | Alluvium | 6/29/1956 | 14 | ||
| 31-2E-3baa | 19-21 | Alluvium | 6/18/1956 | 36 | ||
| 31-2E-3bbb | 48-50 | Wisconsinan terrace deposits | 6/12/1956 | 54 | ||
| 31-2E-3cbb | 20 | Alluvium | 8/23/1943 | 43 | ||
| 31-2E-3ddd | 24-26 | Alluvium | 6/29/1956 | 52 | ||
| 31-2E-5cdd | 20 | Wisconsinan terrace deposits | 8/23/1943 | 62 | 27 | |
| 31-2E-5ddd | 48-50 | Wisconsinan terrace deposits | 6/12/1956 | 18 | ||
| 31-2E-7ccc | 31-33 | Wisconsinan terrace deposits | 9/8/1955 | 6.0 | ||
| 31-2E-9adb | 61.8 | Wisconsinan terrace deposits | 8/13/1956 | 166 | 26 | |
| 31-2E-11ada | 20 | Wisconsinan terrace deposits | 8/23/1943 | 63 | 29 | |
| 31-2E-12bcc | 16-18 | Wisconsinan terrace deposits | 6/19/1956 | 19 | ||
| 31-2E-13bba | 17-19 | Wisconsinan terrace deposits | 6/19/1956 | 31 | ||
| 31-2E-13bca | 21-23 | Wisconsinan terrace deposits | 6/19/1956 | 48 | ||
| 31-2E-13cca | 28-30 | Wisconsinan terrace deposits | 6/20/1956 | 36 | ||
| 31-2E-14aab | 29-31 | Wisconsinan terrace deposits | 6/19/1956 | 48 | ||
| 31-2E-15aaa | 48-50 | Wisconsinan terrace deposits | 6/12/1956 | 48 | ||
| 31-2E-16aaa | 20 | Wisconsinan terrace deposits | 8/23/1943 | 18 | ||
| 31-2E-17cdc | 25 | Wisconsinan terrace deposits | 8/23/1943 | 40 | ||
| 31-2E-20ddc | 25 | Alluvium | 8/26/1943 | 24 | ||
| 31-2E-24bab | 20-22 | Wisconsinan terrace deposits | 9/10/1955 | 47 | ||
| 31-2E-24cdd | 42-47 | Wisconsinan terrace deposits | 5/25/1944 | 85,500 | ||
| 31-2E-24dca | 18-20 | Wisconsinan terrace deposits | 6/20/1956 | 64,700 | ||
| 31-2E-24dcc | 39-41 | Wisconsinan terrace deposits | 6/20/1956 | 430 | ||
| 31-2E-25aba | 36-38 | Wisconsinan terrace deposits | 6/20/1956 | 27,500 | ||
| 31-2E-25ada | 11-13 | Wisconsinan terrace deposits | 6/20/1956 | 915 | ||
| 31-2E-25cac | 28-30 | Alluvium | 6/21/1956 | 515 | ||
| 31-2E-25cad | 27-29 | Alluvium | 6/21/1956 | 2,080 | ||
| 31-2E-25dcc | 42-47 | Alluvium | 5/26/1944 | 74,200 | ||
| 31-2E-25dda | 47-49 | Wisconsinan terrace deposits | 6/20/1956 | 37,400 | ||
| 31-2E-25ddd | 41-43 | Wisconsinan terrace deposits | 9/10/1955 | 56,400 | ||
| 31-2E-26bbb | 27-29 | Wisconsinan terrace deposits | 9/9/1955 | 18 | ||
| 31-2E-26ddd | 18-23 | Wisconsinan terrace deposits | 5/13/1944 | 28 | ||
| 31-2E-27aaa | 25 | Wisconsinan terrace deposits | 8/26/1943 | 62 | 42 | |
| 31-2E-34aba | 28 | Wisconsinan terrace deposits | 8/26/1943 | 62 | 24 | |
| 31-2E-36aad | 34-36 | Alluvium | 6/21/1956 | 23,600 | ||
| 31-2E-36abb | 11-13 | Alluvium | 6/21/1956 | 760 | ||
| 31-2E-36acb | 10-12 | Alluvium | 6/21/1956 | 485 | ||
| 31-2E-36dca | 9-11 | Alluvium | 6/28/1956 | 510 | ||
| 31-2E-36dcd | 9-11 | Alluvium | 6/28/1956 | 490 | ||
| 31-1E-2baa | 17-19 | Wisconsinan terrace deposits | 6/12/1956 | 54 | ||
| 31-1E-2bad | 21-23 | Wisconsinan terrace deposits | 6/12/1956 | 78 | ||
| 31-1E-2bbb | 30-32 | Wisconsinan terrace deposits | 6/11/1956 | 1,590 | ||
| 31-1E-2bcc | 30-32 | Wisconsinan terrace deposits | 6/11/1956 | 595 | ||
| 31-1E-3baa | 37-39 | Wisconsinan terrace deposits | 6/8/1956 | 160,000 | ||
| 31-1E-4aab | 34-36 | Wisconsinan terrace deposits | 6/7/1956 | 20,400 | ||
| 31-1E-4aac | 24-26 | Wisconsinan terrace deposits | 6/7/1956 | 6,080 | ||
| 31-1E-4adc | 34-36 | Wisconsinan terrace deposits | 6/8/1956 | 7,200 | ||
| 31-1E-4baa | 28-33 | Wisconsinan terrace deposits | 5/16/1944 | 250 | ||
| 31-1E-4bad | 32-34 | Wisconsinan terrace deposits | 6/7/1956 | 280 | ||
| 31-1E-9abb2 | 35-40 | Wisconsinan terrace deposits | 6/6/1944 | 70 | ||
| 31-1E-10aaa1 | 25 | Wisconsinan terrace deposits | 8/27/1943 | 63 | 72 | |
| 31-1E-10aaa2 | 25 | Wisconsinan terrace deposits | 7/5/1956 | 79 | ||
| 31-1E-11ada | 25 | Wisconsinan terrace deposits | 8/26/1943 | 62 | 117 | |
| 31-1E-11baa | 41-43 | Wisconsinan terrace deposits | 6/12/1956 | 202 | ||
| 31-1E-11bbb | 33-35 | Alluvium | 6/11/1956 | 930 | ||
| 31-1E-11bcc | 34-36 | Wisconsinan terrace deposits | 6/11/1956 | 8,050 | ||
| 31-1E-11cbb | 24 | Wisconsinan terrace deposits | 6/11/1956 | 2,900 | ||
| 31-1E-11cbc | 14-16 | Alluvium | 7/5/1956 | 1,750 | ||
| 31-1E-12bbb | 38-40 | Wisconsinan terrace deposits | 6/12/1956 | 64 | ||
| 31-1E-13bbb | 35-40 | Wisconsinan terrace deposits | 5/15/1944 | 1,180 | ||
| 31-1E-14aaa | 26-28 | Alluvium | 7/6/1956 | 262 | ||
| 31-1W-26add | 33 | Wellington Formation | 7/26/1956 | 2,350 | 89 |
| Well number | Depth, feet |
Geologic source |
Date of collection |
Temperature (deg. F) |
Sulfate (SO4) |
Chloride (Cl) |
|---|---|---|---|---|---|---|
| 32-2E-1abd | 15-17 | Alluvium | 6/28/1956 | 361 | ||
| 32-2E-1dcd | 9-11 | Alluvium | 6/27/1956 | 550 | ||
| 32-2E-13aaa | 34-36 | Wisconsinan terrace deposits | 6/22/1956 | 2,290 | ||
| 32-2E-13abb | 35-37 | Wisconsinan terrace deposits | 6/27/1956 | 32,700 | ||
| 32-2E-13add1 | 25 | Wisconsinan terrace deposits | 8/21/1943 | 63 | 356 | |
| 32-2E-13daa | 36-39 | Wisconsinan terrace deposits | 6/22/1956 | 9,820 | ||
| 32-2E-13ddc | 39-41 | Wisconsinan terrace deposits | 6/22/1956 | 374 | ||
| 32-2E-17acc | 72.9 | Wellington Formation | 7/26/1956 | 1,630 | 394 | |
| 32-2E-22aaa | 40 | Illinoisan or Kansan terrace deposits | 7/26/1956 | 15 | 10 | |
| 32-2E-24aaa | 45-47 | Wisconsinan terrace deposits | 6/22/1956 | 237 | ||
| 32-2E-24bcd | Wisconsinan terrace deposits | 8/16/1956 | 56 | 8,540 | ||
| 32-2E-25abb | 37-39 | Alluvium | 6/26/1956 | 18,700 | ||
| 32-2E-25ddd | 30-32 | Alluvium | 9/13/1955 | 1,160 | ||
| 32-2E-31cdc | 44.0 | Illinoisan or Kansan terrace deposits | 8/16/1956 | 1,800 | 770 | |
| 32-1E-8ddd | 49.4 | Wellington Formation | 6/26/1956 | 2,620 | 755 | |
| 32-1E-9ddc | 37.4 | Wellington Formation | 6/26/1956 | 130 | 183 | |
| 32-1E-12dcc | Wellington Formation | 6/26/1956 | 2,270 | 333 | ||
| 32-1E-16aaa | Wellington Formation | 6/26/1956 | 2,470 | 810 | ||
| 32-4W-20ddd | 37.4 | Wisconsinan terrace deposits | 8/15/1956 | 348 | 60 | |
| 33-2E-1cbb | 87.2 | Illinoisan or Kansan terrace deposits | 7/26/1956 | 42 | 14 | |
| 33-2E-23cdd | 19-24 | Wisconsinan terrace deposits | 5/10/1944 | 65 | ||
| 33-2E-27cad | 39 | Wellington Formation | 7/26/1956 | 1,688 | 281 | |
| 33-2E-27cdc | 66 | Wellington Formation | 7/26/1956 | 3,470 | 5,020 | |
| 33-3W-14cbb | 51 | Wellington Formation | 8/15/1956 | 1,940 | 505 | |
| 33-3W-15add | 60 | Wellington Formation | 8/15/1956 | 806 | 273 | |
| 33-4W-3aaa | 241.0 | Ninnescah Shale | 8/16/1956 | 2,180 | 5,640 | |
| 35-2E-1aaa | 85.9 | Wellington Formation | 8/10/1956 | 1,410 | 129 | |
| 35-2E-2bdd1 | 84.8 | Illinoisan or Kansan terrace deposits | 8/10/1956 | 43 | 44 | |
| 35-1E-4aaa | 32.1 | Wellington Formation | 8/10/1956 | 2,540 | 535 | |
| 35-2W-8aaa | 31.0 | Ninnescah Shale | 8/10/1956 | 296 | 414 |
Table 8Analyses of water from streams in Sumner County, Kansas. Analyzed by H.A. Stoltenberg. Dissolved constituents given in parts per million.
| Sample no. | Source | Date of collection |
Sulfate (SO4) |
Chloride (Cl) |
|---|---|---|---|---|
| 30-1E-1aaa | Arkansas River | 8/13/1956 | 115 | 231 |
| 30-1E-3bbb | Cowskin Creek | 8/13/1956 | 194 | 95 |
| 30-1E-32ddc | Ninnescah River | 8/14/1956 | 163 | 348 |
| 30-1E-33ddd | Oxbow Lake | 6/23/1956 | 66 | |
| 30-2W-1aaa | Ninnescah River | 8/14/1956 | 70 | 500 |
| 31-2E-35bda | Ninnescah River | 8/14/1956 | 85 | 493 |
| 31-1E-11bcc | Ninnescah River | 8/14/1956 | 95 | 650 |
| 32-2E-12dcc | Arkansas River | 7/11/1956 | 157 | 555 |
| 32-2E-14daa | Stream | 7/26/1956 | 8,130 | |
| 32-1E-32cbc | Slate Creek | 7/26/1956 | 102 | 81 |
| 33-2E-15ccc | Slate Creek | 7/26/1956 | 842 | 4,010 |
| 33-2E-23dad | Slate Creek | 7/26/1956 | 1,890 | 13,700 |
| 34-2E-1dda | Salt Creek | 7/26/1956 | 3,220 | 19,800 |
| 34-2E-2cbc | Salt Creek | 7/26/1956 | 798 | 124 |
| 34-2E-23bcc | Ditch | 7/11/1956 | 71,400 |
Table 9--Factors for converting parts per million of mineral constituents to equivalents per million.
| Cation | Conversion factor | Anion | Conversion factor | |
|---|---|---|---|---|
| Ca++ | 0.0499 | HCO3- | 0.0164 | |
| Mg++ | 0.0822 | SO4-- | 0.0208 | |
| Na+ | 0.0435 | Cl- | 0.0282 | |
| NO3- | 0.0161 | |||
| F- | 0.0526 |
Chemical Constituents in Relation to Use
The following discussion of the chemical constituents of ground water has been adapted in part from publications of the U.S. Geological Survey and the State Geological Survey of Kansas.
Dissolved solids
When water is evaporated, the residue consists mainly of the mineral constituents listed in the tables of analyses, but generally includes a small quantity of organic material and some water of crystallization. Water containing less than 500 ppm of dissolved solids is satisfactory for domestic use except for difficulties resulting from its hardness or excessive iron content. Water containing more than 1,000 ppm is likely to include enough of certain constituents to cause a noticeably poor taste or to make the water unsuitable in some other respect.
The dissolved solids in 67 samples of ground water from Sumner County ranged from 146 to 158,400 ppm. Of these, 34 samples contained less than 500 ppm, 21 samples contained 500 to 1,000 ppm, and 12 samples contained more than 1,000 ppm. Strong concentrations of dissolved solids in water from unconsolidated aquifers in the county are probably due to contamination by brines.
Hardness
The hardness of water is recognized most commonly by its effects when soap is used with the water. Calcium and magnesium cause almost all the hardness of ordinary water and are the active agents in the formation of most of the scale in steam boilers and other vessels used to heat or evaporate water.
In addition to the total hardness, the carbonate and noncarbonate hardness are listed in the table of analyses. The carbonate hardness is due to the presence of calcium and magnesium bicarbonates and can be removed almost completely by boiling. This type of hardness is sometimes called "temporary" hardness as compared to "permanent" or noncarbonate hardness due to the presence of sulfates or chlorides of calcium and magnesium, which cannot be removed by boiling. With reference to soap consumption, the carbonate and the noncarbonate hardness do not differ. In general, water of noncarbonate hardness forms harder scale in steam boilers.
Water having a hardness of less than 50 ppm is generally rated as soft, and softening treatment is not necessary under ordinary circumstances. Hardness of 50 to 150 ppm does not interfere seriously with the use of water for most purposes, but it does increase the amount of soap used, and its removal is profitable for laundries and certain other industries. Water having a hardness in the upper part of this range will cause considerable scale in steam boilers. Hardness exceeding 150 ppm is very noticeable, and if the hardness is 200 to 300 ppm, water for household use is commonly softened. Where municipal water supplies are softened, an attempt generally is made to reduce the hardness to about 80 ppm. Additional improvement by further softening of a public supply generally is not deemed worth the increased cost.
The total hardness of 71 samples of ground water from Sumner County ranged from 54 to 8,800 ppm. Of these, 6 samples had less than 150 ppm, 21 samples had 150 to 300 ppm, and 41 samples had more than 300 ppm. Total hardness concentrations in excess of about 2,000 ppm are probably due to contamination of ground water by brine. Thirty-six samples contained less than 50 ppm of non-carbonate hardness and could be softened considerably by boiling.
Chloride
Chloride salts are found in nature in great abundance. They occur in sea water, in oil-field brines, in beds of nearly pure salt, and, in small quantities, in other types of rock. Concentrations of chloride salts in water can be readily recognized by the salty taste, but chloride content has little effect on the suitability of water for domestic use unless present in excessive quantity. Water containing much chloride may be corrosive if used in steam boilers. The removal of the chloride ion by present methods is too expensive to be practical. Most persons cannot detect a salty taste if chloride concentration is less than 500 ppm and can drink water containing as much as 2,000 ppm of chloride. Some livestock may survive on water containing as much as 10,000 ppm, but it has been recommended that, for their best production, stock should have water of a quality satisfactory for human consumption.
Analyses were made of 219 samples of water from wells and test holes in Sumner County to determine chloride content. The range was from 60 to 160,000 ppm: 170 of the samples had less than 500 ppm, 20 samples contained 500 to 2,000 ppm, 11 contained 2,001 to 10,000 ppm, and 18 contained more than 10,000 ppm. The distribution of chloride in water in Sumner County is shown in Plate 4. Chloride concentration in excess of about 5,000 ppm is probably due to contamination by brine. The concentration of chloride in the area west of Belle Plaine is probably due to natural pollution; that in the Oxford area, to contamination by oil-field brine.
The chloride content of 15 samples of surface water in Sumner County ranged from 66 to 71,400 ppm. Sample 32-2E-14daa was taken from a small stream near the center of the east side of sec. 14. The chloride concentration of this sample (8,130 ppm) was due chiefly to brine from three poorly plugged oil wells near the intersection of the two railroads in sec. 14. This condition will continue until the flow of salt water is stopped by proper plugging of these wells. Sample 34-2E-23bcc was taken from a small stream near the center of the west side of sec. 23. The concentration of chloride (71,400 ppm) in this sample came from several nearby abandoned oil-field brine ponds. Salt-water seepage can be expected to continue for several years in this area because the surface material surrounding the brine ponds is saturated with salt water. In August 1956 the chloride content of Arkansas River was found to increase downstream from 231 ppm west of Mulvane (sample 30-1E-1aaa) to 555 ppm at Oxford (sample 32-2E-12dcc). This increase in chloride is due to the movement of brine-contaminated ground water into the river from the Churchill oil field northeast of Oxford. A sample taken from Cowskin Creek, which carries much less sewage and industrial waste than Arkansas River, contained only 95 ppm of chloride (sample 30-1E-3bbb) as compared to 231 ppm chloride in a sample from Arkansas River in the same general area (sample 30-1E-1aaa). The chloride content of samples of water from Slate Creek increased greatly downstream from Wellington. Sample 32-1E-32cbc contained only 81 ppm of chloride, sample 33-2E-15ccc contained 4,010 ppm, and sample 33-2E-23dad contained 13,700 ppm. This increase in chloride content occurs where Slate Creek flows over that part of the Wellington Formation from which most of the Hutchinson Salt member has been removed by solution. Sample 34-2E-2cbc, from Salt Creek, contained 124 ppm, and sample 34-2E-1dda, taken from Salt Creek 2 miles farther east, contained 19,800 ppm chloride. This increase also is due to solution of salt from the Wellington Formation.
Iron
If a water contains more than a few tenths of a part per million of iron, it may have a disagreeable taste and will stain cooking utensils and plumbing. Upon exposure to air, most of the iron will settle out of the water as a reddish precipitate. The usual treatment of water to remove iron is aeration and filtration, but some water requires the addition of lime or some other substance. The quantity of iron in ground water may differ greatly from place to place although the water may be derived from the same formation. Iron carbonate is especially troublesome in water from the alluvial deposits of Ninnescah River.
The iron content of 67 samples of ground water from Sumner County ranged from 0 to 18 ppm. In 27 samples it was less than 0.11 ppm; 33 samples contained 0.11 to 2.0 ppm, and 7 contained more than 2.0 ppm.
Sulfate
Sulfate (SO4) in ground water is derived principally from gypsum (hydrous calcium sulfate) and from the oxidation of pyrite (iron disulfide). Magnesium sulfate (Epsom salts) and sodium sulfate (Glauber's salts), if present in sufficient quantity, will impart a bitter taste to the water and may have a laxative effect upon persons who are not accustomed to drinking such water. According to the U.S. Public Health Service (1946), sulfate in water supplies used on interstate carriers preferably should not exceed 250 ppm.
The sulfate content of 95 samples of ground water from Sumner County ranged from 3.7 to 7,800 ppm. In 30 samples it was less than 50 ppm; 36 contained 50 to 250 ppm, 8 contained 251 to 1,000 ppm, and 21 contained more than 1,000 ppm. The sulfate content of 12 samples of water from streams in Sumner County ranged from 70 to 3,220 ppm.
Fluoride
The fluoride content of drinking water is associated with the dental defect known as mottled enamel. Mottled enamel may appear on the teeth of children who, during the period of formation of the permanent teeth, customarily drink water containing fluoride in excess of 1.5 ppm. Concentrations of fluoride of about 1 ppm are known to prevent or lessen the incidence of tooth decay (Dean, 1938), and fluoride is now being added to many municipal supplies.
The fluoride content of 70 samples of ground water from Sumner County ranged from 0.1 to 0.7 ppm.
Nitrate
The use of water containing an excessive amount of nitrate in the preparation of a baby's formula can cause cyanosis or oxygen starvation. Some authorities advocate that water containing more than 45 ppm of nitrate should not be used (Metzler and Stoltenberg, 1950). Water containing 90 ppm of nitrate generally is regarded as very dangerous to infants, and water containing 150 ppm may cause severe cyanosis. Cyanosis is not produced in adults and older children by such concentrations of nitrate. The source of nitrate in ground water is not known, and boiling of water containing excessive nitrate does not make it safe for use by infants. Therefore, only water that is known to have a low content of nitrate should be given to infants.
The nitrate content of 70 samples of ground water from Sumner County ranged from 0.7 to 230 ppm. In 62 samples it was less than 45 ppm; 4 contained 45 to 90 ppm, 2 contained 91 to 150 ppm, and 2 contained more than 150 ppm.
Water for Irrigation
This discussion of the suitability of water for irrigation is adapted from Agriculture Handbook 60, U.S. Department of Agriculture (U.S. Salinity Laboratory Staff, 1954).
The development and maintenance of successful irrigation projects involve not only the supplying of irrigation water to the land, but also the control of the salinity and alkali of the soil. Irrigation practices, drainage conditions, and quality of irrigation water are all involved in salinity and alkali control. Soil that was originally non-saline and non-alkaline may become unproductive if excessive soluble salts or exchangeable sodium are allowed to accumulate because of improper irrigation and soil management or inadequate drainage.
In areas of sufficient rainfall and ideal soil conditions, the soluble salts originally present in the soil or added to the soil with water are carried downward by the water and ultimately reach the water table. This process of dissolving and transporting soluble salts by downward movement through the soil is called leaching. If the amount of water applied to the soil is not in excess of the amount needed by plants, there will be no downward percolation below the root zone, and mineral matter will accumulate at that level. Likewise, impermeable soil zones near the surface can retard the downward movement of water and cause waterlogging of the soil and deposition of salts. Unless drainage is adequate, attempts at leaching may not be successful, because leaching requires the free passage of water through and away from the root zone.
The characteristics of an irrigation water that seem to be most important in determining its quality are (1) total concentration of soluble salts, (2) relative proportion of sodium to other cations (magnesium, calcium, and potassium), (3) concentration of boron or other elements that may be toxic, and (4) under some conditions, the bicarbonate concentration as related to the concentration of calcium plus magnesium.
For purposes of diagnosis and classification, the total concentration of soluble salts in irrigation water can be adequately expressed in terms of electrical conductivity. Electric conductivity is the measure of the ability of the inorganic salts in solution to conduct an electric current and is usually expressed in terms of micromhos per centimeter. The electrical conductivity can be determined accurately in the laboratory, or an approximation of the electrical conductivity can be obtained by multiplying the total equivalents per million of calcium, sodium, magnesium, and potassium by 100, or by dividing the total dissolved solids in parts per million by 0.64. In general, water having electrical conductivity of less than 750 micromhos per centimeter is satisfactory for irrigation insofar as salt content is concerned, although salt-sensitive crops such as strawberries, green beans, and red clover may be adversely affected by water having an electrical conductivity in the range of 250 to 750 micromhos per centimeter. Water in the range of 750 to 2,250 micromhos per centimeter is widely used, and satisfactory crop growth is obtained under good management and favorable drainage conditions, but saline conditions will develop if leaching and drainage are inadequate. Use of water having a conductivity greater than 2,250 micromhos per centimeter is rare, and very few instances can be cited where such water has been used successfully.
In the past the relative proportion of sodium to other cations in irrigation water usually has been expressed simply as the percent sodium. According to the U.S. Department of Agriculture, however, the relative activity of sodium ions in exchange reactions with soil is a much better measure of the suitability of water for irrigation. The sodium-adsorption ratio (SAR) may be determined by the formula
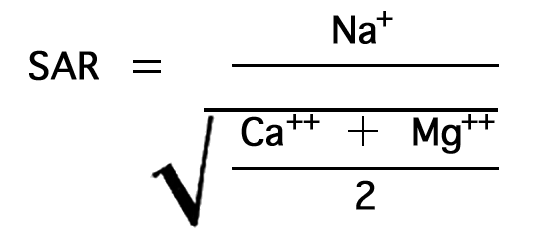
where the ionic concentrations are expressed in equivalents per million. The sodium-adsorption ratio may be determined also by use of the nomogram shown in Figure 10.
Figure 10--Nomogram for determining value of sodium-adsorption ratio of irrigation water.
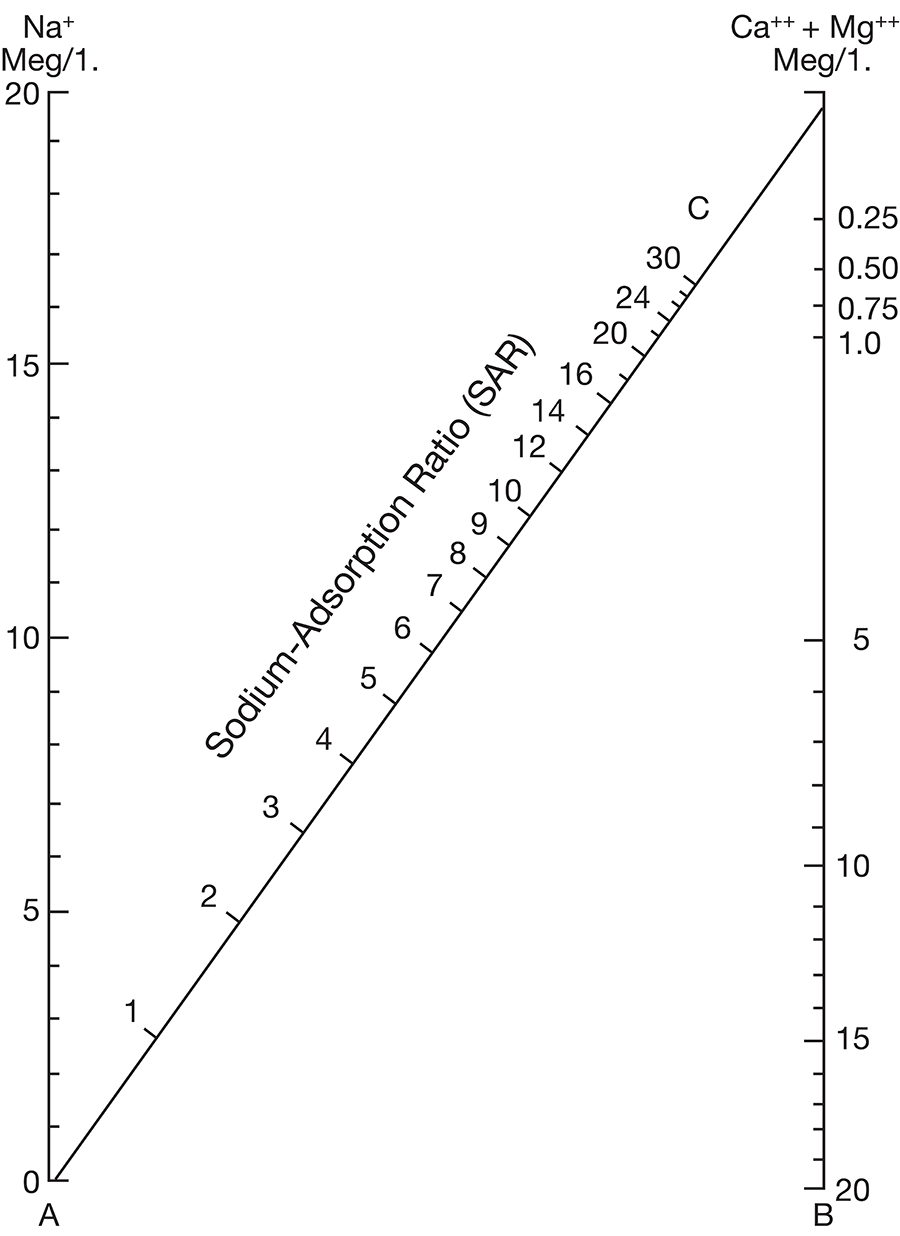
Figure 11--Diagram showing classification of typical waters of Sumner County for irrigation use.
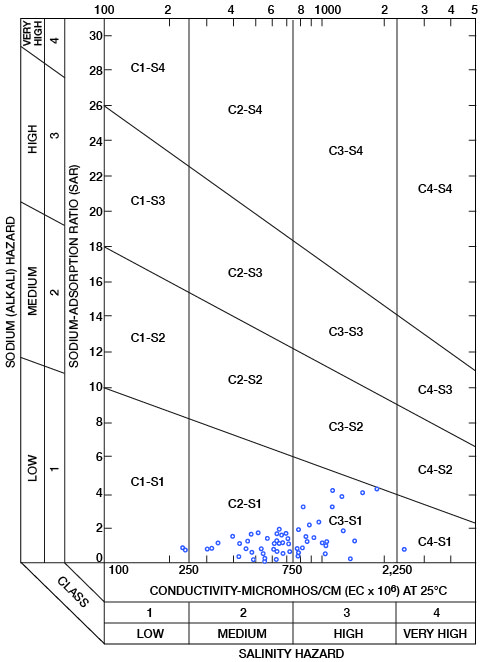
In using the nomogram to determine the sodium-adsorption ratio of a water, the concentration of sodium expressed in equivalents per million is plotted on the left scale (A), and the concentration of calcium plus magnesium expressed in equivalents per million is plotted on the right scale (B). The point at which a line connecting these two points intersects the sodium-adsorption-ratio scale (C) indicates the sodium-adsorption ratio of the water. When the sodium-adsorption ratio and the electrical conductivity of a water are known, the suitability of the water for irrigation can be determined by plotting these values on the diagram shown in Figure 11. Low-sodium water (S1) can be used for irrigation on almost all soils with little danger of developing harmful levels of exchangeable sodium. Medium-sodium water (S2) will present an appreciable sodium hazard in certain fine-textured soils, especially under poor leaching conditions. This water may be safely used on coarse-textured or organic soils having good permeability. High-sodium water (S3) may produce harmful levels of exchangeable sodium in most soils and will require special soil management such as good drainage, thorough leaching, and additions of organic matter. Very high sodium water (S4) is generally unsatisfactory for irrigation unless special action is taken, such as addition of gypsum to the soil.
Water of low salinity (C1) can be used for irrigation of most crops on most soils with little likelihood that soil salinity will develop. Water of medium salinity (C2) can be used if a moderate amount of leaching occurs. Crops having moderate salt tolerances, such as potatoes, corn, wheat, oats, and alfalfa, can be irrigated with C2 water without special practices. Water of high salinity (C3) cannot be used on soils having restricted drainage. Water of very high salinity (C4) can be used only on certain crops and then only if special practices are followed.
Boron is essential to normal plant growth, although the quantity required is very small. Crops vary greatly in their boron tolerances, but in general it may be said that the ordinary field crops common to Kansas are not adversely affected by boron concentrations of less than 1 ppm.
Prolonged use, under adverse conditions, of water having a strong concentration of bicarbonate could have an undesirable effect upon the soil texture and plant growth.
Of the 67 samples of ground water from Sumner County that were classified as to suitability for irrigation use, 9 (Table 10) were of such poor quality that they could not be plotted on Figure 11. All samples plotted had a low sodium hazard, but one sample had a very high salinity hazard and could be used for irrigation only under special conditions; 23 samples had a high salinity hazard, but could be used for irrigating most field crops on soils having adequate drainage; 32 samples had a medium salinity hazard and could be used for irrigation with no special practices on most soils, and 2 samples had a low salinity hazard and could be used to irrigate any crop on all types of soil.
Table 10--Classification of water in Sumner County for irrigation use.
| Well number | Approximate conductivity, (micromhos/cm) |
Approximate sodium-adsorption ratio |
Class |
|---|---|---|---|
| 30-2E-6acd | 1,670 | 4.0 | C3-S1 |
| 30-2E-8bbb | 1,500 | 1.3 | C3-S1 |
| 30-2E-12cdc | 1,010 | 1.0 | C3-S1 |
| 30-2E-16ccc1 | 1,480 | 0.3 | C3-S1 |
| 30-2E-18cdd | 625 | 0.2 | C2-S1 |
| 30-2E-20abb | 1,040 | 1.1 | C3-S1 |
| 30-2E-31bbb | 550 | 0.6 | C2-S1 |
| 30-1E-1bbb | 930 | 1.5 | C3-S1 |
| 30-1E-2aab1 | 630 | 1.4 | C2-S1 |
| 30-1E-13ddc1 | 620 | 1.1 | C2-S1 |
| 30-1E-15cdc | 430 | 1.1 | C2-S1 |
| 30-1E-16bba | 510 | 1.7 | C2-S1 |
| 30-1E-17bab | 390 | 1.6 | C2-S1 |
| 30-1E-25bcc | 470 | 1.3 | C2-S1 |
| 30-1E-36caa | 490 | 1.7 | C2-S1 |
| 30-1W-2ddd | 670 | 0.6 | C2-S1 |
| 30-1W-3bab | 720 | 0.7 | C2-S1 |
| 30-2W-22ada | 5,250 | ||
| 30-3W-33dcc | 320 | 0.8 | C2-S1 |
| 30-4W-16ccb | 300 | 0.8 | C2-S1 |
| 31-2E-2bba | 630 | 0.6 | C2-S1 |
| 31-2E-7cbc | 570 | 0.4 | C2-S1 |
| 31-2E-8bbb | 670 | 1.2 | C2-S1 |
| 31-2E-10dcc | 550 | 0.2 | C2-S1 |
| 31-2E-11dcd | 800 | 0.4 | C3-S1 |
| 31-2E-25bbc | 2,370 | 0.8 | CC4 |
| 31-2E-28aab | 1,020 | 0.6 | C3-S1 |
| 31-2E-29cbb | 540 | 0.8 | C2-S1 |
| 31-1E-3abb | 247,500 | ||
| 31-1E-4bbb | 710 | 1.3 | C2-S1 |
| 31-1E-4bdc1 | 980 | 2.2 | C3-S1 |
| 31-1E-4bdc2 | 1,320 | 3.8 | C3-S1 |
| 31-1E-5aba | 490 | 0.1 | C2-S1 |
| 31-1E-25bba1 | 640 | 1.9 | C2-S1 |
| 31-1W-24bcb | 4,190 | ||
| 31-3W-5acd1 | 230 | 0.9 | C1-S1 |
| 31-3W-23baa | 490 | 0.6 | C2-S1 |
| 31-4W-12bbd1 | 230 | 0.9 | C1-S1 |
| 32-2E-14bbb1 | 700 | 1.4 | C2-S1 |
| 32-2E-36abb | 680 | 1.2 | C2-S1 |
| 32-2W-20ddd | 1,890 | 4.4 | C3-S1 |
| 32-3W-11bbb | 4,180 | ||
| 32-3W-25ccb | 670 | 1.6 | C2-S1 |
| 32-4W-5abb | 345 | 1.0 | C2-S1 |
| 32-4W-9cc4 | 460 | 1.0 | C2-S1 |
| 32-4W-20add | 420 | 0.3 | C2-S1 |
| 33-2E-6bba | 4,260 | ||
| 33-2E-25bbb | 790 | 0.8 | C3-S1 |
| 33-2E-26bdd | 9,600 | ||
| 33-2W-14ccd | 790 | 2.0 | C3-S1 |
| 33-3W-11bab | 4,260 | ||
| 33-3W-18baa | 620 | 1.7 | C2-S1 |
| 34-2E-2baa | 4,270 | ||
| 34-2E-17ccc | 1,350 | 2.0 | C3-S1 |
| 34-1E-32bdd | 3,540 | ||
| 34-1W-25ddb | 790 | 0.8 | C3-S1 |
| 34-1W-26aaa | 880 | 1.3 | C3-S1 |
| 34-2W-4bba | 1,050 | 2.0 | C3-S1 |
| 34-2W-21add | 620 | 0.8 | C2-S1 |
| 34-3W-31cdc | 580 | 1.6 | C2-S1 |
| 34-3W-35bac | 865 | 1.5 | C3-S1 |
| 34-4W-18aaa | 820 | 3.1 | C3-S1 |
| 35-1W-15ddb | 895 | 2.2 | C3-S1 |
| 35-2W-13dcc1 | 700 | 1.6 | C2-S1 |
| 35-3W-11dca | 800 | 0.8 | C3-S1 |
| 35-3W-17aad | 1,160 | 3.2 | C3-S1 |
| 35-4W-8ccd | 1,160 | 4.2 | C3-S1 |
Prev Page--Utilization || Next Page--Geologic Formations
Kansas Geological Survey, Geology
Placed on web January 2003; originally published August 1961.
Comments to webadmin@kgs.ku.edu
The URL for this page is http://www.kgs.ku.edu/General/Geology/Sumner/05_gw3.html