![]()
Figure 11
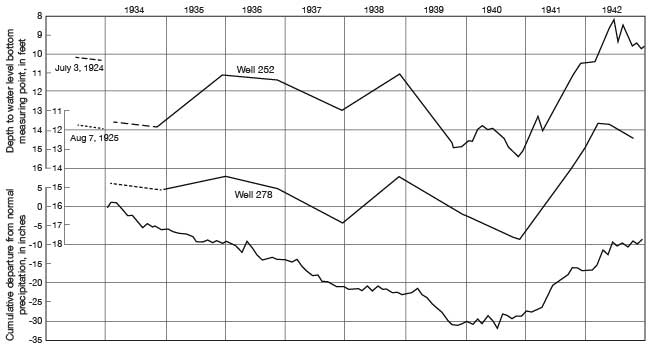
Figure 11--Hydrograph showing the fluctuations of the water levels in two wells in the Arkansas valley in eastern Kearny County and the cumulative departure from the normal monthly precipitation at Lakin. (Precipitation data in figures 11-14 from U.S. Weather Bureau.)
Kansas Geological Survey, Geology
Placed on web Nov. 12, 2007; originally published December 1943.
Comments to webadmin@kgs.ku.edu
The URL for this page is http://www.kgs.ku.edu/General/Geology/Hamilton/fig11.html