Kansas Geological Survey, Open-File Rept. 93-1
Annual Report, FY92--Page 10 of 20
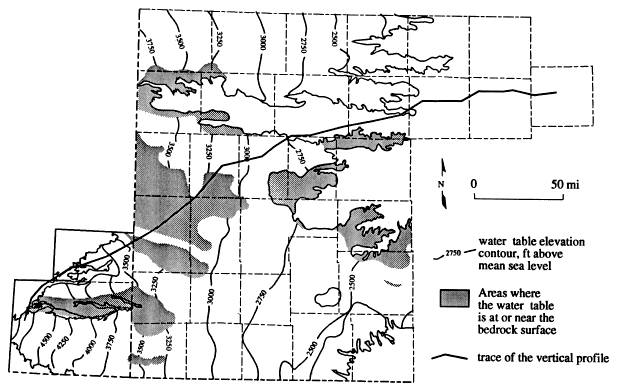
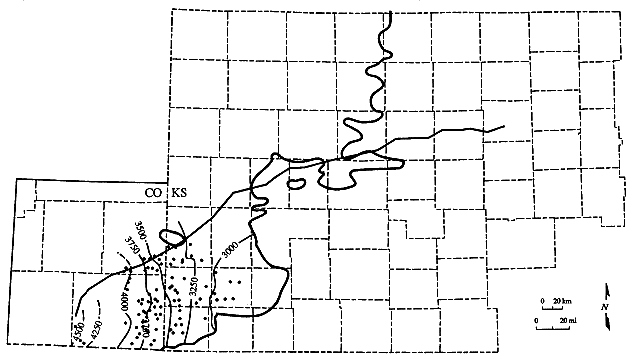
Figure 21--Elevation of the water table in the High Plains aquifer in southeastern Colorado and western Kansas.
The Dakota aquifer is the most geographically extensive of all the bedrock aquifers in western Kansas and southeastern Colorado. In parts of southwestern Kansas and southeastern Colorado the Dakota is hydraulically connected to the High Plains, alluvial valley, and Morrison-Dockum aquifers (Robson and Banta, 1987; Kume and Spinazola, 1985). In central Kansas the Dakota aquifer is hydraulically connected to the Permian sandstone aquifer and alluvial valley aquifers (Macfarlane et al., 1988) (Figure 19). The Dakota aquifer is confined by the Upper Cretaceous aquitard in most of western Kansas and southeastern Colorado and is the near-surface aquifer in western Baca and eastern Las Animas counties in Colorado.
Two distinct ground-water flow corridors can be distinguished from the Dakota predevelopment potentiometric surface map (see Figure 15). The northern flow corridor begins in eastern Las Animas County and extends northeastward across the Arkansas River into west-central and northwestern Kansas and turns eastward into central Kansas. The southern flow corridor begins in eastern Las Animas County and extends eastward into southwestern Kansas and then turns northeastward toward central Kansas. The potentiometric-surface map suggests that the primary recharge area for the Dakota aquifer in Kansas is southeastern Las Animas and western Baca counties in Colorado corridor. The slope of the potentiometric surface in the vertical profile ranges from 24.8 ft/mi (4.70 m/km) in southeastern Colorado to 10 ft/mi (1.9 m/km) in southwestern Kansas to 6.8 ft/mi (1.3 m/km) in central Kansas and reflects the eastward decrease in regional topographic slope. aquifer. The 1,500-ft (460-m) head contour suggests that ground-water flow is focused in this part of the outcrop zone (see Figure 15). In this area salt springs, seeps, and marshes are a common occurrence (Macfarlane et al., 1990). The vertical profile is parallel to one of the flow paths in the northern flow corridor. The slope of the potentiometric surface in the vertical profile ranges from 24.8 ft/mi (4.70 m/km) in southeastern Colorado to 10 ft/mi (1.9 m/km) in southwestern Kansas to 6.8 ft/mi (1.3 m/km) in central Kansas and reflects the eastward decrease in regional topographic slope.
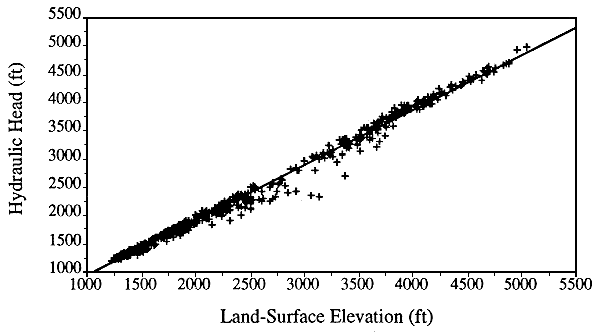
In Figure 22 the overall high degree of correlation (r = 0.993) between hydraulic head in the Dakota aquifer and land-surface elevation suggests that regional topography is a primary control on regional ground-water flow. However, near the 3,250-ft (991-m) land-surface elevation, some of the data points significantly depart from the best-fitting line; this area coincides with areas of western Kansas where the Upper Cretaceous aquitard is thickest. This suggests that the effect of topography on regional flow is diminished in favor of the effect of confining layers above the Dakota aquifer.
Figure 22--Land-surface elevation versus hydraulic head in the Dakota aquifer in southeastern Colorado and western and central Kansas.
The lateral flow component in the Dakota aquifer and the tendency for downward flow from the surface to the Dakota are shown by nearly all the fluid pressure versus depth profiles and the well depth versus fluid pressure plots. Most of the fluid pressure versus depth profiles come from sites located just upgradient from the Dakota aquifer discharge area in central Kansas. In all but two profiles, the slope of the profile in the Upper Cretaceous aquitard-Dakota aquifer interval approximates the hydrostatic rate of increase of fluid pressure but is shifted downward below the hydrostatic line (Figure 23). This indicates a tendency for downward flow across the aquitard. The fluid pressure versus depth profile from NWNWNW sec. 6, T. 14 S., R. 13 W., indicates downward flow across both the Upper Cretaceous aquitard and the upper Dakota to lower zones (Figure 23a, profile 1). The other profile is from the Haberer salt marsh in northwestern Russell County, Kansas (Figure 23c), and is located where the Dakota aquifer discharges to the overlying alluvial aquifer in the Saline River valley. In the upper 130 ft of the Dakota aquifer and the lower part of the alluvial aquifer the slope of the fluid pressure versus depth profile is higher than the slope of the hydrostatic line. This indicates a significant tendency for upward flow from the Dakota to the overlying alluvial aquifer.
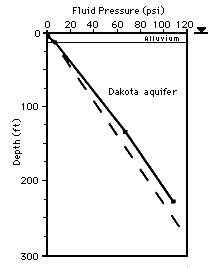
Figure 23a--Fluid pressure-depth profiles from field measurements collected at (1) NWNWNW sec. 6, T. 14 S., R. 13 W., (2) SENENW sec. 29, T. 28 S., R. 26 W., and (3) NESWSWNW sec. 30, T. 28 W., R. 22 W. The dashed line represents the hydrostatic line, 2.309 ft/psi.
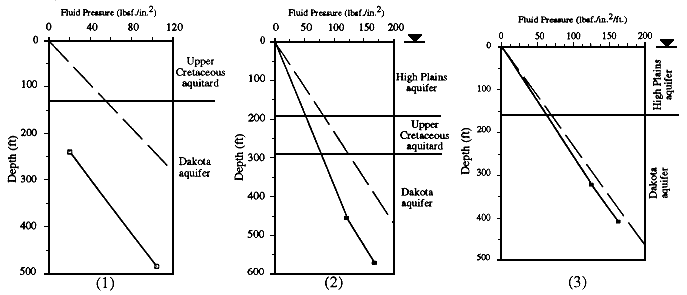
Figure 23b--Fluid pressure-depth profiles from field measurements collected at (1) NWSESW sec. 2, T. 8 S., R. 23 W., (2) NWSWNW sec. 14, T. 12 S., R. 16 W., and (3) SWSWSW sec. 31, T. 12 S., R. 17 W. The dashed line represents the hydrostatic line, 2.309 ft/psi.
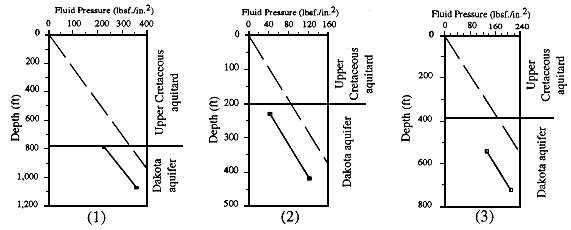
Figure 23c--Fluid pressure vs. depth profile in the Haberer salt marsh in NW sec. 14, T. 12 S., R. 15 W., Russell County, Kansas. The dashed line represents the hydrostatic line, 2.309 ft/psi.
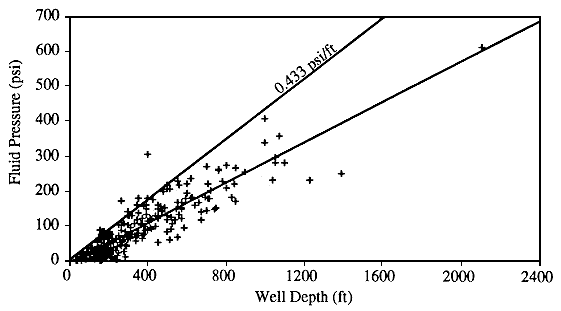
In Figure 24 the fluid pressure versus depth slope for wells where the Dakota aquifer is confined by the Upper Cretaceous aquitard is less than the slope of the hydrostatic line. This indicates that the direction of flow is generally downward across the aquitard and affirms that heads in this part of the aquifer are subhydrostatic. The t-test shows that the slope of the best-fitting line through the data (0.29 psi/ft) is significantly less than the slope of the hydrostatic line (0.433 psi/ft). The value of the correlation coefficient is approximately 0.90. The low slope value and the high correlation suggest that the Dakota aquifer receives some recharge through the aquitard and that flow in the Dakota is uniform and primarily lateral (Fogg and Prouty, 1986), which is supported by the fluid pressure versus depth profiles (Figures 23a, profile 1 and 23b).
Figure 24--Well depth versus fluid pressure for data collected from areas where the Dakota is a confined aquifer. Fluid pressure is calculated from water-level and well-construction information. The slope of the best-fitting line is 0.293. The correlation coefficient r is 0.90 and is statistically significant (p = 0.0001). The best-fitting line slope is significantly less than the slope of the hydrostatic line (p < 0.025).
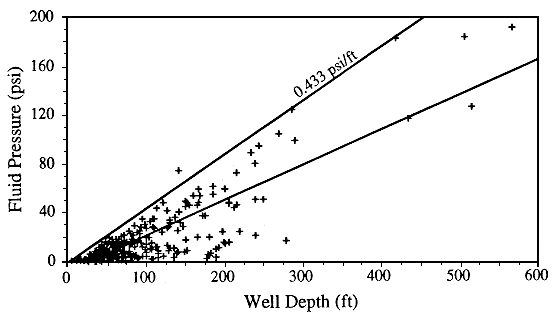
Fluid pressures generally plot below the hydrostatic line where the Dakota is the near- surface aquifer (Figure 25). A t-test shows that the slope of the best-fitting line through the data (0.29 psi/ft) is significantly less than the slope of the hydrostatic line. This indicates that recharge moves readily downward into the Dakota aquifer from the surface in central Kansas and southeastern Colorado where the Dakota is the near-surface aquifer. The value of the correlation coefficient, 0.85, reflects the scatter in the data because of the (1) great variability in flow direction in recharge, discharge, and midline areas of local flow systems (Toth, 1963; Freeze and Witherspoon, 1967) and (2) errors attributed to the depth approximation.
Figure 25--Well depth versus fluid pressure for data collected from areas where the Dakota is the near-surface aquifer. Fluid pressure is calculated from water-level and well-construction information. The correlation coefficient r is 0.85 and is statistically significant (p = 0.0001). The slope of the best-fitting line is 0.289 and is significantly less than the slope of the hydrostatic line (p < 0.025).
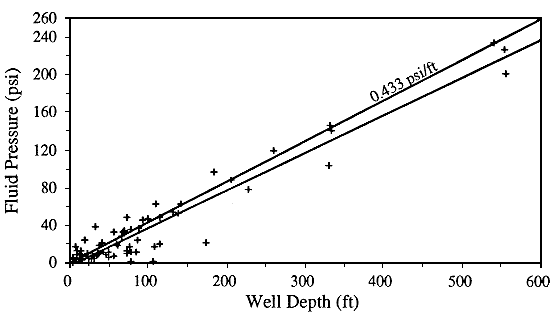
Fluid pressures plot both above and below the hydrostatic line where the Dakota is overlain by the High Plains and alluvial valley aquifers (Figure 26). A t-test shows that the slope of the best-fitting line (0.38 psi/ft) is significantly less than the slope of the hydrostatic line by a small margin. The value of the correlation coefficient is 0.90. The fluid pressure versus depth data show that, where the Dakota aquifer is overlain by the High Plains and alluvial valley aquifers, the vertical flow direction may vary in southeastern Colorado and southwestern Kauggest that the flow system in the Dakota where it is overlain predominantly by the High Plains aquifer in parts of southwestern Kansas and southeastern Colorado is part of the intermediate flow system. the slightly higher slope of the fluid pressure versus depth profile in the uppermost part of the Dakota and High Plains aquifers in Figure 23a (profile 3). The higher slope value and good correlation also suggest that the flow system in the Dakota where it is overlain predominantly by the High Plains aquifer in parts of southwestern Kansas and southeastern Colorado is part of the intermediate flow system.
Figure 26--Well depth versus fluid pressure for data collected from areas where the Dakota is overlain by the High Plains and alluvial valley aquifers. Fluid pressure is calculated from water-level and well-construction information. The slope of the best-fitting line is 0.399 psi/ft. The correlation coefficient r is 0.90 and is statistically significant (p = 0.0001). The best-fitting line slope is significantly less than the slope of the hydrostatic line (p < 0.025).
The Morrison-Dockum aquifer is present in much of southeastern Colorado and the northwestern third of Kansas and is hydraulically connected to the overlying lower Dakota aquifer (Robson and Banta, 1987; Macfarlane et al., 1990). Where there are sufficient data to define a potentiometric surface, it appears that ground-water flow is from southeastern Colorado into Kansas along the same two flow corridors described for the overlying Dakota aquifer (Figure 27). It is assumed that elsewhere the potentiometric surfaces of the two aquifers behave similarly because of their hydraulic connection. In the vertical profile the Morrison-Dockum aquifer is probably recharged primarily by underflow of ground water from sources upgradient from the vertical profile. Higher hydraulic heads in the Dakota aquifer than in the Morrison-Dockum aquifer indicates downward flow from the Dakota (see Figures 15 and 27). The aquifer crops out in a small area around Two Buttes dome in southeastern Colorado and probably receives only a small amount of recharge from infiltrated precipitation and the overlying High Plains aquifer. Discharge from the Morrison-Dockum aquifer is believed to occur where the aquifer pinches out in the vertical profile.
Figure 27--Elevation of the potentiometric surface of the Morrison-Dockum aquifer, southeastern Colorado and southwestern Kansas.
The Permian sandstone aquifer is the second most geographically extensive bedrock aquifer in western and central Kansas. The entire aquifer is confined by the Permian- Pennsylvanian aquitard, except in central Kansas where it is hydraulically connected to the overlying lower Dakota aquifer (see Figure 19). The Permian sandstone aquifer has been used as a disposal zone for oil brines and some industrial wastes in Kansas and Oklahoma since the 1940's (Walters, 1991; Irwin and Morton, 1969). As a result, the effects of underground injection practices appear on the potentiometric-surface map for the 1970's as isolated areas of higher head in between areas of lower head (Figure 28). These anomalous areas of higher hydraulic head are especially pronounced in central Kansas, where most of the disposal has taken place. Nevertheless, the potentiometric-surface map shows that the predominant direction of ground-water flow is from southwestern Kansas to central Kansas toward the pinchout beneath the Dakota and High Plains aquifers and toward areas in southern Kansas where the aquifer crops out at the surface.
Figure 28--Elevation of the potentiometric surface of the Permian sandstone aquifer (Cedar Hills Sandstone) in Kansas. Potentiometric highs are believed to be related to oil-brine disposal in central and parts of southwest Kansas.
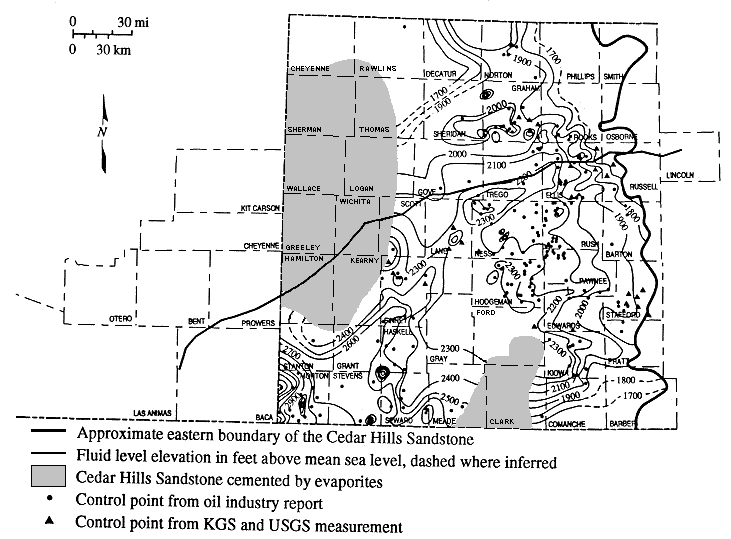
With the exception of the central Kansas region, the Permian sandstone aquifer potentiometric surface is much lower than the potentiometric surfaces of the Dakota, the Morrison-Dockum, and the High Plains aquifers outside the areas that have been most affected by disposal of brines (Figures 19, 22, 27, and 28). This suggests that under predevelopment conditions the primary direction of vertical flow was downward from overlying aquifers to the Permian sandstone aquifer and across the Permian-Pennsylvanian aquitard. In central Kansas the magnitude and direction of predevelopment vertical flow is uncertain. Upward flow to the overlying Dakota and alluvial valley aquifers may have occurred beneath the river valleys where the aquifer is hydraulically connected to the overlying lower Dakota aquifer.