


Kansas Geological Survey, Open-File Rept. 91-1
Annual Report, FY 90--Page 6 of 9
Additional water-chemistry data were collected for the developed areas of the Dakota aquifer in north-central, south-central, and southwest Kansas in FY90. The data comprised analyses obtained for other recent studies not yet in the files for the Dakota aquifer at the KGS, as well as analyses for samples collected from 14 well sites as part of this study. The emphasis was on Cloud, Mitchell, Republic, and Washington counties in the north-central area. Data was added to the KWATCHEM (Kansas Geological Survey WATer CHEMistry data base) system in the relational data-base management system INFO, which is part of the geographic information system ARC/INFO. Contours of chloride concentration and total-dissolved solids were revised from those generated during FY89 based on the additional data. Details in the revised contours in north-central Kansas fit better with different geologic and hydrologic information for the area (Figure 14).
Figure 14. Distribution of chloride concentrations in the Dakota aquifer, north-central Kansas.
Several factors that appear to influence the chemistry of the Dakota aquifer waters in the north-central, south-central, and southwest subareas have emerged based on the past and current data. The factors and the general resultant effects are as follows:
The average age of water withdrawn from the Dakota aquifer as indicated by tritium analyses is greater than 30 years. Even at locations with tritium concentrations above natural levels existing before the early 1960's pulse from atmospheric nuclear explosions, the values were small enough that the wells were predominantly withdrawing older waters mixed with small amounts of recharge younger than 30 years. Tritium contents were generally directly correlated with nitrate and silica concentrations and inversely correlated with chloride concentration and well depth, suggesting that much of the recharge to portions of the aquifer with usable waters is derived locally. Stable isotope data suggest that the water in confined areas of the aquifer is much older than in outcrop areas, because the inferred temperatures of recharging precipitation are cooler in confined portions. The older water could represent recharge that entered during a cooler climate following the last ice age.
Water-quality characteristics important in use considerations were assessed for samples collected in 1990 and analyzed at the KGS and compared to the preliminary use assessment in the FY89 report. The KGS samples were collected, treated, and preserved in a manner to reflect dissolved constituent concentrations. In addition to salinity problems, similar patterns or distributions were observed for fluoride and nitrate concentrations exceeding drinking-water standards. The percentage of samples exceeding the iron and manganese standards are smaller than before because particulates contributed to these elements for some of the earlier values in the data base. As in the preliminary assessment, no samples exceeded the standard for the heavy metals cadmium, chromium, copper, lead, silver, and zinc, and the alkaline earth element barium. A few samples contained levels of selenium or mercury above the drinking-water criteria, similar to the percentages found in the preliminary assessment. Arsenic concentrations near or above drinking water standards were found in many samples, in contrast with previous data. These results are being verified to make sure the arsenic is from the ground water and not some other source. Waters range widely in radon contents; whether the higher concentrations exceed a standard cannot be determined until the federal government establishes a maximum level for radon in water supplies.
Development of ARC/INFO Geographic Information System Applications to Water Quality Investigations
The water-chemistry data base KWATCHEM (Kansas Geological Survey WATer-CHEMistry data base) developed using the INFO relational data-base management system INFO in ARC/INFO was modified to facilitate computer searches of data while saving as much disk space for data storage as practical. A master file containing only information for unique sample identification was added. The previous master file then became a site file containing a variety of location, time, and site characterization data. The structure of the analytical subfiles remained essentially the same as described in the FY89 report.
The initial structure of a user-friendly interface for interactive mapping and query of hydrologic-related data on ARC/INFO was programmed using the ARC macro language. The interface is named KHARCINS (Hydrologic ARC/INFO System) and operates on a Tektronix color terminal. KHARCINS comprises menus which can be pulled down for selection and screen display of geographically-referenced data, such as state, county, township, range, and section boundaries, geologic contacts, rivers, and well locations. Other menus allow selection of line character, point symbols, and color. Hard copies of terminal displays of mapped information can be made on a Tektronix color screen printer attached to the display terminal, or sent to a laser printer or a color plotter. Each point for a water-chemistry record from KWATCHEM that is displayed can be individually selected on the terminal screen, and, via menus, the information from the master file and the analytical files for that site can be displayed in a screen window.
An improved method of displaying water types was developed based on color information theory and the ARC/INFO system. Traditional methods of displaying water types on maps, cross sections, or fence diagrams have generally used symbols for individual analyses or colored areas for clusters of similar water types. This was the approach used in Plate 2 of the FY89 report addendum.
Two approaches to color information theory were applied to water-type maps. The first is a model based on the Briggs color cube in which the 3 primary colors green, blue, and red are equated with the 3 axes of a cube, and coordinates within the cube correspond to hues following additive mixing rules. The second approach is based on adapting the HLS (hue, lightness, saturation) color system to a cube such that one face of the cube becomes the color wheel (hue and saturation) and the third axis is lightness.
The front face of the color cube in both models represents chemical water types and is the diamond portion of a Piper-Hill trilinear diagram. The third axis is equated with total-dissolved-solids (TDS) concentration and indicates variation from the EPA categories fresh (<1,000 mg/L) to usable (1,000-10,000 mg/L) to mineralized (>10,000 mg/L). The cube is divided into 27 subcubes of different color such that each face consists of 9 colored squares.
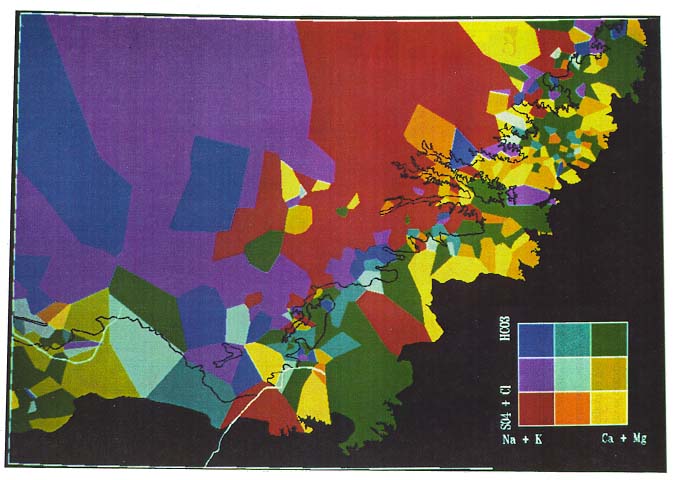
In the Briggs system, the color-axis assignment is (Ca + Mg)/cations, green; (HCO3 + CO3)/anions, blue; total-dissolved solids, red. The axis assignments and hue cell boundary values along the axes were selected to produce color conventions appropriate for water types, i.e, most freshwaters equate to blues and cyans, most saltwaters equate to red and orange hues. In the HLS system the corner squares of the water-type face of the color cube are, in clockwise direction starting from the lower left-hand corner, Na-Cl,SO4 waters = red hues, Na-HCO3 waters = blue, Ca,Mg-HCO3 waters = green, and Ca,Mg-Cl,SO4 waters = yellow. The TDS axis maintains the same hues as in the front face but has darker colors with increasing TDS concentrations.
The hues in either approach are used as attributes for points representing water analyses with data sufficient for calculating water type. Thiessen polygons are then generated around the points by ARC/INFO commands. The polygons are filled with the appropriate hue and displayed on a color Tektronix terminal. Application of the computerized color-cube concept to display of water types allows improved pattern recognition on maps, increases the speed of generating updated maps for updated information, and standardizes the colors for water types. Mapping of the hues displayed on the terminal to matching colors on photographs, a Tektronix screen printer, and the Calcomp plotter is a part of FY90 research. A problem is that photographic colors do not have the range of terminal colors and plotter colors can vary between different times of plot production.
A simplified approach to the color pattern representation of water chemistry uses the only the front face of the color cube. Such a representation is shown in Figure 15 for the HLS system.
Figure 15. Distribution of water-types from the Dakota aquifer of Kansas displayed using a color pattern representation based on hue, color lightness, and color saturation.
Regionalized Classification and Statistical Analysis of Dakota Aquifer Major Ion Chemistry
Many problems in ground-water geochemistry involve attempts to subdivide large regions characterized by ranges of constituent concentrations into smaller areas that are statistically homogeneous with respect to the ground-water geochemistry of the larger region. In the case of the Dakota aquifer, it is useful to classify water types on the basis of major ion chemistry in order to identify regions of distinct ground-water chemistry for the regional ground-water system. From this, it is possible to use the distribution of these regions to develop broader understanding of regional ground-water flow and hydrogeochemistry. Regionalized classification is a technique which provides a quantitative means of transferring a multivariate classification of a set of observations (the water-chemistry data) onto the physical space from which the observations were taken. In this study water-chemistry data for 217 wells in the ground-water quality data base for Dakota aquifer were used in the regionalized classification. The data comprised concentrations of the six major ions, calcium, magnesium, sodium, bicarbonate, sulfate, and chloride.
Analysis of the data shows that a four-group classification of the ground-water chemistry data preserves the distinction between waters (1 and 2) associated with the outcrop and subcrop region, (3) areas of northwest and west-central Kansas where the aquifer is more isolated from sources of recharge, and (4) areas where saline waters from the Permian have recharged the Dakota aquifer in central Kansas. Figure 16 is a map showing the geographic extent of each group in the classification. The four-group classification reveals the complicated pattern of water types in the eastern portion of the study area. In this area, the Upper Cretaceous aquitard overlying the Dakota aquifer is dissected by river valleys and the aquifer is hydraulically connected to the alluvial aquifers. The transitions between the confined portions of the aquifer and those portions which are in more direct contact with the alluvial aquifers lead to considerable variation in water quality at a scale smaller than that addressed in this study. This is reflected in the low probabilities of correct classification in the eastern portions of the study area.
Figure 16. Distribution of water types in the Dakota aquifer of Kansas based on a four-way regionalized classification.
The water-chemistry data was also analyzed statistically using the nonparametric Kendall tau test to determine the correlation between chloride concentration and well depth. The test showed that the counties that fall within the outcrop zone of the Dakota aquifer have little correlation of chloride content with depth due to the effects of the shallow depths of the wells, surface recharge, and the variable thickness of the Dakota strata due to erosional processes. The central tier of counties in Kansas showed a correlation of increasing chloride content with increasing depth, consistent with the confined nature of the Dakota aquifer and saline recharge from underlying strata in the central and western part of the state.
Discriminant analysis was performed for the entire state using 296 water-quality records with complete major-ion determinations. Chloride concentration was used as the group discriminator because it is a conservative constituent and is not affected by water-rock interactions. However, the chloride content of the aquifer waters is affected by cross-formational flow of more saline water between stratigraphic units. The statistical groups of water quality were based on the percentage of chloride concentration expressed in milliequivalent units. This method helped to smooth out the effect of large concentrations of cations or anions that affect the calculation of the discriminant function. The test resulted in a 94.4% correct classification of the major constituent chemistry based on water type. Use of this method can result in a good first approximation for classifying water data. The calcium-bicarbonate (chloride less than 33%) and sodium-chloride (chloride greater than 66%) water types resulted in the best classification results. The mixed water types sometimes were misclassified because another anion in a similar percentage range as the chloride concentration was present.
Other methods such as principal component analysis and factor analysis were used to evaluate the data but the results were not as statistically significant. Part of the reason is the interdependence of the major ions in the water-quality records. However, use of these methods could be valuable for examining relationships among the chemical, hydrological, and geological data for the Dakota aquifer.
Previous page--Geohydrology ||
Next page--FY89 Annual Report
Start of this report ||
Table of Contents