
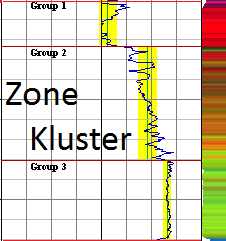
Zone Kluster ("ZeKe")
A Depth Constrained Cluster Analysis - Description
|
|
Zone Kluster ("ZeKe") |
|
| Main Page | Description | Applet | Download | Help | Copyright & Disclaimer | |
Cluster analysis is the name given to a wide variety of mathematical techniques designed for classification. The techniques all have a common goal—to group objects that are similar and to distinguish them from other dissimilar objects on the basis of their measured characteristics. On the basis of everyday experience it should be obvious that individual objects can be grouped or distinguished in different ways according to various criteria we may choose to apply. Since it is the purpose of the FLOW classification in PfEFFER to zone the reservoir into consistent flow units, log variables and log transforms should be chosen that are significantly related to hydraulic properties, either explicitly (such as porosity) or implicitly (such as lithology changes that are associated with changes in pore type). In some types of reservoir, the link may not be so obvious, thus the choice of logs will be more serendipitous. In this event, the results should be evaluated by interpretation or reference to external information or criteria.
The most common class of clustering methods used in geology and other sciences is that of hierarchical analysis (Romesburg, 1984). First, a database of attribute measurements is compiled for the objects to be clustered. Then a matrix of similarities or statistical distances between the objects is computed on the basis of the collective treatment of the attributes. The clustering algorithm is applied to the similarity matrix as an iterative process. The pairs of objects with the highest similarities are merged, the matrix is recomputed, and the procedure repeats. Ultimately all the objects will be linked together as a hierarchy, which is most commonly shown as a dendrogram. At this point, the objects are in one giant cluster. Some decision must now be made concerning where to cut the tree diagram into branches that coincide with distinctive groupings. The choice may be based either on visual inspection, a mathematical criterion that appears to reveal a natural breaking point, or (preferably) some measure that can be used to check potential clusters against some external standard.
In many applications of cluster analysis there are no relationships between objects other than the similarities implied by their attributes. Zones from logs have an additional property: they are ordered along the dimension of depth. This constraint can be used to limit the analysis to the consideration of stratigraphically neighboring units, thus only vertically adjacent zones and clusters may be merged into larger clusters. The method is extremely efficient in computer usage. It is an adaptation of a conventional agglomerative and hierarchical cluster analysis, but has the additional adjacency constraint. The procedure also incorporates the algorithm of incremental sums of squares introduced by Ward (1963). Clusters are defined so that the sum of the variances within the clusters is the minimum possible. By using Ward's method and the adjacency constraint, the succession of zones is replaced by a stratified sequence of partitions that merge into coarser units at higher ranks. The methodology is illustrated by the exceedingly simplified flow-diagram of Figure 28 .
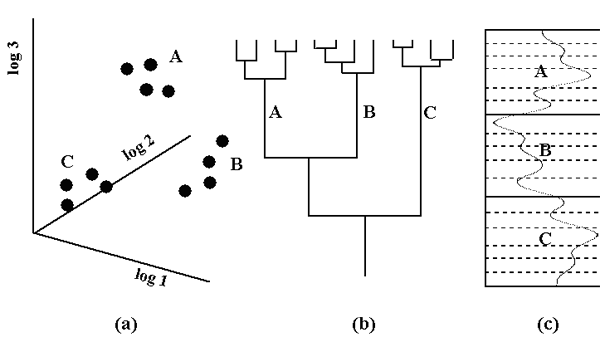 |
| Figure 28: Stages of cluster analysis of log data: (a) multivariate database of zones ; (b) dendrogram of zones according to hierarchical clustering of the zones based on their similarities; (c) classification of zones related to input logs and plotted in order of depth. |
This depth-constrained variation on clustering was introduced by Grimm (1987),
who wrote a computer program for stratigraphic zonation of palynological data.
An interesting case-study application of the technique is to stratigraphic
zonation of logging data is also described by Gill et al. (1993) who compared
the results of stratigraphic subdivision with those of conventional lithostratigraphy
drawn from drill cuttings. Notice also that if only one log variable is used
as the basis for clustering, then the method becomes a log blocking technique.
By the same token, depth-constrained cluster analysis is equivalent to the
operation of multivariate blocking.
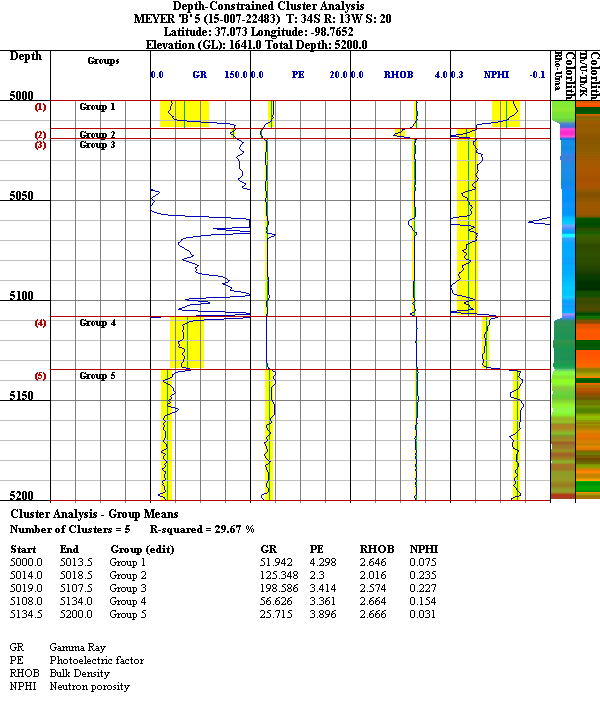
The following is an example of the output from the Cluster Analysis web application.
References:
Description: Pfeffer Pro, Kanasas Geological Survey, pg 58-59
Gill, D., A. Shomrony, and H. Fligelman, 1993, Numerical zonation of log suites by adjacency-constrained multivariate clustering: AAPG Bulletin, in press.
Grimm, E. C., 1987, CONISS: A FORTRAN 77 program for stratigraphically constrained cluster analysis by the method of incremental sum of squares: Computers & Geosciences, v. 13, no. 1, p. 13-35.
Ward, J. H., Jr., 1963, Hierarchical grouping to optimize an objective function: Journal of the American Statistical Association, v. 38, no. 301, p. 236-244.
Romesburg, H. C., 1984, Cluster analysis for researchers: Belmont, CA, Lifetime Learning Publications, 334 p.