
2D & 3D Crossplot Description
|
|
2D & 3D Crossplot Description |
|
|
| Description | Java Source Download | Website Download | Copyright & Disclaimer | |
Work is partially supported by the U.S. Department of Energy (DOE) National Energy Technology Laboratory (NETL) under Grant Number DE-FE0002056.
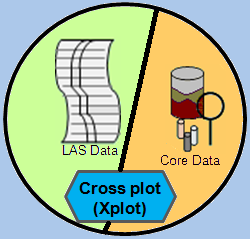
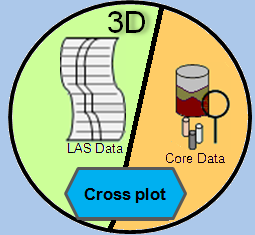
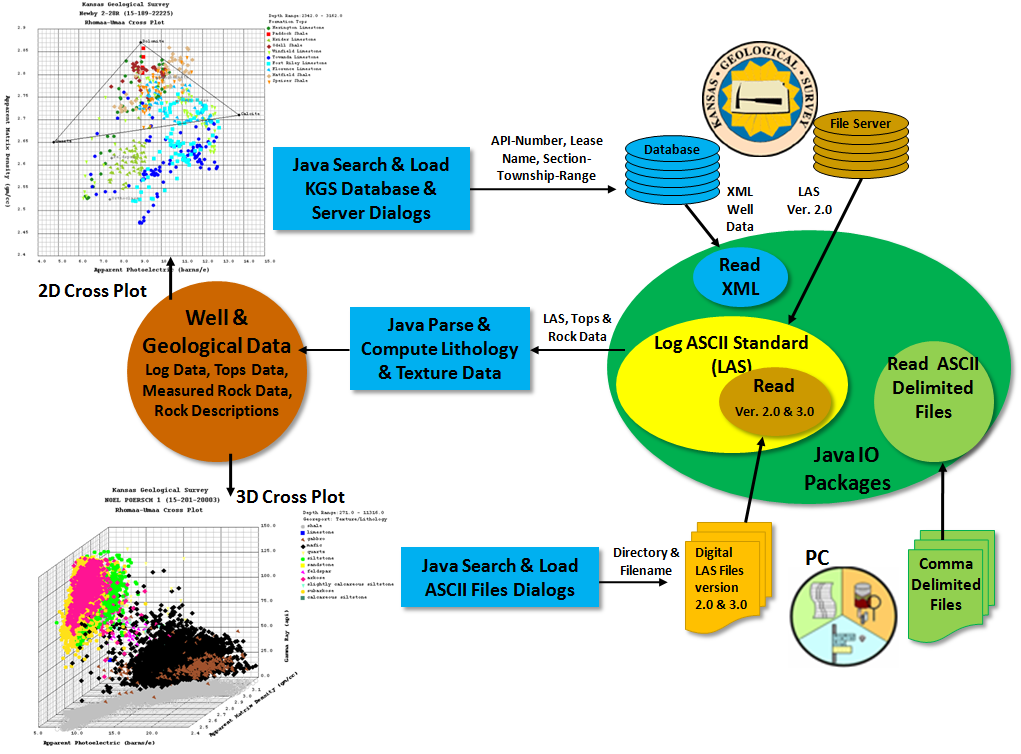
The 2D & 3D Cross Plot Applet was created to assist the user in plotting Log ASCII Standard (LAS) Data and Measured Core Data in a standard 2D or 3D Plot. This Applets are an interactive web applications that allows the user to search, load, parse geological data from the user's PC or from the Kansas Geological Survey (KGS) database & file server. The user can display the following plots,
2D Cross Plot |
3D Cross Plot |
|
|
The web applications will take advantage of over 16 years of Java development experience at the Kansas Geological Survey (KGS) in developing web applications that plot oil & gas data and allows the geologist to perform analysis with that data, i.e. GEMINI Project & Tools on the KGS Web Site.
GEMINI (Geo-Engineering Modeling through INternet Informatics) Project was developed to allow the geologist to seamlessly integrate databases and geological analytical tools across the web. Analytical tools were designed for the independent oil and gas operators, consultants, and widely separated team members within and outside companies.
The web application was designed to create cross plots of LAS log data and measured core data that is loaded into the program. The program can retrieve multiple data types from different sources, but the program can only plot the data that is loaded in any one session. The program does not save the ASCII data, but will save the plots generated as Portable Network Graphics (PNG) files and Portable Document Format (PDF) files. This application can read Log ASCII Standard (LAS) version 3.0 Files developed by the Canadian Well Logging Society .
| Author: John R. Victorine jvictor@kgs.ku.edu
The URL for this page is http://www.kgs.ku.edu/stratigraphic/JAVA_SRC/XPlot/index.html |
|
 |

|