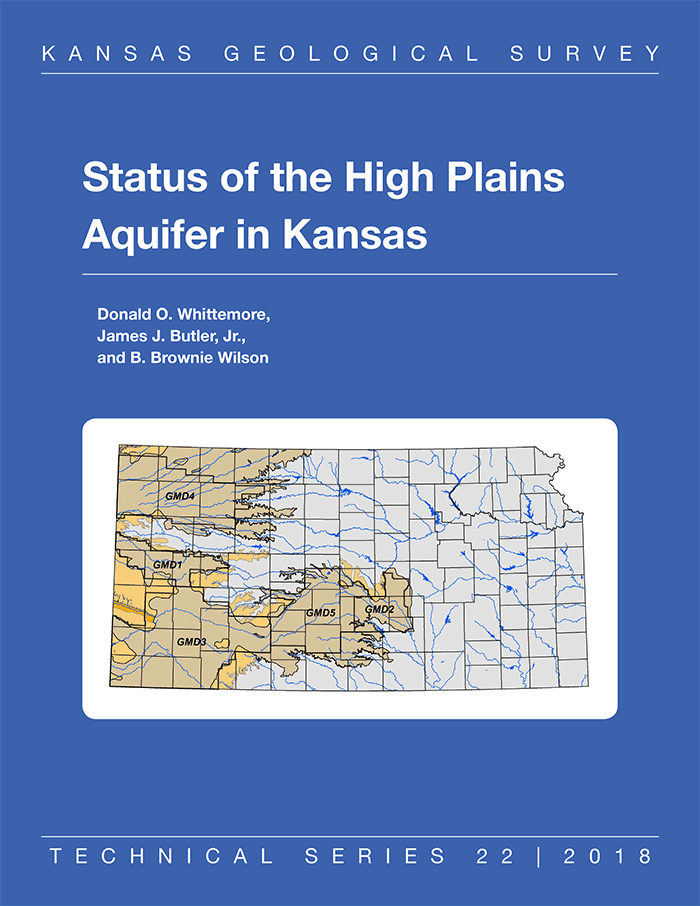
Kansas Geological Survey, Technical Series 22, originally published in 2018
An Acrobat PDF file containing the complete report is available (10.4 MB).
The High Plains aquifer (HPA), which includes the Ogallala aquifer, is the primary source of water for western Kansas and is economically the most important groundwater resource in the state. This aquifer and the river-reservoir systems located principally in eastern Kansas are identified as the two most critical water resource components of the state's Long-Term Vision for the Future of Water Supply in Kansas (https://kwo.ks.gov/water-vision-water-plan/water-vision). Two of the keys to implementing the vision are to clearly define the resource conditions and issues and to review and evaluate progress toward achieving vision goals. This Kansas Geological Survey (KGS) publication addresses these two keys by providing an assessment of the recent and current resource conditions of the HPA. This assessment, which can be used in the future to evaluate progress toward either sustaining or prolonging the life of the aquifer, evaluates water-level and use data for the aquifer for 1996-2016. The KGS plans annual updates to this publication.
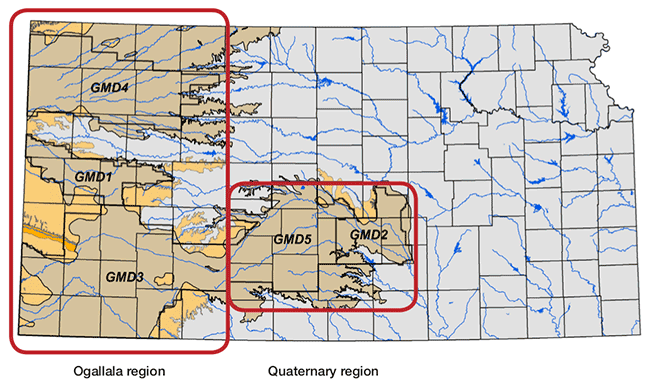
The HPA in Kansas covers most of the western third and much of the south-central portion of the state (fig. 1). The area in the western third of the state is known as the Ogallala part of the aquifer and includes three groundwater management districts (GMDs): Western Kansas GMD1, Southwest Kansas GMD3, and Northwest Kansas GMD4. The south-central, or Quaternary region, includes Big Bend GMD5 and Equus Beds GMD2 (the Great Bend Prairie and Equus Beds portions of the aquifer, respectively). Although the Ogallala and Quaternary regions are both composed of sand and gravel interbedded with silt and clay, differences in climatic conditions, overlying soil types, and depth to water translate into large differences in the prospects for sustainability of the two regions. The range in normal annual rainfall over the Ogallala region is 17-23 inches compared to 23-35 inches over the Quaternary region.
Figure 1—Location of High Plains aquifer, Ogallala and Quaternary regions, and groundwater management districts in Kansas. The tan area indicates where substantial saturated thickness existed prior to irrigation development. The light orange area around the fringes of the main aquifer indicates thinly or non-saturated sediments.
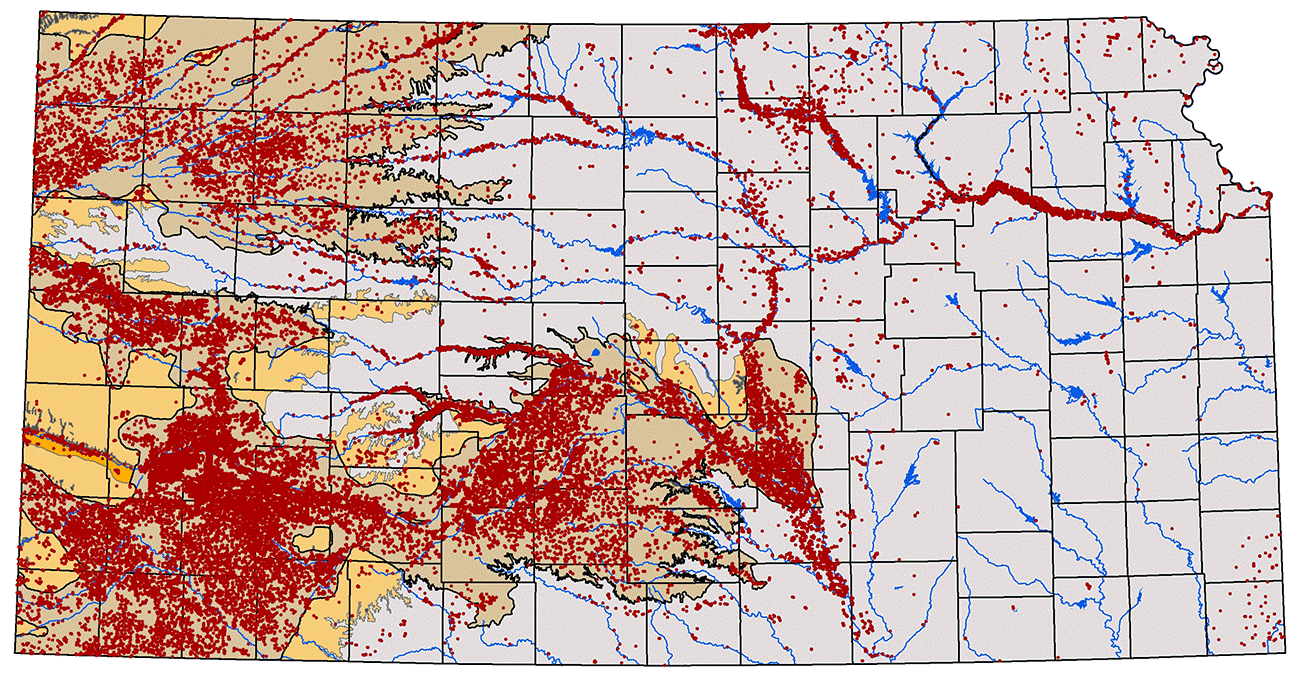
The availability of high quality water-level and water-use data for the HPA in Kansas during the last two decades makes it possible to provide a sound assessment of the aquifer status. Water levels are measured by the KGS and the Division of Water Resources, Kansas Department of Agriculture (DWR), each winter in approximately 1,400 wells (primarily irrigation wells) (fig. 2). More than 35,000 wells with active water rights exist in Kansas; most of these (27,727 as of March 8, 2017) overlie the HPA, with approximately 87% of them used for irrigation (fig. 3). Each water right is required to report water use yearly. As of 2013, 96% (GMD averages range from 85% to more than 99% ) of the irrigation wells and essentially all municipal wells in the GMDs underlain by the HPA had totalizing flowmeters (Lanning-Rush, 2016). Both the water-level and water-use data are reviewed for quality to ensure accurate data.
Figure 2—Locations of the ~1,400 wells measured each winter in the High Plains aquifer by the KGS and DWR.
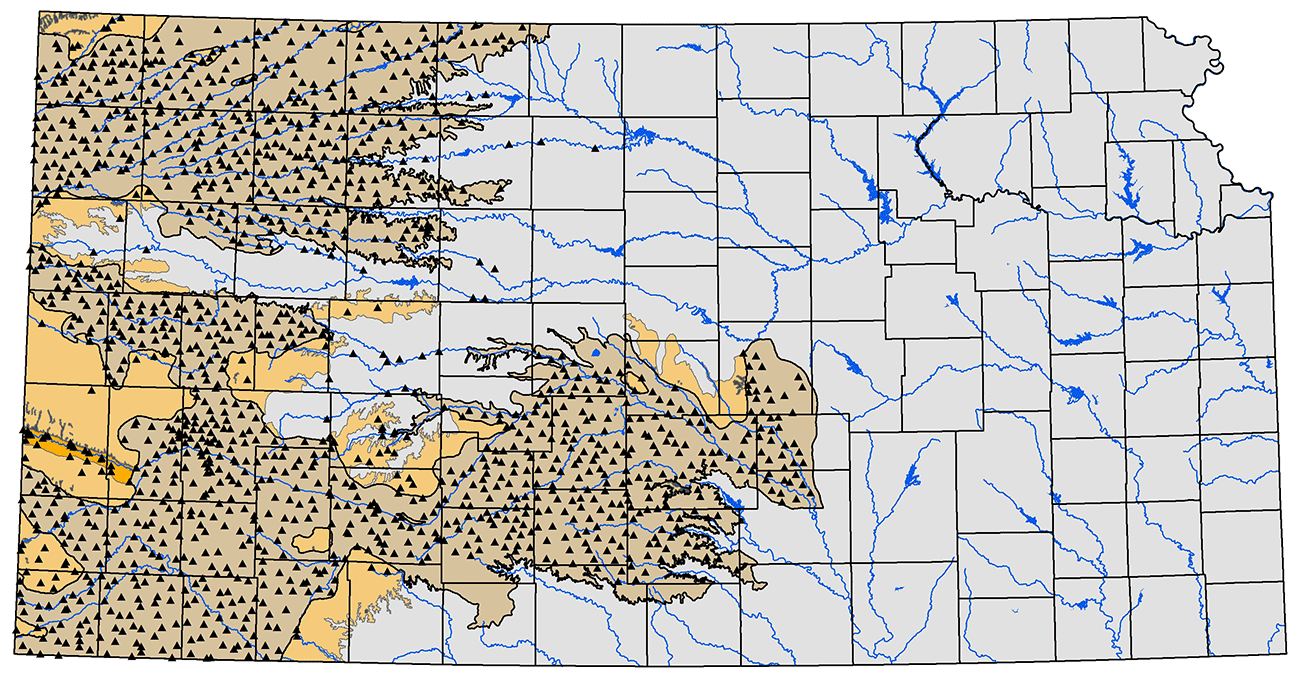
Figure 3—Locations of wells with active appropriated or vested water rights in Kansas.
Although the review process for groundwater levels measured in the winter is completed during the spring, water-use data reviewed with quality-control procedures are not released until the fall of the year following the use.
Groundwater levels have appreciably declined over the Ogallala region of the aquifer since the onset of substantial irrigation development (1940s to 1950s in most areas). The water levels have dropped so much in some areas of the Ogallala region that less than 40% of the original saturated thickness is left (fig. 4). Only very limited areas of the Quaternary region of the aquifer have experienced sizable long-term declines.
Figure 4—Percent change in aquifer thickness in the High Plains aquifer from predevelopment to the average for winter conditions for 2015-2017. The areas of increase in the western third of the state are areas of thin saturated thickness with little to no groundwater development and are not of practical importance.
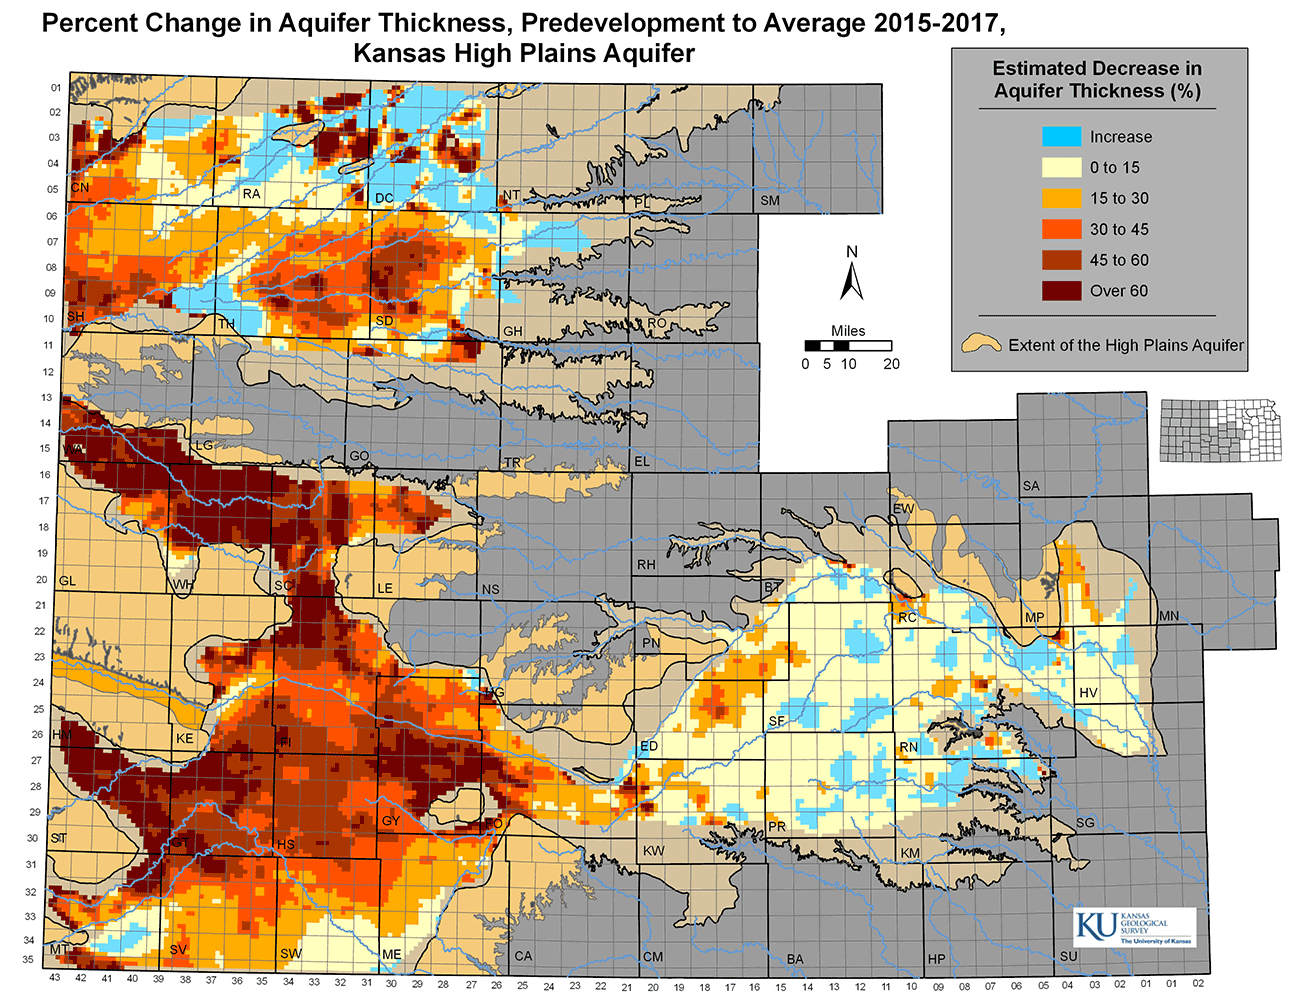
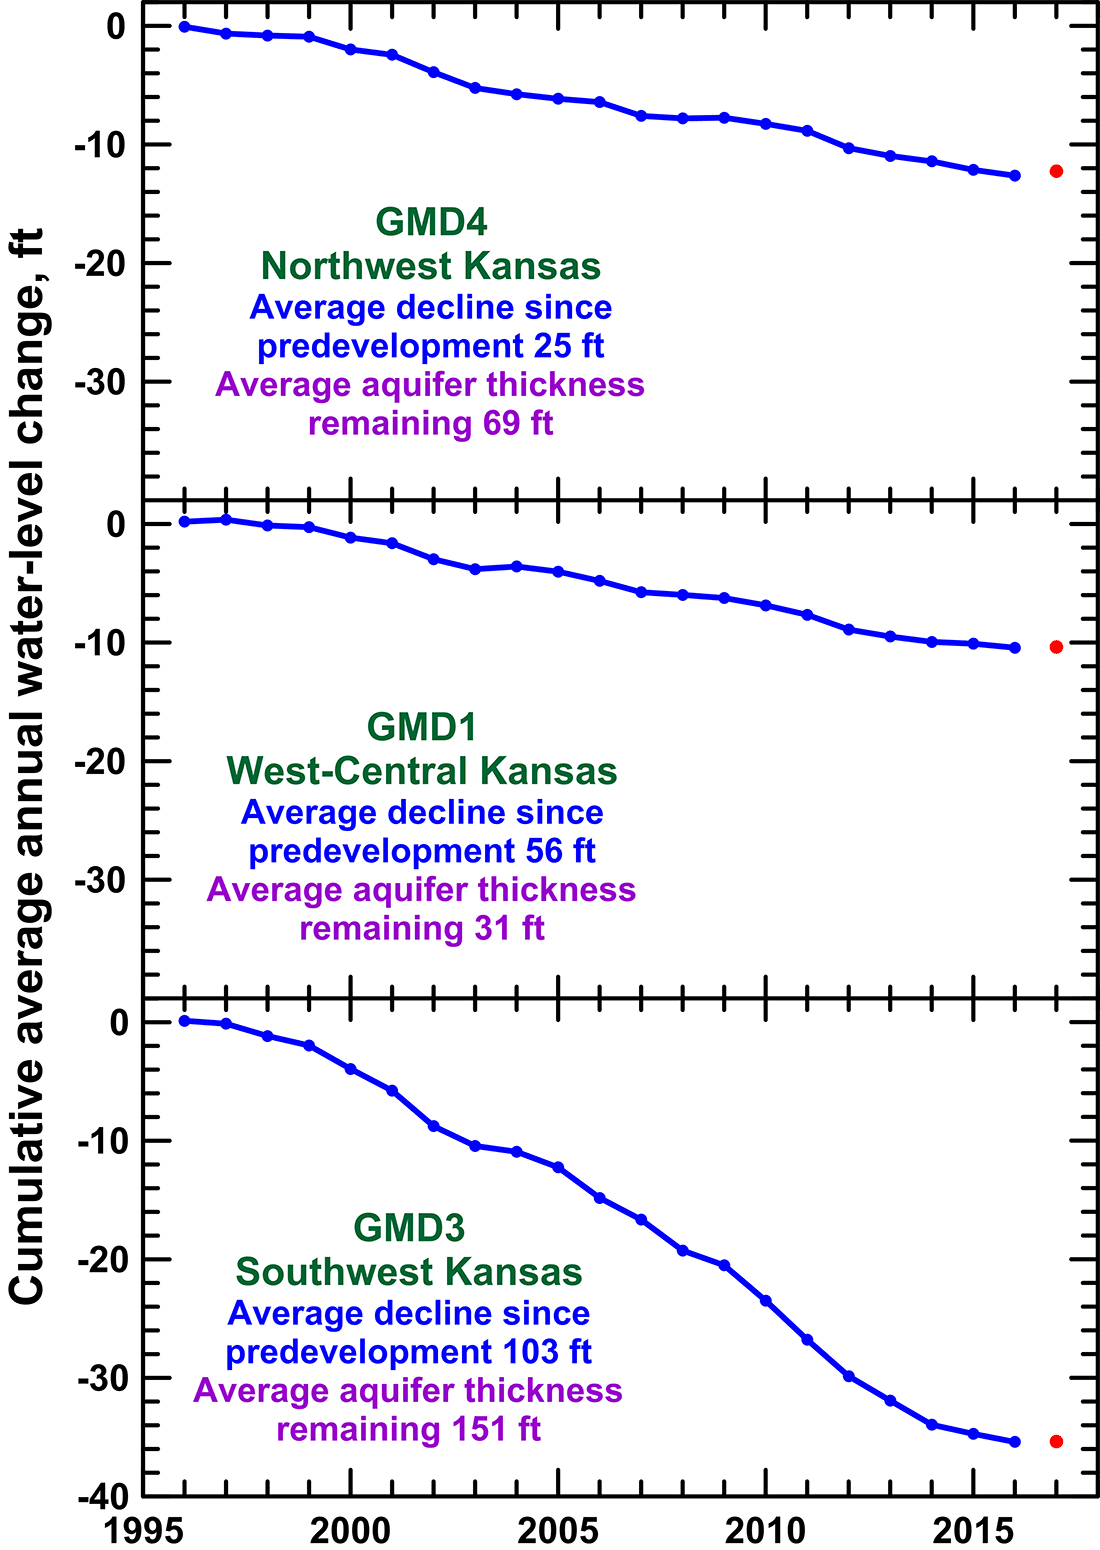
The average declines in groundwater levels in the Ogallala region since predevelopment are 25 ft, 56 ft, and 103 ft for GMDs 4, 1, and 3, respectively. The average aquifer thicknesses remaining in GMDs 4, 1, and 3 are 69 ft, 31 ft, and 151 ft, respectively. During the last two decades (1996-2016), the trends in the average annual water-level decline and the cumulative water-level declines (figs. 5 and 6, respectively) for the three GMDs in the Ogallala region have been the following:
Figure 5—Average annual water-level change for the three GMDs in the Ogallala region of the High Plains aquifer. The values are for the KGS-DWR cooperative network wells measured each winter during 1996-2017. The best-fit trend in the data is shown as a purple line. The change for 2017 (wells measured in winter 2017 and 2018) is shown as a red circle.
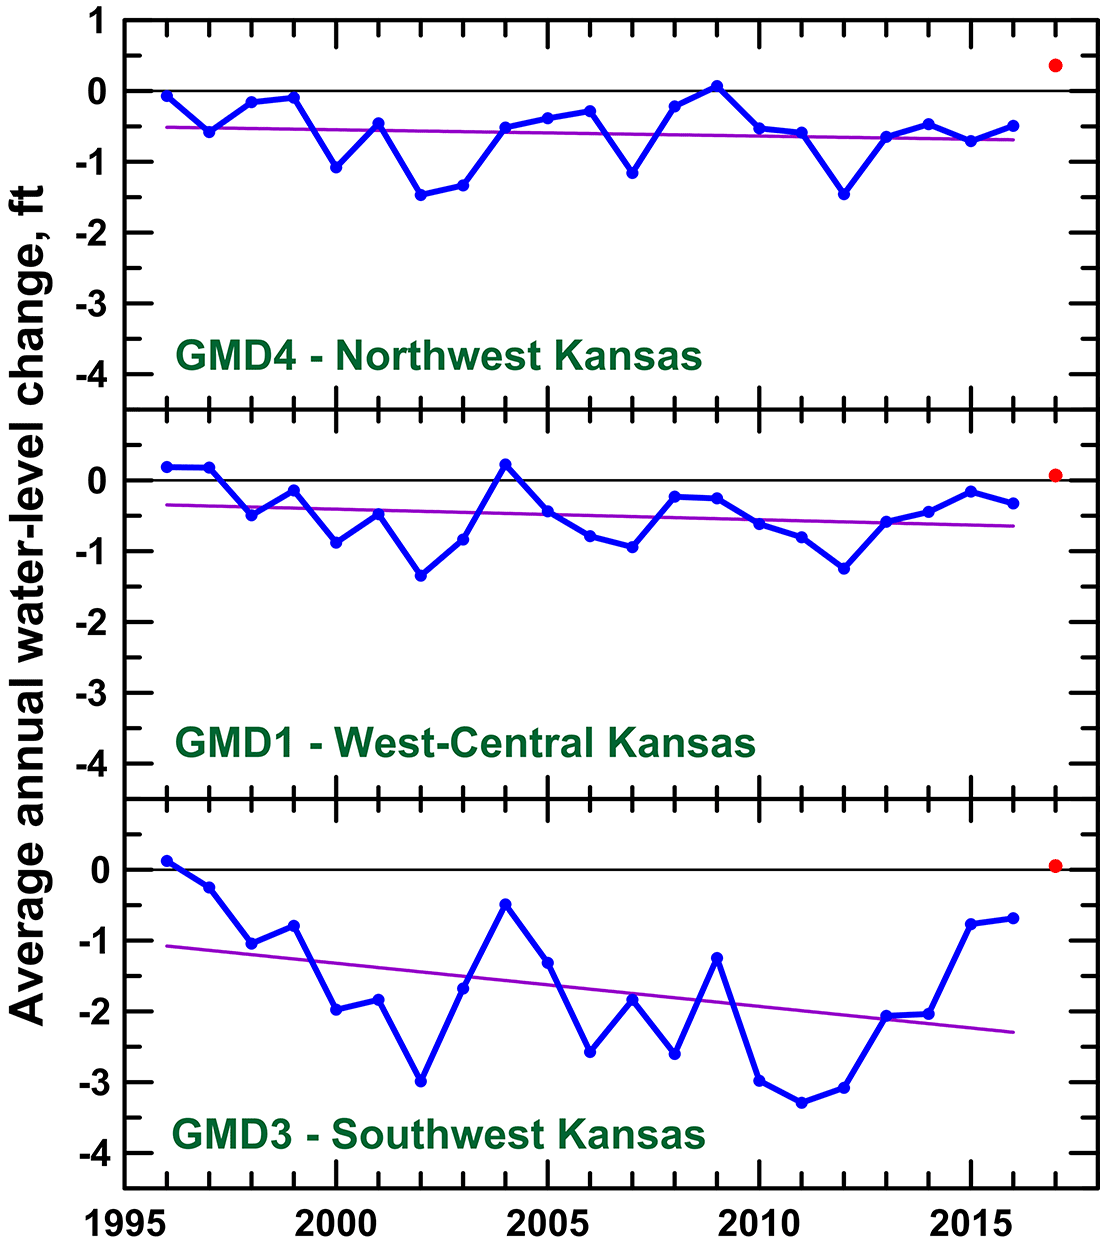
Figure 6—Cumulative change in average annual water levels for the three GMDs in the Ogallala region of the High Plains aquifer. The values are for KGS-DWR cooperative network wells measured each winter during 1996-2017. The additional changes for 2017 (wells measured in winter 2017 and 2018) are shown as red circles.
Values for 2017 indicate a small water-level rise, depending on the GMD, that resulted from wetter than normal conditions, especially during the growing season.
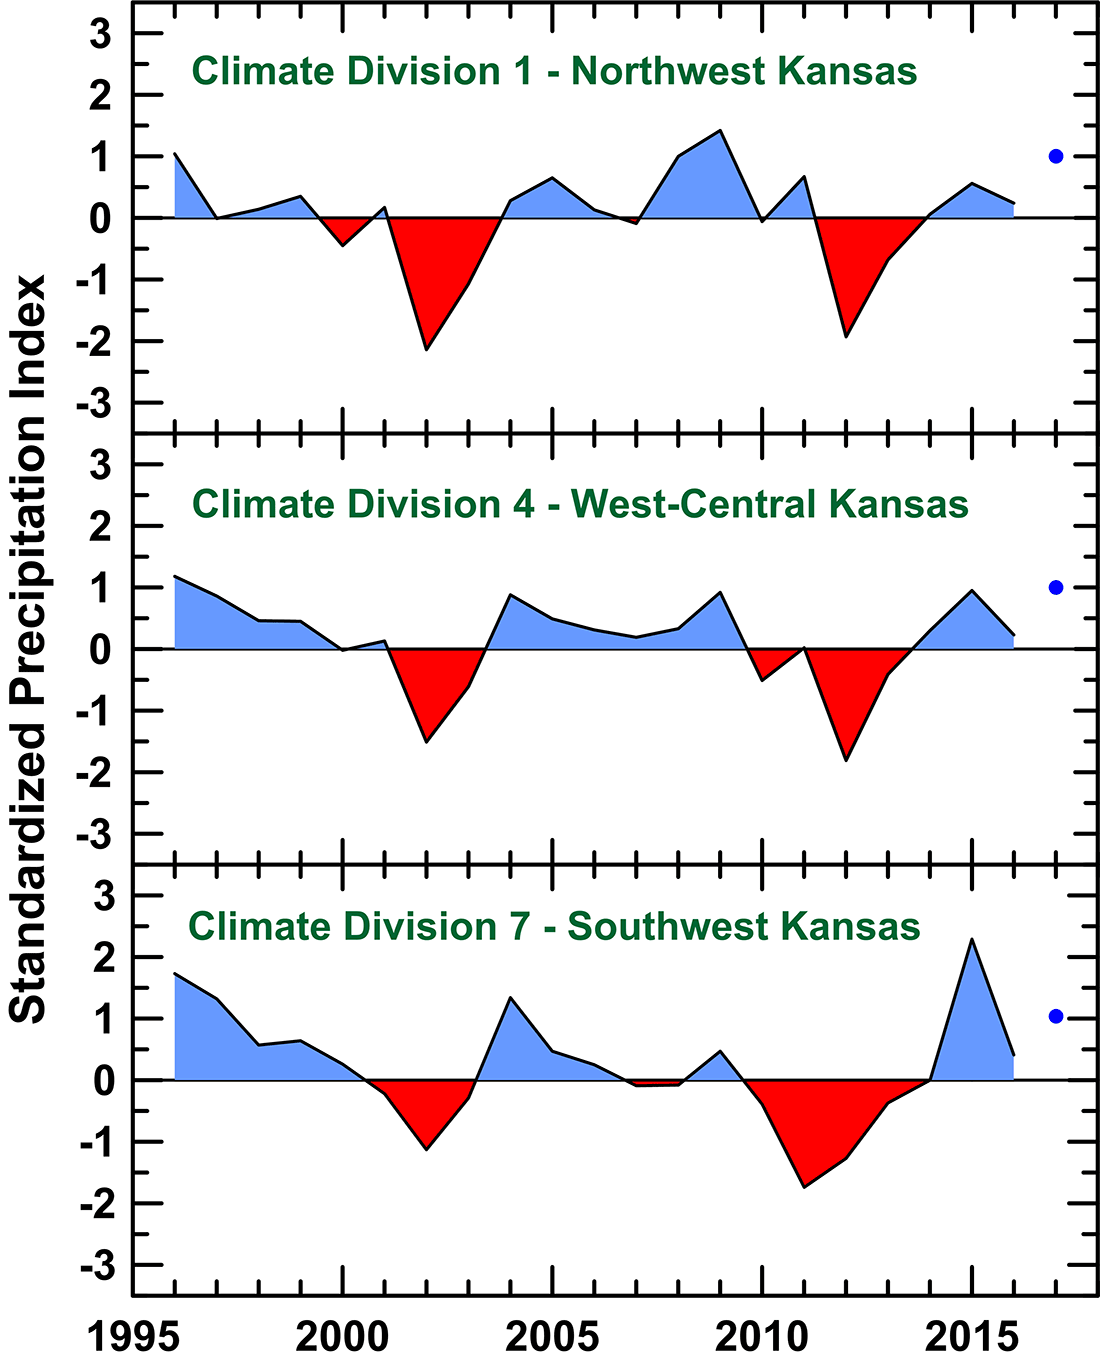
The annual variation in the water-level decline rates (fig. 5) and the change in the slope of the curves for the cumulative change (fig. 6) are directly related to precipitation, which is the primary driver of the annual amount of irrigation water used and the resultant water-level changes. This relationship can be seen in the similar patterns in the rainfall for the three western climate divisions in Kansas (fig. 7) and the annual water-level changes in each of the GMDs that lie within those divisions (fig. 5). Precipitation is represented by the Standardized Precipitation Index (SPI) in fig. 7; the SPI is a climatic index that quantifies precipitation surpluses and deficits and is normalized by long-term records (McKee et al., 1993).
Figure 7—Standardized Precipitation Index for the 12-month period ending in December for the three western climatic divisions in Kansas in the Ogallala region of the High Plains aquifer. Normal precipitation is represented by zero. Positive values represent wetter than normal years, whereas negative values indicate drier than normal years. The average SPI values for 1996-2016 are 0.01 for Climatic Division 1 (GMD4), 0.13 for Climatic Division 4 (GMD1), and 0.20 for Climatic Division 7 (GMD3). The SPI values for 2017 are shown as blue circles.
During the same period (1996-2016), the following trends have been seen in the total annual water use for the three GMDs in the Ogallala region (fig. 8):
Figure 8—Total annual groundwater use for the three GMDs in the Ogallala region for 1996-2016. The best-fit trend in the data is shown as a purple line. Note that the y-axis scales are different for the GMDs.
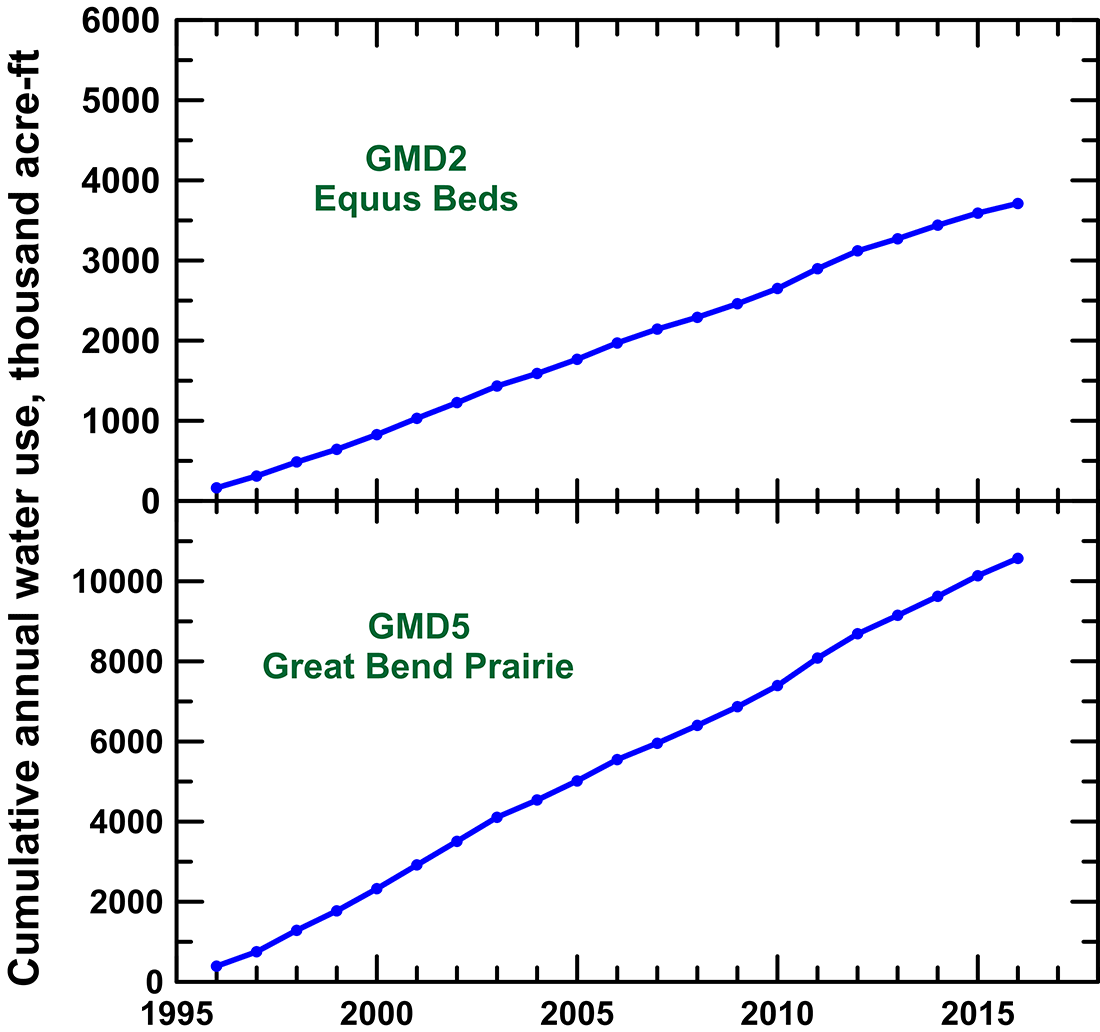
The cumulative water use during the last two decades in GMD4 has been about twice that of GMD1 (fig. 9); cumulative water use in GMD3 has been a little less than five times greater than in GMD4 and ten times greater than in GMD1.
Figure 9—Cumulative annual groundwater use for the three GMDs in the Ogallala region for 1996-2016. The range for the y-axis scale is the same for GMDs 4 and 1 and is five times greater for GMD3.
Water use and precipitation have a high inverse correlation over the GMD areas (Whittemore et al., 2016) (compare figs. 7 and 8). However, little trend exists in the precipitation during the period for GMD 4, although very slight and small decreasing trends in precipitation occurred for GMDs 1 and 3, respectively, during 1996-2016. Therefore, a sizable portion of the water-use decline in GMD1 and some of the decline in GMD3 are expected to be due to decreasing well yields caused by the reduction in aquifer thickness in these GMDs. A portion of the water-use decline is also likely a result of improvements in the accuracy of groundwater use measurements over time as the widespread use of totalizing flowmeters increased. This may partly explain the trend in decreasing water use in GMD3 (fig. 8) that accompanies an increasing rate of water-level decline (fig. 5); another factor for this might be hydrogeologic characteristics of the aquifer such as a greater amount of finer grained material deeper in the aquifer in GMD3.
A high correlation exists between average annual water-level change and annual groundwater use across the GMDs. A recently developed water-balance approach (Butler et al., 2016) can be used to determine the total water use that would result in an average zero water-level change in a GMD, which represents a sustainable level of pumping for the near term. That water use is equivalent to the inflow to the aquifer that balances the pumping withdrawal. Principles of the water-balance equation resulting from plots of average annual water-level change versus annual water use are described in Butler et al. (2016).
A plot for the average annual water-level change versus annual water use during 2005-2016 for GMD4 (fig. 10) indicates that the reduction in average pumping required to achieve a zero water-level change would be 27%. The plot covers 2005-2016 instead of 1996-2016 because the higher percentage of wells with totalizing flow meters during 2005-2016 results in more accurate water-use data. This reduction is substantially smaller than previously predicted based on estimates of natural precipitation recharge and results of numerical modeling analyses. Part of the reason is that additional inflows to the aquifer have been generated during development of the aquifer: capture of groundwater discharge to streams caused by a declining water table, irrigation return flow, enhanced precipitation recharge over irrigated fields due to increased soil moisture allowing infiltration past the root zone and below the influence of soil evaporation, delayed drainage of the newly unsaturated zone after water-level decline, enhanced lateral inflow due to increased groundwater gradient toward more intensively pumped areas, and, in the case of GMD3, potentially enhanced vertical flow from the underlying Dakota aquifer. The irrigation-induced portions of the inflow are expected to diminish because future pumping is likely to decrease. Thus, the percentage reduction in pumping to achieve stable water-level conditions is considered to be short term (on the order of a decade or two) and would be expected to increase somewhat in the future. An additional factor related to the sustainable pumping reduction predicted by numerical models is that the specific yield estimated from the data-based, water-balance approach using a plot such as the one in fig. 10 has been found to be substantially smaller than that used in previous modeling analyses. As a result, numerical modeling analyses require a considerably larger pumping reduction than the data-based, water-balance approach to attain the same rate of water-level decline.
Figure 10—Average annual water-level change versus annual water use for GMD4 for 2005-2016. Water-level data are for KGS-DWR cooperative network wells measured each winter during the period. The solid line is the best-fit straight line to the plot. Heavy snows delayed the 2007 water-level measurements in northwest Kansas, which affected the 2006 and 2007 water-level change values; the average of 2006 and 2007 was used in the plot and is indicated by the label 2006-7. The pumping reduction from the average water use for 2005-2016 to that needed to achieve a zero water-level change is shown by the vertical dashed green lines.
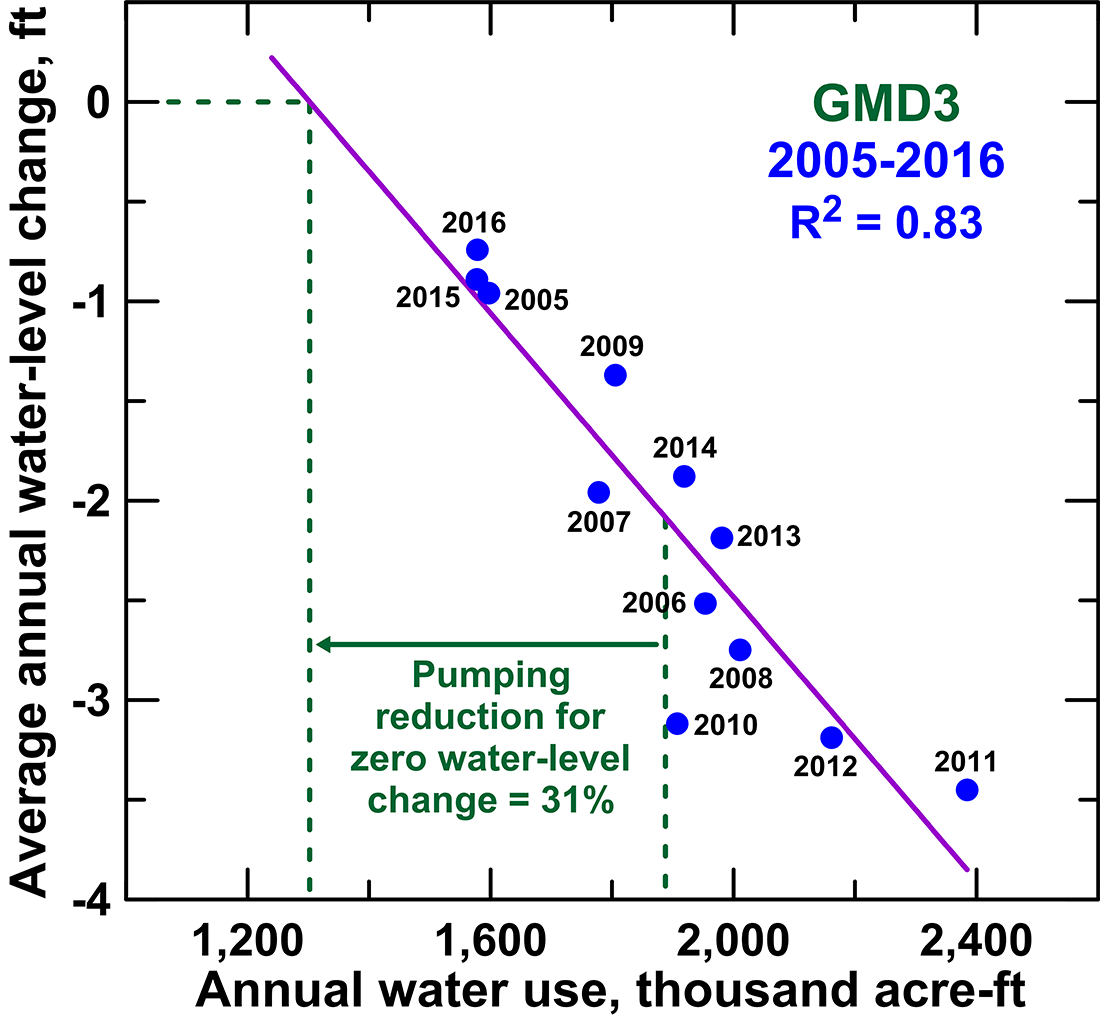
The pumping reduction needed to achieve short-term stabilized water-level conditions for GMD1 is 33% based on 2005-2016 data (fig. 11), which is six percentage points greater than the 27% for GMD4, and that for GMD3 is 31% (fig. 12). Again, even these reductions are much smaller than earlier predicted from estimates of natural precipitation recharge and previous numerical modeling analyses.
Figure 11—Average annual water-level change versus annual water use for GMD1 for 2005-2016. Water-level data are for KGS-DWR cooperative network wells measured each winter during the period. The solid line is the best-fit straight line to the plot. The pumping reduction from the average water use for 2005-2016 to that needed to achieve a zero water-level change is shown by the vertical dashed green lines.
Figure 12—Average annual water-level change versus annual water use for GMD3 for 2005-2016. Water-level data are for KGS-DWR cooperative network wells measured each winter during the period. The solid line is the best-fit straight line to the plot. The pumping reduction from the average water use for 2005-2016 to that needed to achieve a zero water-level change is shown by the vertical dashed green lines.
The importance of the level of the reductions needed for short-term sustainability for the Ogallala aquifer in Kansas is that agricultural economic analyses have shown reductions of 15-20% are achievable without substantially affecting net income (Golden, 2016, 2017); these reductions would be expected to decrease water-level decline rates by half or more and appreciably lengthen the usable life of the aquifer for economic production of crops and other uses.
The average annual pumping amounts during 2005-2016 within GMDs 4, 1, and 3 expressed as depths across each of the entire GMD areas are 1.59, 2.00, and 4.24 in/yr, respectively. The estimated net inflows needed to balance the pumping for a zero water-level change for the same period (from figs. 10-12) are 1.16, 1.34, and 2.93 in/yr for GMDs 4, 1, and 3, respectively. The differences between these inflows and the value of about a half inch of natural precipitation recharge per year commonly assumed (as well as estimated by some numerical models) indicates the importance of the additional factors contributing to inflows discussed earlier.
If the average annual irrigation pumping during 2005-2016 is expressed as a depth over the average reported irrigated acreage, the values are 12.9, 11.6, and 15.6 in/yr for GMDs 4, 1, and 3, respectively. The net inflows in the irrigated areas would be expected to be larger than the values for the entire GMD areas indicated in the previous paragraph due to irrigation return flow, enhanced precipitation recharge over irrigated areas, and drainage of newly dewatered sediments.
The pumping reductions indicated above are the averages for each of the GMDs; water-use reductions needed for more intensely pumped areas within the GMDs would be greater. For example, the pumping reduction required for a zero-water level change for the Sheridan-6 Local Enhanced Management Area (SD-6 LEMA) in GMD4 (fig. 13) based on data for 2002-2012 prior to implementation of the LEMA management changes is 42% as determined from the water-level change versus water use plot for the LEMA (fig. 14; Butler et al., in press).
Figure 13—Location of the Sheridan-6 LEMA in GMD4 on a map of the percent change in thickness of the High Plains aquifer from predevelopment to the average for winter conditions for 2015-2017. The dashed lines are the boundary of GMD4. The inset is an expanded view of the LEMA displaying the locations of pumping wells (red circles) and wells continuously monitored for water levels (blue pluses). Water-level measurements in additional wells were used in fig. 14.
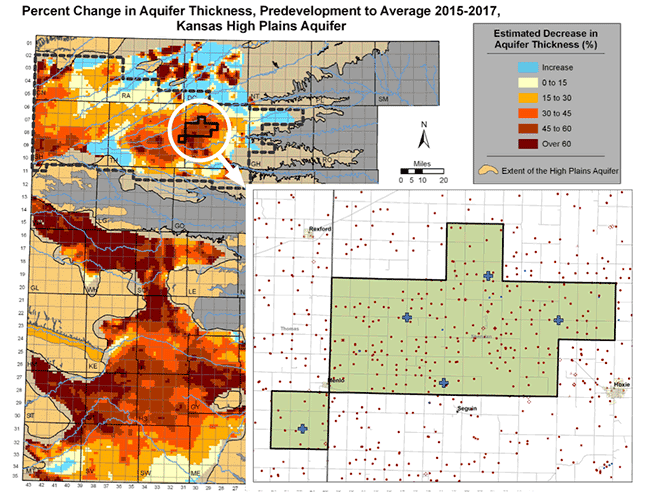
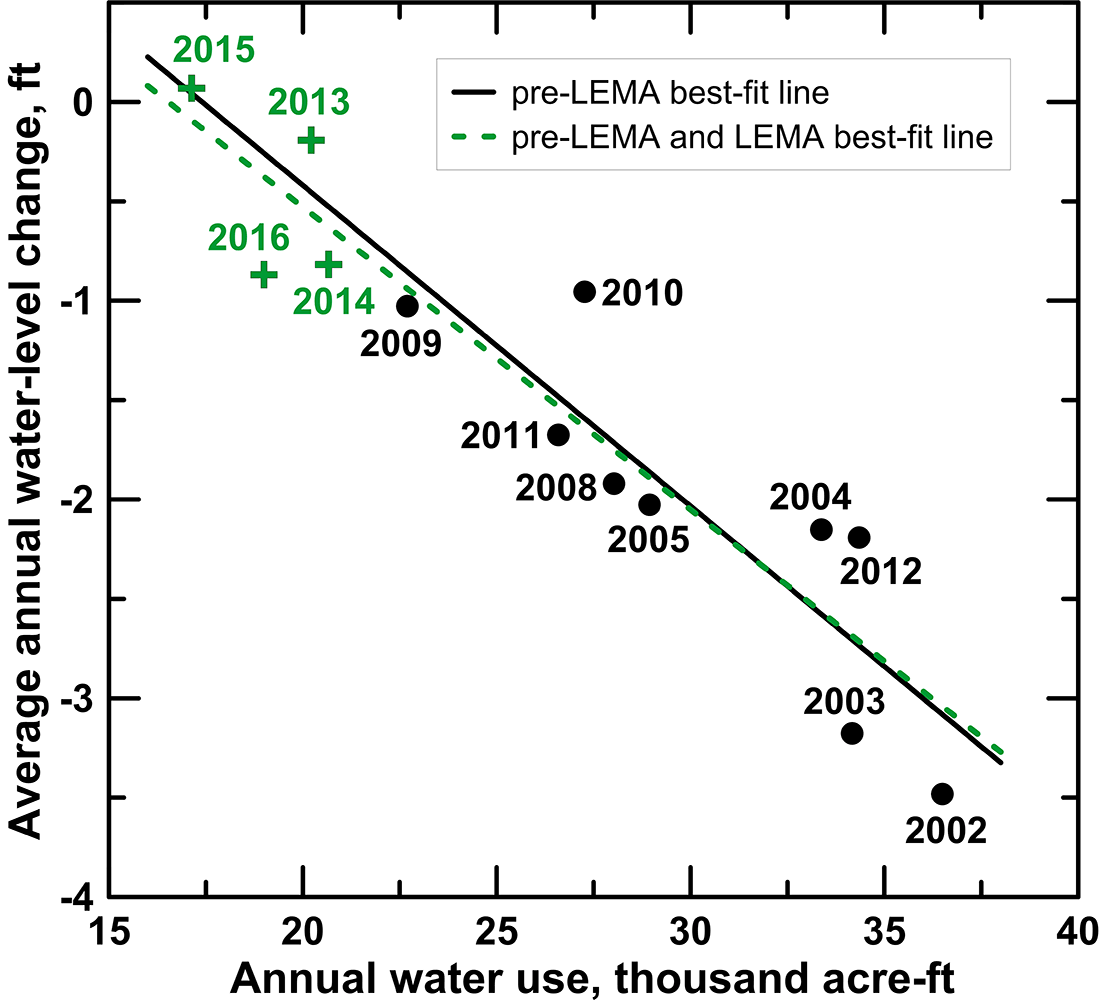
Figure 14—Average annual water-level change versus annual groundwater use for the SD-6 LEMA in GMD4. The solid line is the best-fit line to 2002-2012 data (pre-LEMA operation) and the dashed line is the best-fit line to 2002-2016 data (pre-LEMA and LEMA). The black circles represent the average water-level change for six wells measured every year from 2002 through 2012; the green pluses represent the average water-level change for the pre-LEMA wells with two, three, and four additional wells for 2013, 2014-2015, and 2016, respectively. Heavy snow delayed the 2007 water-level measurements, so the values for 2006 and 2007 are not shown (after Butler et al., in press).
The SD-6 LEMA is the first LEMA established in Kansas based on a 2012 state law that granted GMDs "the authority to initiate a public hearing process to consider a specific conservation plan to meet local goals" (DWR-KDA, n.d.). It is the first known management plan operated by stakeholder irrigators that involves true conservation of groundwater pumping in a substantial irrigated area of the Kansas HPA. Prior management aimed at reducing water use by increasing water efficiency showed that true conservation was not achieved because the water saved often was applied to other irrigated areas or to increase application rates for more water intensive crops (e.g., Peterson and Ding, 2005). Regulatory oversight for the LEMA is in place to ensure that all within the management area comply with the five-year target of reduced average pumping by 20%; the oversight includes water-level measurements and metering of all non-domestic water use.
The first four years of the LEMA operation for which data are available (2013-2016) indicate that the average pumping reduction (32%) was greater than the 20% target for the first five years. Figure 14 displays the substantially smaller water-level declines (and one year with a slight rise) that occurred during the LEMA period of 2013-2016, all of which were less than the declines during the pre-LEMA period of 2002-2012. The annual water use for each of the LEMA years was also less than all of the values for the pre-LEMA period. The annual water-level change and water-use values for the LEMA data plot along essentially the same best-fit line as for the pre-LEMA period (fig. 14), indicating that the average annual water-level change responded to changes in water use in the same manner between the pre- and LEMA periods (Butler et al., in press).
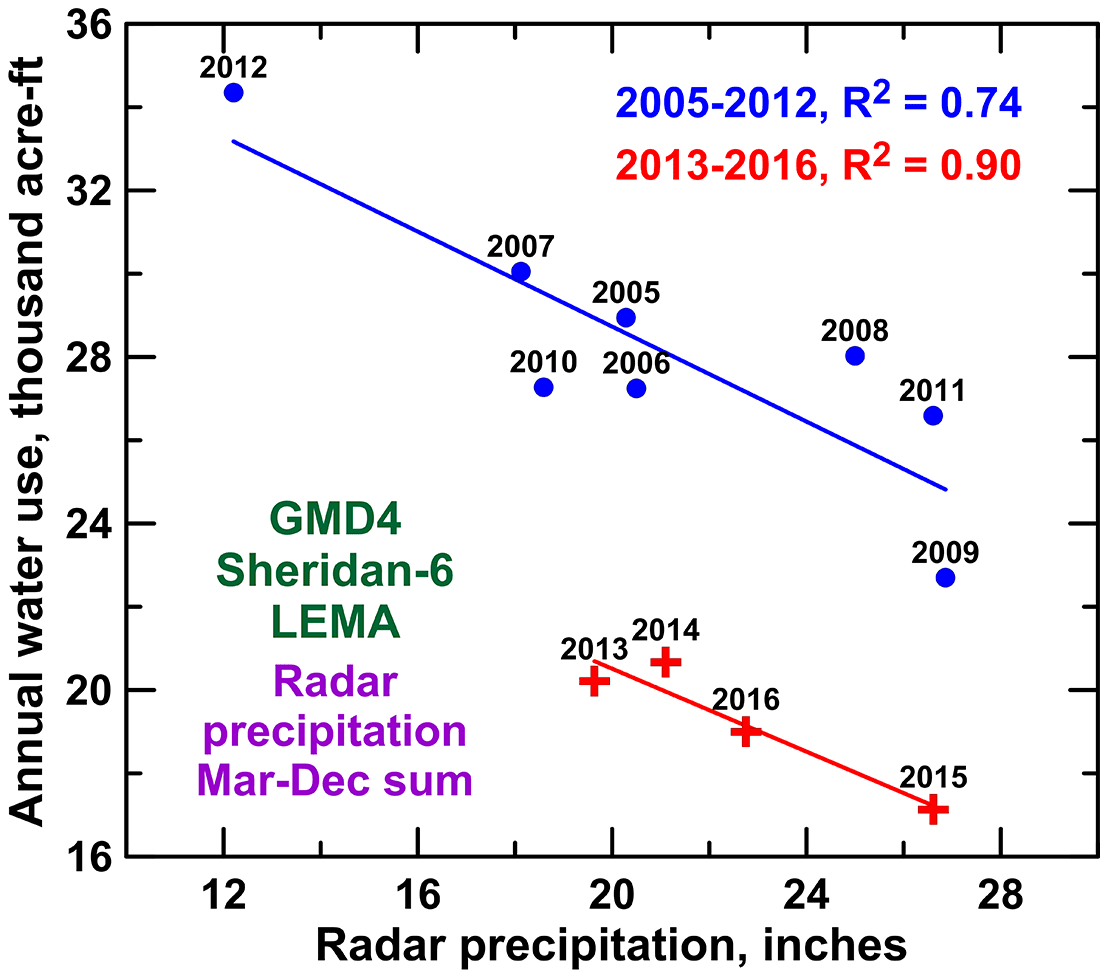
Part of the reason for the greater pumping reduction during the first four years of the LEMA than the five-year 20% target was that the climate was generally wetter than normal. However, annual water use versus precipitation for the LEMA area (fig. 15) illustrates that true water conservation was still achieved. The best-fit line for the LEMA data is shifted downward from the best-fit line for the pre-LEMA period. This indicates that for climatic conditions of 2013-2016 that were similar to those for part of 2005-2016, the annual water use was substantially lower. At an annual precipitation of 20 in on fig. 15, the annual water use divided by the irrigated area of the SD-6 LEMA during 2005-2012 was equivalent to 14.0 in/yr compared to 10.4 in/yr for the LEMA period, a reduction of 26%. For an annual precipitation of 26 in on fig. 15, the annual water use divided by the LEMA irrigated area during 2005-2012 was equivalent to 12.3 in/yr compared to 8.9 in/yr for the LEMA period, a reduction of 28%. Thus, the true conservation for the four years of LEMA operation adjusted for climate was in the range of 26-28%, still greater than the original target of 20%.
Figure 15—Annual water use versus the sum of March-December radar precipitation for the area of the SD-6 LEMA in GMD4. The blue circles and line represent pre-LEMA (2005-2012) data and best-fit line, and the red pluses and line represent the LEMA (2013-2016) data and best-fit line. Radar data are not available until 2005, thus the pre-LEMA data are only for 2005-2012.
Groundwater levels in the Quaternary region of the HPA in south-central Kansas have declined appreciably only in parts of the western portion of the region and in localized areas such as McPherson County (fig. 4). Areas of both small declines and increases in water level are displayed in fig. 4; these vary from year to year depending on whether drought or wet conditions are prevalent. Fluctuations in the annual water-level change for the Quaternary region (fig. 16) are substantially greater than for the Ogallala region (fig. 5). The Quaternary region has greater precipitation and shallower depths to water than the Ogallala region and areas of dune sand overlie the aquifer. These conditions result in substantial recharge to the aquifer and greater water-level rises during wet years. During droughts, discharge of groundwater to streams is substantial in the Quaternary region, adding to the effect of pumping in creating water-level declines.
Figure 16—Average annual water-level change for the two GMDs in the Quaternary region of the High Plains aquifer. The values are for KGS-DWR cooperative network wells measured each winter during 1996-2017. The best-fit trend in the data is shown as a purple line. The change for 2017 (wells measured in winter 2017 and 2018) is shown as a red circle.
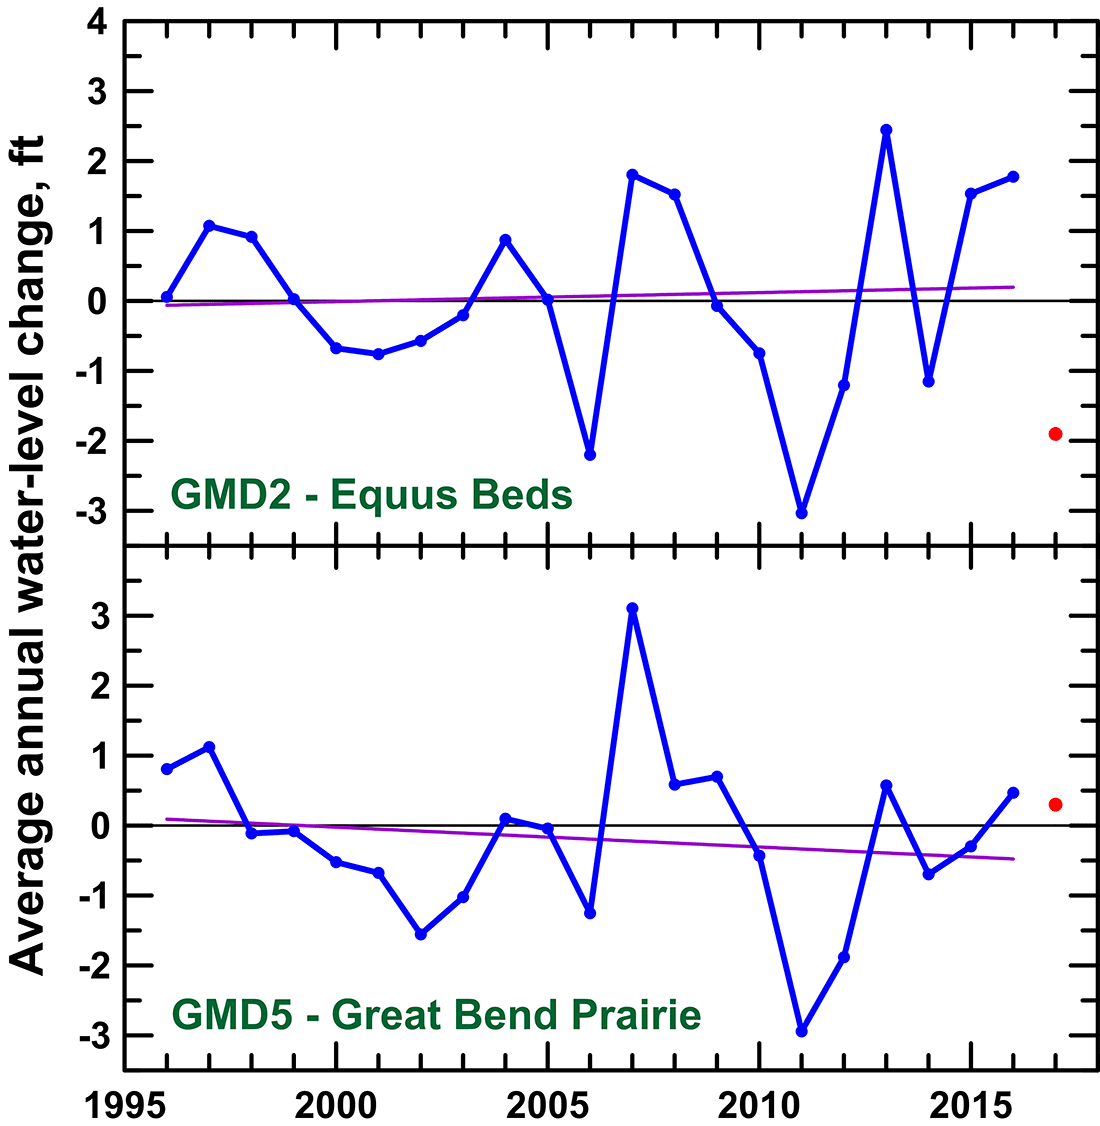
The average declines in groundwater levels in the Quaternary region since development of substantial irrigation are 4.7 ft for GMD2 and 8.2 ft for GMD5. The average aquifer thicknesses currently remaining are 94 ft for GMD2 and 107 ft for GMD5. For the last two decades (1996-2016), the trends in the average annual water-level change and the cumulative changes for the two GMDs in the Quaternary region (figs. 16 and 17, respectively) have been the following:
Figure 17—Cumulative change in average annual water levels for the two GMDs in the Quaternary region of the High Plains aquifer. The values are for KGS-DWR cooperative network wells measured each winter during 1996-2017. The additional changes for 2017 (wells measured in winter 2017 and 2018) are shown as red circles.
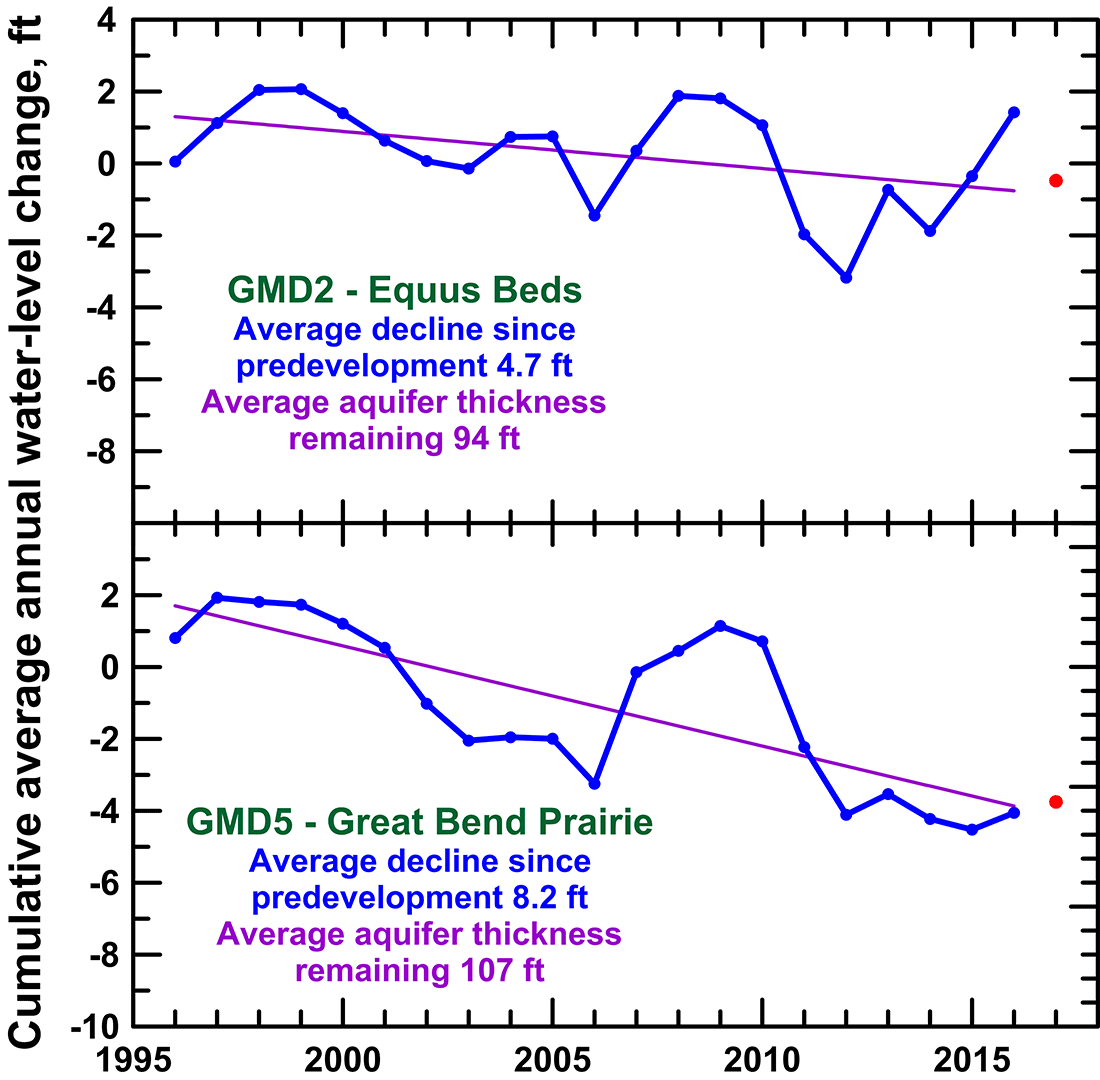
Although fig. 16 shows an insignificant trend for the average annual water-level change for GMD2, fig. 17 indicates a decreasing trend in the cumulative annual water-level change. The explanation for an insignificant trend in the annual change is that three out of the last four years have had substantial water-level rises; the explanation for the decreasing cumulative trend is that the sum of the negative annual water-level changes has been greater than that for the positive changes.
The value for 2017 indicates a substantial water-level decline in GMD2, which would change what appears to be a very slight increasing trend in water level to a very slight decreasing trend in fig. 16; the cumulative change for 1996-2016 was an increase of 1.4 ft compared to the decline of 1.9 ft for 2017. In comparison, the value for 2017 for GMD5 is a very slight rise in water levels.
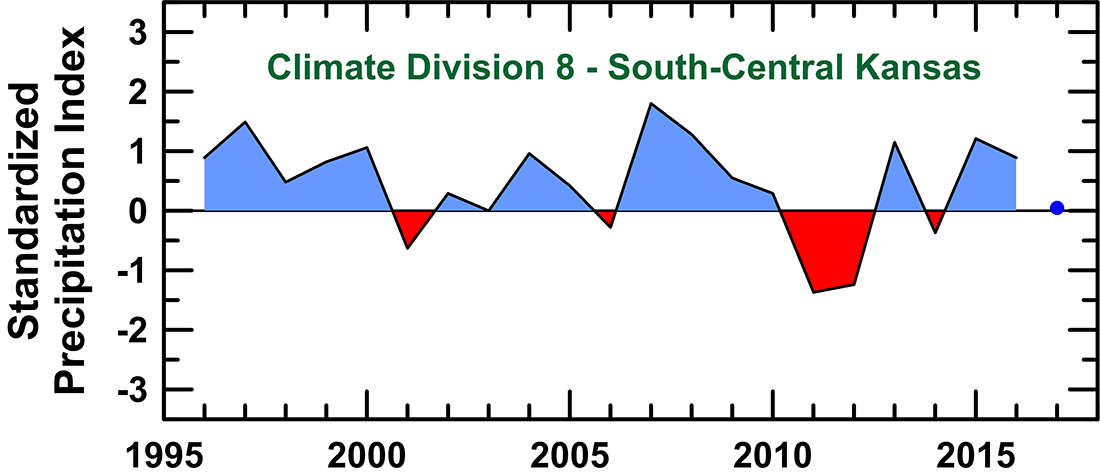
Just as for the three western GMDs, the annual variation in the water-level change (fig. 16) and the change in direction of the lines for the cumulative change (fig. 17) are directly related to precipitation as expressed by the Standardized Precipitation Index (fig. 18). This relationship can be seen in the generally similar patterns for the rainfall for Kansas climate division 8 (fig. 18) and the water-level changes in GMDs 2 and 5 that lie within this division (fig. 16). Although the average SPI values for the three western GMDs in the Ogallala region for 1996-2016 are 0.2 or less, the average SPI for the same period for climate division 8 is 0.47, which is slightly wet, as apparent in the distribution of blue (wetter than normal) areas versus red (drier than normal) areas in fig. 18.
Figure 18—Standardized Precipitation Index for the 12-month period ending in December for the south-central climatic division in Kansas during 1996-2016. GMDs 2 and 5 lie within climatic division 8. Normal precipitation is represented by zero. Positive values represent wetter than normal years, whereas negative values indicate drier than normal years. The average SPI value for 1996-2016 is 0.47. The SPI value for 2017 is shown as a blue circle.
During the same period (1996-2016), the following trends have been seen in the total annual water use for the two GMDs in the Quaternary region (fig. 19):
Figure 19—Total annual water use for the two GMDs in the Quaternary region of the High Plains aquifer for 1996-2016. The best-fit trend in the data is shown as a purple line.
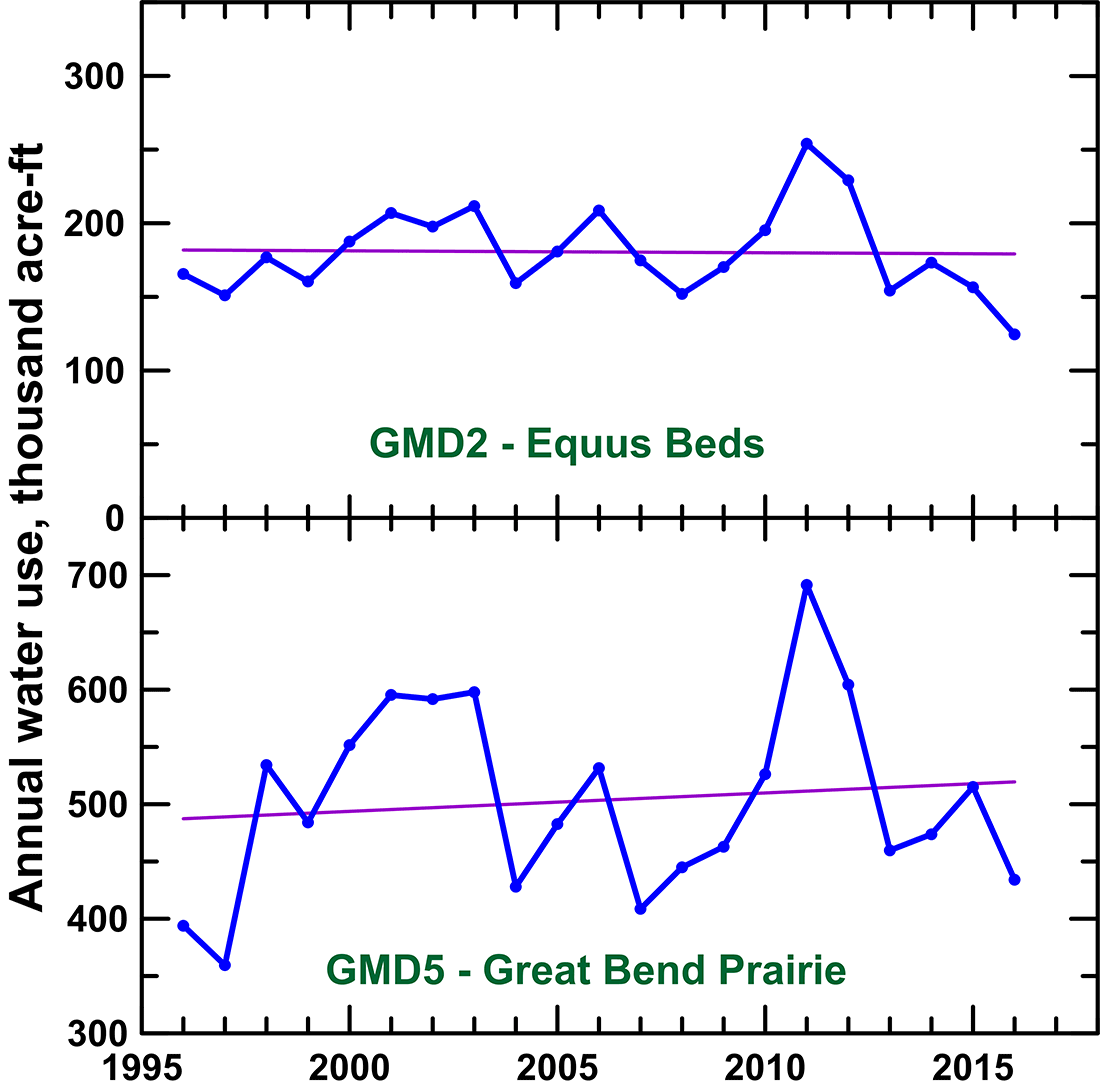
The cumulative water use during the last two decades in GMD5 has been nearly three times that of GMD2, mainly reflecting the larger area of GMD5 than GMD2 (fig. 20).
Figure 20—Cumulative annual groundwater use for the two GMDs in the Quaternary region for 1996-2016. The range for the y-axis scale for GMD5 is twice that for GMD2.
Annual water use and precipitation have a high inverse correlation over the Quaternary region (compare figs. 18 and 19). A small decreasing trend occurred in the annual precipitation for the climatic division encompassing GMDs 2 and 5 during 1996-2016. This trend might explain part of the increasing trend in water use in GMD5. If the average SPI for the south-central climatic division returned to near normal, the water use for both GMDs 2 and 5 might be expected to increase.
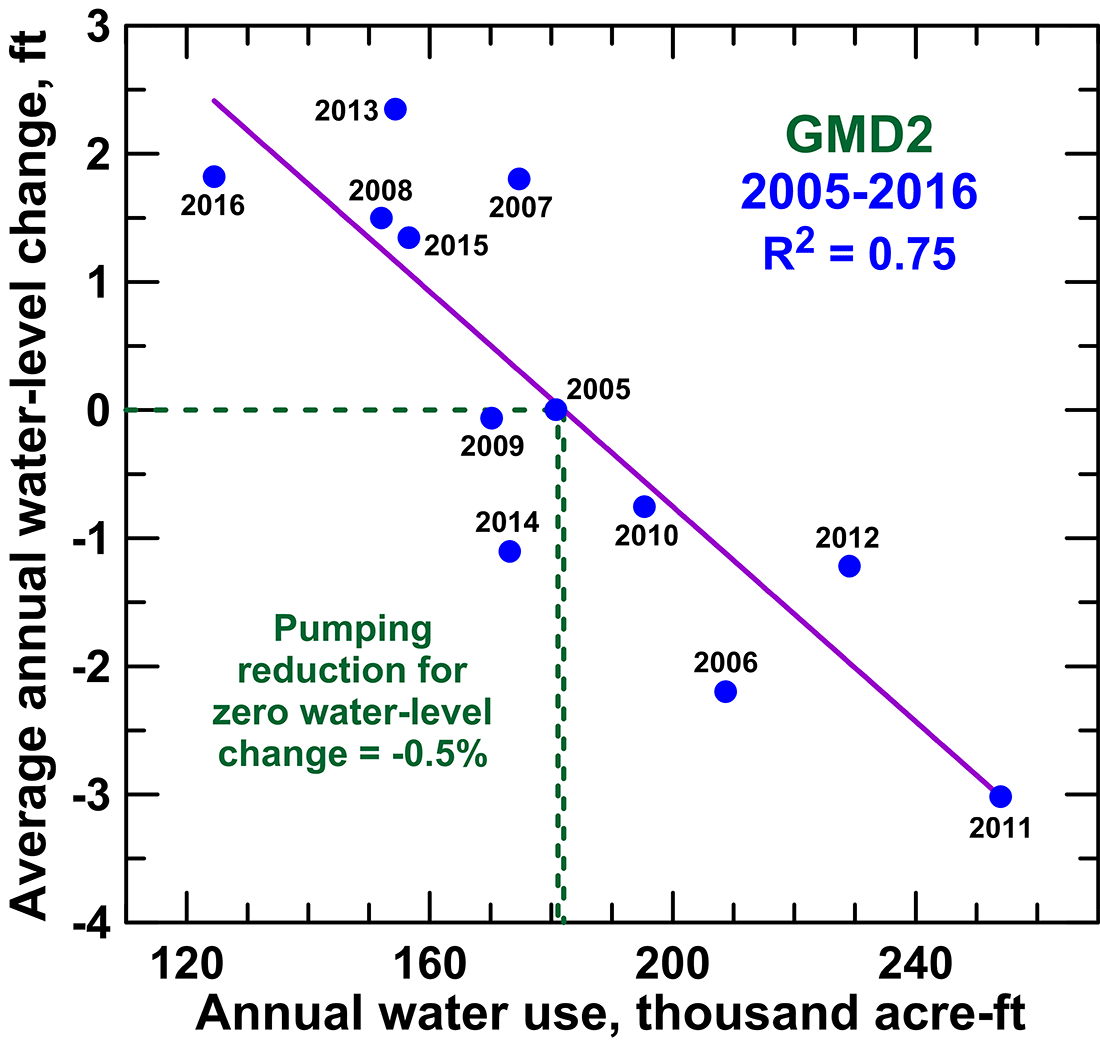
A plot of average annual water-level change versus annual water use for 2005-2016 for GMD2 (fig. 21) indicates that pumping is within 1% of that which would be sustainable (zero water-level change). Because the water-level changes vary substantially for the Quaternary region as indicated earlier, the pumping for sustainable conditions also varies depending on the particular range of years used for the water-level change versus water use plot. For 1996-2014 and 2005-2014, the pumping reductions for a zero water-level change are 1.5% and 2.9%, respectively, based on KGS-DWR cooperative network wells measured each year of these periods (Butler et al., 2017). When GMD2 monitoring well data are included in the water-level change calculations, the pumping reductions are 1.2% for 1996-2014 and 2.7% for 2005-2014 (Butler et al., 2017). If the water-level decline for 2017 and the water use predicted by radar precipitation for 2017 are used in a plot for 2005-2017 for GMD2, the pumping reduction for a zero water-level change would be 1.4%.
Figure 21—Average annual water-level change versus annual groundwater use for GMD2 for 2005-2016. Water-level data are for KGS-DWR cooperative network wells measured each winter during the period. The solid line is the best-fit straight line to the plot. The pumping reduction from the average water use for 2005-2016 to that needed to achieve a zero water-level change is shown by the vertical dashed green lines.
The pumping reduction needed to achieve short-term sustainability for GMD5 is 1.9% based on KGS-DWR cooperative network wells measured each year during 2005-2016 (fig. 22). This reduction is a couple percentage points greater than for the same period for GMD2. Pumping reductions for sustainability are generally expected to be 1-2 percentage points greater for GMD5 than for GMD2, probably reflecting the somewhat smaller annual rainfall and recharge in GMD5 than in GMD2.
Figure 22—Average annual water-level change versus annual water use for GMD5 for 2005-2016. Water-level data are for KGS-DWR cooperative network wells measured each winter during the period. The solid line is the best-fit straight line to the plot. The pumping reduction from the average water use for 2005-2016 to that needed to achieve a zero water-level change is shown by the vertical dashed green lines.
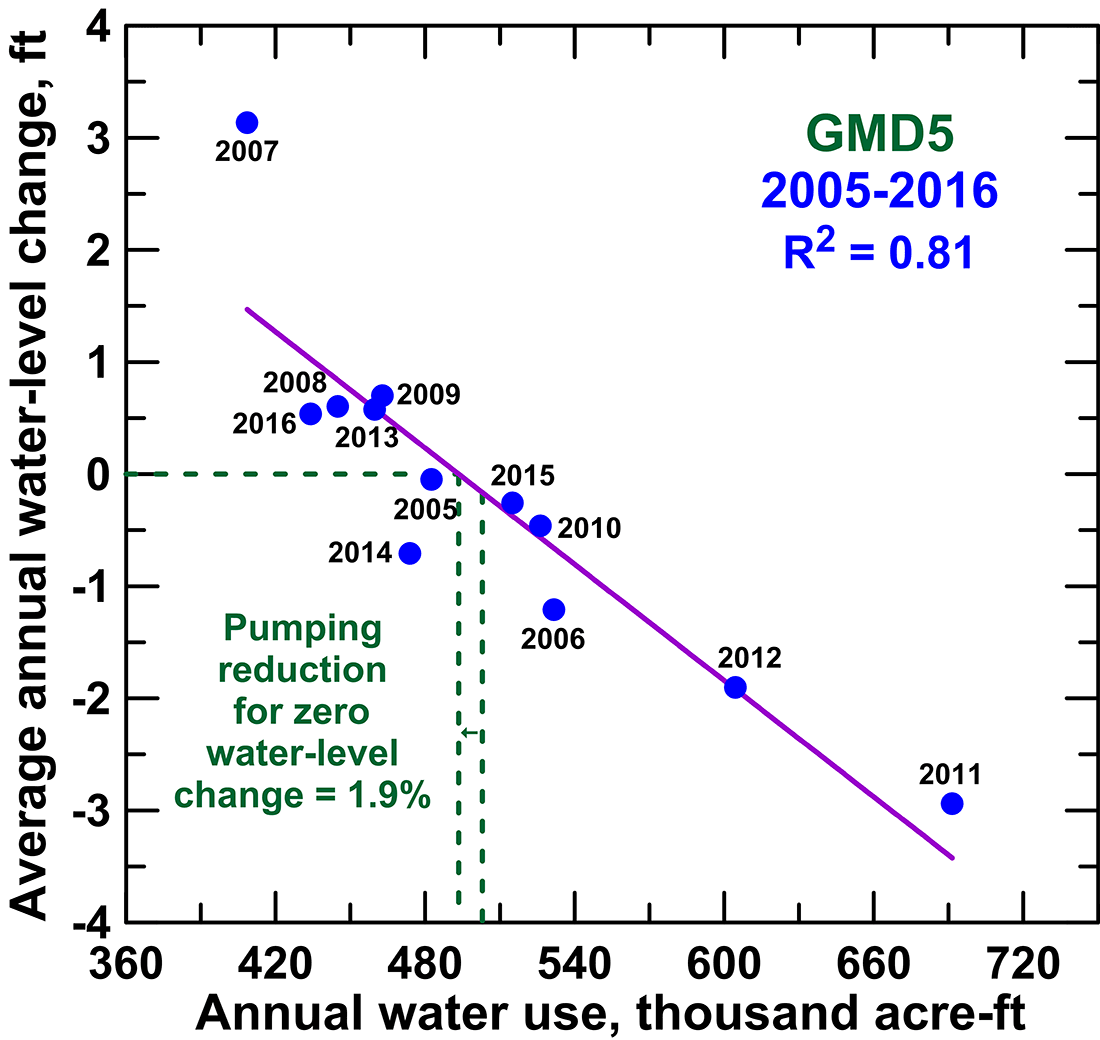
Although the pumping reductions needed for sustainable water levels averaged over a decade or more are small for GMDs 2 and 5, they are highly dependent on the occurrence of a few very wet years. For, example, the water-level rises for 2007 and 2013 in GMD2 (fig. 21) and for 2007 in GMD5 (fig. 22) are higher than would be expected given the water use for these years. If these years are excluded from the plots, the pumping reductions needed for zero water-level change increase to 5.2% for GMD2 and 6.3% for GMD5.
The sustainable pumping for GMDs 2 and 5 shown in fig. 21 and 22 are for the entire district areas. However, selected portions of the districts can require substantially higher pumping reductions for sustainability, depending on local conditions. For example, the reductions needed for the McPherson County area of GMD2 range from 6% for 1996-2014 to 9% for 2005-2014, based on a KGS sustainability study for GMD2 (Butler et al., 2017). Similarly, the pumping reductions required for zero water-level change in Edwards and Pawnee counties could be expected to be greater than the average for all of GMD5 based on the long-term water-level declines in these counties (see fig. 4).
Average annual groundwater levels have declined 0.5-0.6 ft/yr in GMDs 1 and 4 and 1.7 ft/yr in GMD3 during the last two decades.
Pumping reductions needed to achieve sustainability (zero water-level change) for the short term (one to two decades) in the Ogallala region are 33% for GMD1, 31% for GMD3, and 27% for GMD4, based on the last dozen years of water-level and water-use data.
Pumping reductions for sustainability in more intensively pumped areas are greater than the 27-33% range. For example, the reduction required for the Sheridan-6 Local Enhanced Management Area in GMD4 would be 42% based on data for the decade preceding the LEMA operation.
Water-use reductions of about 27% (adjusted for climatic conditions) for the operational period of the Sheridan-6 LEMA (2013-2016) compared to the pre-LEMA years of 2005-2012 have significantly decreased water-level declines and lengthened the life of the aquifer in that area.
Average annual groundwater levels have not changed significantly in GMD2 and have declined about 0.2 ft/yr in GMD5 during the last two decades.
Pumping is generally sustainable in GMD2 and would need to be reduced by about 2% for sustainability in GMD5 based on the last dozen years of water-level and water-use data. However, the sustainability varies across different areas of the GMDs and is highly dependent on recharge during very wet years.
Butler, J. J., Jr., Whittemore, D. O., Bohling, G. C., and Wilson, B. B., in press, Sustainability of aquifers supporting irrigated agriculture: A case study of the High Plains aquifer in Kansas: Water International.
Butler, J. J., Jr., Whittemore, D. O., and Wilson, B. B., 2017, Equus Beds Groundwater Management District No. 2 sustainability assessment: Kansas Geological Survey Open-File Report 2017-3, 104 p., 5 appendices. [available online]
Butler, J. J., Jr., Whittemore, D. O., Wilson, B. B., and Bohling, G. C., 2016, A new approach for assessing the future of aquifers supporting irrigated agriculture: Geophysical Research Letters, v. 43, p. 2,004-2,010, DOI: http://dx.doi.org/10.1002/2016GL067879.
DWR-KDA, n.d., Local Enhanced Management Areas (LEMAs), http://agriculture.ks.gov/divisions-programs/dwr/managing-kansas-water-resources/local-enhanced-management-areas. Accessed June 11, 2018.
Golden, B., 2016, Monitoring the impacts of Sheridan County 6 Local Enhanced Management Area. Interim report for 2013-2015. Kansas State University, https://www.agmanager.info/sites/default/files/pdf/Sheridan-LEMA_2013-2015.pdf.
Golden, B., 2017, Monitoring the impacts of Sheridan County 6 Local Enhanced Management Area, 2013-2016. Paper presented at the 2017 Governor's Conference on the Future of Water in Kansas, Manhattan, Kansas, https://www.kwo.ks.gov/docs/default-source/governor's-water-conference/2017-governor's-conference-presentations/golden---impacts-of-enhanced-management-area.pdf?sfvrsn=2.
Lanning-Rush, J. L., 2016, Irrigation water use in Kansas, 2013: U.S. Geological Survey Data Series 981, 12 p., http://dx.doi.org/10.3133/ds981.
McKee, T. B., Doesken, N. J., and Kleist, J., 1993, The relationship of drought frequency and duration to time scales. Preprints, 8th Conference on Applied Climatology, 17-22 January 1993, Anaheim, California, p. 179-184.
Peterson, J. M., and Ding, Y., 2005, Economic adjustments to groundwater depletion in the High Plains: Do water-saving irrigation systems save water? American Journal of Agricultural Economics, v. 87, no. 1, p. 147-159.
Whittemore, D. O., Butler, J. J., Jr., and Wilson, B. B., 2016, Assessing the major drivers of water-level declines: New insights into the future of heavily stressed aquifers: Hydrological Sciences Journal, v. 61, no. 1, p. 134-145, DOI: http://dx.doi.org/10.1080/02626667.2014.959958.
This work was supported, in part, by the Kansas Water Office, the Kansas Water Plan under the Ogallala-High Plains Aquifer Assessment Program, the National Science Foundation under award 1039247, the United States Department of Agriculture (USDA) under subaward RC104693B, and Equus Beds Groundwater Management District No. 2. John Woods at the Kansas Geological Survey (KGS) provided some of the data used in the graphs. The manuscript was sent for review by staff at the KGS, Kansas Water Office, Division of Water Resources of the Kansas Department of Agriculture, and the five groundwater management districts of Kansas, as well as to a faculty member of Kansas State University. The authors appreciate the comments and edits received from several of these individuals. Julie Tollefson of the KGS edited and produced the final publication.
Additional information and maps for a wide range of factors related to the High Plains aquifer in Kansas can be obtained from the Kansas High Plains Atlas available on the KGS website at http://www.kgs.ku.edu/HighPlains/HPA_Atlas/index.html. Water-level data can be found on the KGS website at http://www.kgs.ku.edu/Magellan/WaterLevels/index.html, and water-use data are available at http://hercules.kgs.ku.edu/geohydro/wimas/index.cfm, a site developed by the KGS and KDA-DWR.
Kansas Geological Survey
Placed on web Aug. 3, 2018; revised Sept. 6, 2018.
Comments to webadmin@kgs.ku.edu
The URL for this page is http://www.kgs.ku.edu/Publications/Bulletins/TS22/index.html