Kansas Geological Survey, Technical Series 2
Next--Water Resources
Originally published in 1998 as Kansas Geological Survey Technical Series 2. This is, in general, the original text as published. The information has not been updated. An Acrobat PDF version (25 MB) is also available.
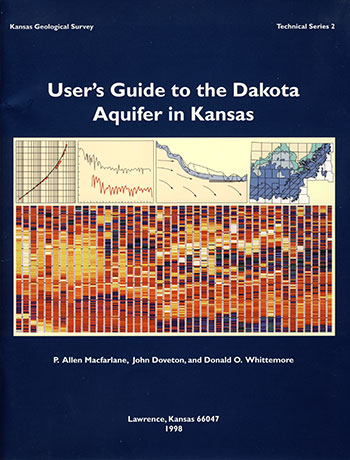
Cover--The graphics displayed represent various aspects of Dakota hydrogeology and its complexity. The long strip is part of a vertical cross section through the Dakota aquifer framework constructed from gamma-ray logs that have been transformed to allow a more visual impression of the subsurface. Thus, the less radioactive rock units, the sandstones and limestones, are represented by the yellow and orange strips, and the darker shades represent the more radioactive shales and siltstones. Upon closer examinaton of this cross section, the viewer is struck by the extreme variability of the Dakota aquifer framework. The two panels above the cross section on the left show some of the tools traditionally used to analyze the Dakota aquifer hydrology, namely pumping-test results and well hydrographs. The third panel from the left is a vertical cross section from southeastern Colorado to central Kansas showing the interaction between local and regional flow systems conceptually. The panel on the far right shows the variation in total dissolved solids concentration in ground waters from the Dakota aquifer.
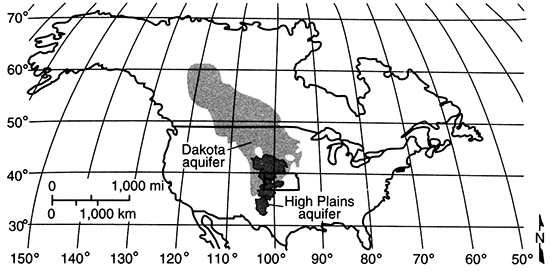
The Dakota aquifer system and its equivalents extend across much of the central North American continent (fig. 1). The contiguous aquifer system extends northward from Kansas approximately to the Arctic Circle in Canada, southward into northeastern New Mexico and the Oklahoma panhandle, westward to the Rocky Mountain front, and eastward to western Iowa and Minnesota. Across the Continental Divide, the Dakota aquifer is present in many of the intermontane basins. Thus, the Dakota is an important source of water in many areas of the North American continent.
Figure 1--Limit of Dakota aquifer in North America.
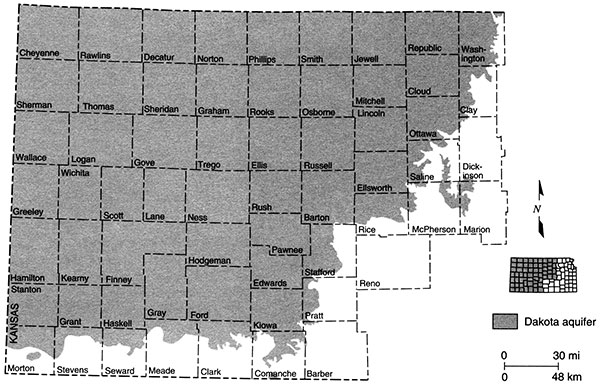
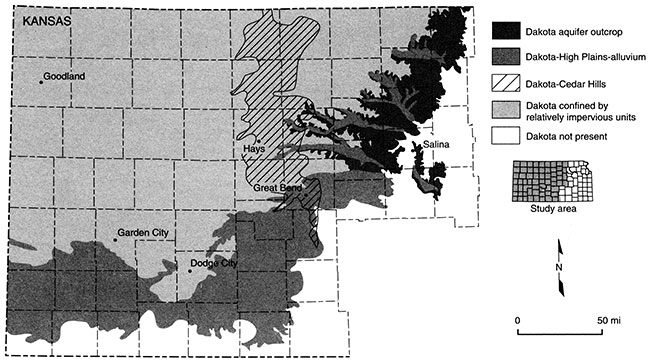
In Kansas, the Dakota is present in most of the western two-thirds of the state (fig. 2). The aquifer extends westward from Washington County along the Kansas-Nebraska border and northward from Morton County along the Kansas-Colorado border, and is present in 59 of the 105 Kansas counties.
Figure 2--Extent of Dakota aquifer in Kansas.
Even though the Dakota has been used as a source of water for more than a century in Kansas, its hydrologic character has been poorly understood and the issues surrounding its use have been inadequately addressed. A decade ago, State and local agencies recognized the localized depletion of the High Plains (Ogallala) aquifer and stream-aquifer systems in western and central Kansas and the need to identify other sources that might replenish available supplies. Little was known about either the quantity or the quality of ground water or the impact of regional or local development on the Dakota that could be used to guide regional or local planning until recently. This focused the attention of the water agencies on the Dakota, a deeper and more complex sandstone aquifer system. Concerns related to human activity also were expressed, such as the potential hazards of disposing oil-brine in shallow zones beneath the Dakota in central Kansas and the protection of usable ground-water resources in the Dakota. Kansas has had oil-well surface casing and cementing standards for protecting shallow fresh ground water since the 1960's.
In response, the Kansas Geological Survey began an eight-year investigation into the hydrogeology and water quality of the Dakota in 1988. Goals of the program were to assess the water-resources potential of the Dakota aquifer and to assist the agencies in the development of appropriate management plans and policies. This program was unique because it was designed for proactive rather than reactive water-resources management of a regional aquifer system. The broad objectives of the program were to (1) characterize the geologic framework of the Dakota aquifer; (2) define the ground-water-flow system within the aquifer to identify sources of recharge, discharge, flow path, and areas of interaction with other aquifer systems; (3) assess the water quality of the Dakota aquifer; and (4) assess the impact of current and future development in the Dakota and interacting aquifer systems, including the impact of oil-field-brine disposal in the underlying Permian on the Dakota aquifer in the areas of aquifer interaction.
Historically, the Dakota aquifer has generally been poorly understood in Kansas. Because of its complexity and limited use, our poorly documented experience with this source of water contains some truths but many misconceptions about the Dakota that have continued to the present. The purpose of this book is to educate Kansans about the Dakota aquifer as we know it today. It is written primarily for a nontechnical to semi-technical audience and is designed to provide the reader with a basic understanding of the Dakota aquifer and the issues surrounding its use as a water resource. Where the discussion becomes more technical, every effort has been made to explain the concepts in less technical language. Also, a Glossary of the terms used in this report is contained in Appendix 1. During the initial stages of this project, it became obvious to us that the complexity of the Dakota warranted this type of publication to help guide those interested in the water resources of this aquifer system.
The user's guide contains two major sections. Part 1 describes the hydrogeology and water quality of the Dakota, and Part 2 is a discussion of its water resources. Because much of the information in Part 1 forms the background for the ensuing discussion in Part 2, readers are urged to read the sections in order of their presentation. The reader will also find a listing of agencies that will have information on the Dakota aquifer (Appendix 2) and the publications from the Dakota Aquifer Program (Appendix 3). Additional technical information on the Dakota aquifer can be found on the Kansas Geological Survey home page. The World Wide Web address is http://www.kgs.ku.edu/. A bulletin on the Dakota also is planned and should provide considerable additional information to those seeking technical guidance. Some of the more general publications of the Dakota Aquifer Program are listed on the inside front cover of this publication.
All natural geologic materials are capable of transmitting and storing water to varying degrees. In a practical sense, aquifers are permeable and yield amounts of water to wells at rates that are suitable for human uses. On the other hand, an aquitard or a confining unit is sufficiently permeable to allow the slow transmission of significant amounts of water, but will not yield appreciable amounts to wells. Aquifers and aquitards are hydro stratigraphic units; they consist of a portion of a formation, a formation, or a group of formations. Aquifer and aquitard units are distinguished and characterized by their porosity and permeability or hydraulic conductivity. Thus, the distinction between these units is a relative one that depends on the contrast of properties between adjacent geologic units or rock types. In the case of the Dakota, a hydraulically connected network of sandstones forms the regional aquifer system, and the shaly geologic units form the regional aquitards.
The methodology used to define regional hydrostratigraphic units is discussed in detail in the papers and reports listed in Appendix 3. Table 1 shows the classification of regional aquifer units and its relation to the stratigraphic classification. Five aquifer and three aquitard units constitute the regional hydrostratigraphic framework of the upper 2,000 ft (600 m) of the western and central Kansas subsurface. All the regional aquitards consist largely of shale and are much less permeable than the regional aquifers by many orders of magnitude. As a result, the regional aquitards pose significant barriers to the vertical flow of ground water. In places, these regional aquitards have been eroded and two or more of the regional aquifers are in physical contact. Where these aquifers are in contact, they are considered to be hydraulically connected because there is no barrier to the flow of ground water between them.
Table 1--Stratigraphy and hydrostratigraphy of the shallow subsurface in southeastern Colorado and Kansas.
| Era | System | Rock Stratigraphic Units | Hydrostratigraphic Units | |||
|---|---|---|---|---|---|---|
| SE Colorado | Kansas | |||||
| Cenozoic | Quaternary | unconsolidated sediments | unconsolidated sediments | alluvial valley and High Plains aquifers | ||
| Tertiary | Ogallala Formation | Ogallala Formation | ||||
| Mesozoic | Cretaceous | Colorado Gp. | Pierre Shale Niobrara Chalk Carlile Shale Greenhorn Limestone Graneros Shale |
Colorado Gp. | Pierre Shale Niobrara Chalk Carlile Shale Greenhorn Limestone Graneros Shale |
upper Cretaceous aquitard |
| Dakota Sandstone | Dakota Formation | upper Dakota aquifer | ||||
| Purgatoire Fm. | Kiowa Shale Member Cheyenne Sandstone Member |
Kiowa Fm. | unnamed shale unit | Kiowa shale aquitard | ||
| Longford Member | lower Dakota aquifer | |||||
| Cheyenne Sandstone | ||||||
| Jurassic/Triassic | Morrison Formation Dockum Group |
Morrison Formation Dockum Group |
Morrison-Dockum aquifer1 | |||
| Paleozoic | Permian/Pennsylvanian | Permian undiffer. | Permian undiffer. | Permian-Pennsylvanian aquitard | ||
| Lyons Sandstone | Cedar Hills Sandstone | Cedar Hills Sandstone aquifer | ||||
| Permian/Pennsylvanian undifferentiated | Permian/Pennsylvanian undifferentiated | Permian-Pennsylvanian aquitard | ||||
| 1. The Morrison-Dockum is considered an aquifer only in southeastern Colorado and adjacent southwestern Kansas. Elsewhere it is a part of the Permian-Pennsylvanian aquitard. | ||||||
The Dakota aquifer system is the most geographically extensive of all the aquifer systems in the upper 2,000 ft (600 m) of the subsurface of western and central Kansas. The geologic units that form the Dakota aquifer in Kansas are the Dakota Formation, the Kiowa Formation, and the Cheyenne Sandstone (table 1). These geologic units were deposited during the Cretaceous Period in alluvial valleys and in the coastal plain adjacent to the developing Western Interior seaway. Table 1 also shows the equivalent stratigraphic units in eastern Colorado. The combined thickness of these units can range up to more than 700 ft (210 m) in west-central parts of Kansas.
The Cheyenne Sandstone consists predominantly of crossbedded, fine- to medium-grained sandstone with lenses of shale and conglomerate (table 1). It was deposited in alluvial to deltaic environments and rests on an erosional surface that developed on underlying Permian and Jurassic rocks. Where it is present, the Cheyenne is variable in thickness, ranging up to 260 ft (78 m), but is typically less than 100 ft (30 m) thick, and tends to thicken into paleovalleys.
The Kiowa Formation overlies the Cheyenne Sandstone, and across much of Kansas it is primarily a marine shale that is typically 100-150 ft (30-45 m) thick (table 1). The Kiowa also contains interbedded sandstone, siltstone, and shale deposited in nearshore and shoreline and alluvial valley environments. These deposits belong to the Longford Member of the Kiowa Formation. In the subsurface, the transition from Cheyenne to Kiowa is commonly gradational with an upward increase in the proportion of shale, a decrease in sandstone-bed thickness, and an increase in bed continuity. The thickest Kiowa sandstones, as observed in core samples and on gamma-ray logs, occur near the base of the Kiowa in the Longford Member and are typically 30 ft (9 m) thick. The sandstone in these thick bodies is typically fine to medium grained and well sorted. Where the Cheyenne is absent, the Kiowa lies directly on Permian and Jurassic rocks.
The Dakota Formation lies between the Kiowa Formation below and Graneros Shale above (table 1). The Dakota is generally 200-300 ft (60-90 m) thick in Kansas and consists of fluvial and shoreline to nearshore sandstone bodies encased in a matrix of alluvial plain to shallow marine finer-grained mudstone. Across most of Kansas the Dakota was deposited on an erosional surface developed on the Kiowa Formation. However, in parts of Washington County, the underlying Kiowa Formation has been completely removed and the Dakota rests directly on eroded Permian rocks. Thick, crossbedded alluvial sandstone bodies up to 120 ft (36 m) thick may be present near the base of the formation. In outcrops, these thick, alluvial sandstone bodies form the bluffs and canyons along the north shore of Kanopolis Reservoir in Ellsworth County. Outcrops of sandstones can also be seen in roadcuts and on hilltops and in the sides of stream valleys in many other places in central Kansas. In cores and outcrops the sandstones are fine to medium grained, well sorted, and contain large-scale and small-scale crossbeds. These sandstone bodies are interpreted as river-channel deposits that generally trend west to southwest. Basal Dakota Formation sandstone bodies thicken appreciably into the paleovalleys cut into underlying rocks. In the lower half of the formation, sandstone beds are abruptly capped by fine-grained deposits or have a fining-upward succession. The Rocktown channel sandstone in the upper part of the Dakota Formation is a long-recognized outcrop expression of a channel sandstone in Russell County, Kansas. This channel contains crossbedded, fine to coarse, fluvial sandstone in a discontinuous, narrow (1-2 mi [1.6-3.2 km] wide or less), sinuous belt that has been traced along a straight-line distance of 27 mi (43 km). Sandstones near the top of the Dakota were deposited adjacent to the shoreline that was advancing from the west. These sandstones are thinner but more extensive than the alluvial sandstones and are elongated in a north-south direction, parallel to the orientation of the ancient Western Interior sea shoreline.
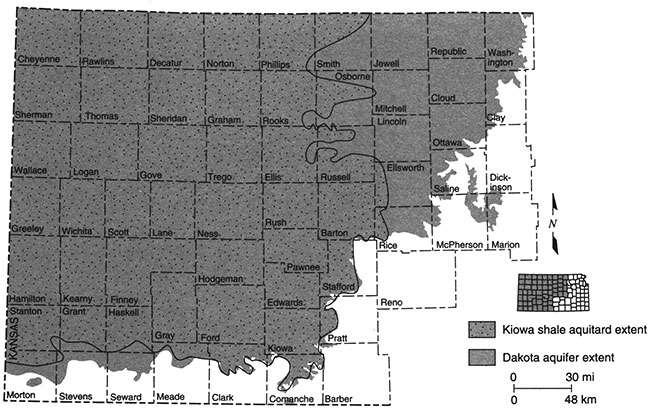
Regionally, the Dakota aquifer system consists of upper and lower units (table 1). The upper aquifer unit consists entirely of the Dakota Formation and the shoreline deposits at the top of the Kiowa Formation and is approximately 300 ft (90 m) thick. The lower aquifer unit consists of the Longford Member of the Kiowa Formation and the Cheyenne Sandstone and varies considerably in thickness up to 200 ft (60 m). These upper and lower regional aquifers are separated in western and parts of central Kansas by a thick, marine shale in the Kiowa Formation, which is referred to as the Kiowa shale aquitard (table 1). The thickness of the aquitard ranges up to more than 300 ft (90 m) in parts of west-central and southwestern Kansas.
The Kiowa shale aquitard is not present in much of central Kansas where it has been removed by erosion or was not deposited. In these areas the upper and lower Dakota aquifers are considered to be in hydraulic connection, and the Dakota aquifer system is not differentiated into upper and lower units. Figure 3 shows the extent of the Kiowa shale aquitard in Kansas.
Figure 3--Extent of Kiowa shale aquitard in Kansas.
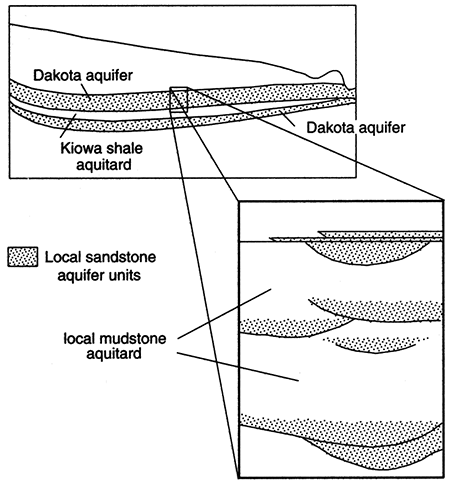
The sandstone aquifers contained in these Cretaceous units occur as irregular, discontinuous bodies within the mudstone and generally occur in several, more or less distinct zones (fig. 4). The fluvial and distributary sandstone bodies are ribbon-shaped and follow the ancient drainage pattern that existed during this part of the Cretaceous. Continuity and thickness are greatest along the paleoflow directions, which vary locally, but trend generally to the west across the state. Upper Dakota Formation sandstone bodies deposited in deltas, estuaries, and beaches are generally tabular and trend parallel to the north-south paleoshoreline. Hydraulic connection between these sandstone bodies in this part of the section depends on the shifts in paleoenvironments that resulted from rising sea level along the eastern edge of the Western Interior sea and the proximity of these shallow sandstone bodies to underlying fluvial/distributary channel sandstones.
Figure 4--Regional and local aquifer/aquitard units of Dakota aquifer system in Kansas.
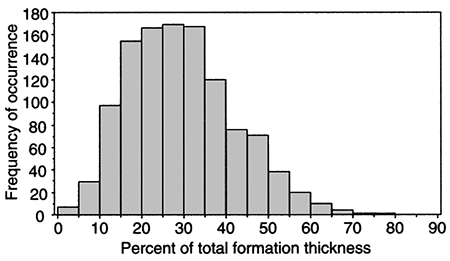
The proportion of sandstone to the total thickness of the stratigraphic units that constitute the Dakota aquifer is approximately 30% statewide. However, locally this proportion can vary widely from less than 5% to more than 50% over short distances. For example, 1,131 gamma-ray logs of oil wells were examined to determine the variation in the proportion of sandstone to total thickness of the Dakota Formation sampled by these boreholes in a 12- township area (432 mi2 [1,123 km2]) of western Ellis County. Figure 5 is a histogram showing the frequency of occurrence of sandstone in the Dakota Formation from the logs. The histogram shows that the amount of sandstone penetrated in the formation by boreholes drilled for oil and gas ranges widely from 3% to 78%. The average amount of sandstone penetrated was 29%. The average thickness of the Dakota Formation within the study area is 282 ft (85 m). This means the average total footage of sandstone encountered is approximately 82 ft (27 m). However, assuming an average formation thickness, slightly more than two-thirds of the 1,131 wells encountered between 16% and 42% sandstone or total thicknesses from 45 ft to 118 ft (15-39 m), respectively.
Figure 5--Sandstone proportion to total Dakota Formation thickness encountered by 1,131 oil and gas wells in southwestern Ellis County, Kansas.
The high variability of the Dakota aquifer framework underscores the need to define hydrostratigraphic units within the aquifer at both the local and regional scales (fig. 4). The aquifer/aquitard units defined at the regional scale would not be appropriate at the scale of the well field or well site, where the required level of detail is much higher. At the local scale, pumping causes transient-flow conditions in the vicinity of the well field or pumping well, and these propagate through the aquifer for some distance, mainly through the more permeable sandstones. Thus the local hydrostratigraphy consists of sandstone aquifers confined within mudstone aquitards within the Dakota and Kiowa formations and the Cheyenne Sandstone. The geometry of the sandstone bodies and their hydraulic properties become relatively important influences on ground-water flow that need to be evaluated at the local scale to resolve issues such as the effects of pumping or the transport of contaminants through the flow system.
In most hydrogeologic investigations, the permeable nature of a natural porous medium to the flow of water is indicated by its hydraulic conductivity, expressed in length per unit time (L/T) units. This parameter is a function of both the grain-size distribution of the porous medium and the viscosity and density of the invading fluid. In relatively freshwater, the variations of fluid properties are negligible. Thus hydraulic conductivity is a measure of the resistance to flow through the porous medium. Sandstone hydraulic conductivities are derived from the results of field tests involving either single or multiple wells and laboratory measurements of small samples from the outcrop or coring. Because of the variability of natural porous media, the hydraulic conductivity is a log-normally distributed parameter in most instances. The "average" value for the log-normal distribution is the geometric mean of the distribution.
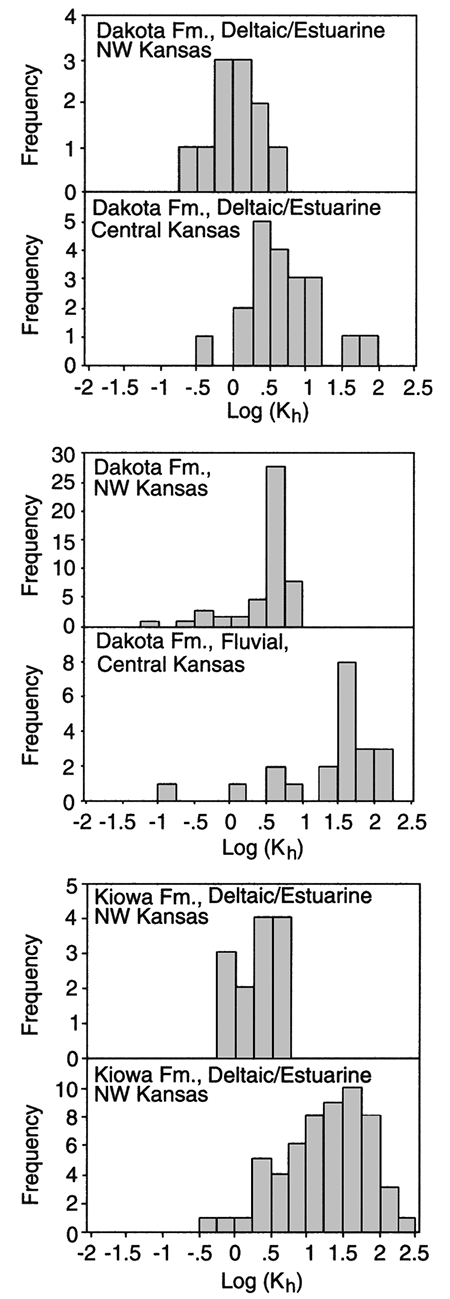
Twenty-two reliable values of hydraulic conductivity from field hydraulic tests of wells in the upper Dakota aquifer of Kansas were found in the literature or were derived from field tests conducted for the Dakota Aquifer Program. Most of the values come from pumping tests where the Dakota aquifer is shallow in central and southwestern Kansas. The hydraulic conductivity data from the field hydraulic testing range from 3.6 to 88 ft (1.2-29.3 m)/day with a geometric mean value of 12.5 ft (4.2 m)/day (fig. 6A). The highest hydraulic conductivities are generally found in the outcrop or near the outcrop areas of the Dakota aquifer in central Kansas and the lowest values in southwestern Kansas. In fig. 7 similar trends can be observed in the results from lab tests on core samples of the sandstones from the Dakota aquifer in central and northwest Kansas. Core samples of sandstone from central Kansas appear to be more permeable than core samples of sandstone from northwest Kansas. The test results suggest that hydraulic conductivity is generally highest in the better-sorted and coarser sandstones. These sandstones are most common in the lower sections of thick, multi-story fluvial- and distributary-channel sandstone bodies found in central Kansas.
Figure 6--Distribution of hydraulic conductivity (A) and specific storage (B) values from 22 pumping tests of Dakota aquifer in Kansas.
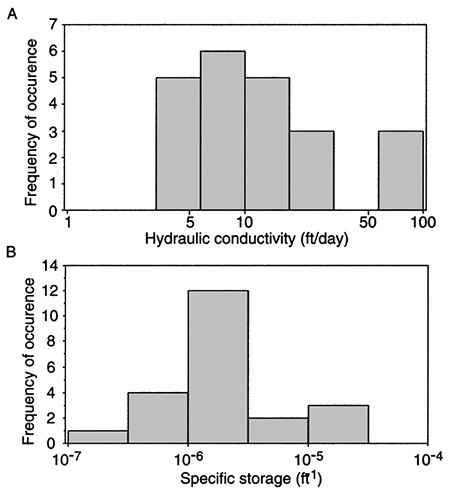
Figure 7--Histograms of horizontal hydraulic conductivity of fluvial and shoreface sandstones from Dakota and Kiowa formations in KGS #1 Jones (central Kansas) and #1 Beaumeister (northwestern Kansas).
The transmissivity of a confined (or an unconfined) aquifer is the product of the hydraulic conductivity of the aquifer and its thickness:
T = Kb (eqn. 1)
where T is the transmissivity (L2/T), K is the hydraulic conductivity (L/T), and b is the aquifer thickness. The letters L and T refer to length and time, respectively. The hydraulic conductivity is a measure of the overall resistance of the aquifer framework to the flow of water per unit width. Hence, transmissivity is a measure of the ability of the aquifer to transmit water through its entire thickness.
For the upper Dakota aquifer, transmissivities vary widely and generally increase from west to east because of the eastward increase in hydraulic conductivities and net thickness of sandstone. The occurrence of thicker and more permeable units in central Kansas may result from the dominance of alluvially deposited sandstones in the upper Dakota. In southwestern Kansas, the reported transmissivities are less than 2,100 ft2/day (189 m2/day). In central Kansas, transmissivities of the thicker river-deposited sandstones range from 2,000 to more than 7,000 ft2/day (630 m2/day). In comparison, the transmissivities reported for pumping tests in High Plains and alluvial valley aquifers are generally higher, reflecting the more permeable nature of the aquifer. Reported values range from 1,400 to 62,000 ft2/day (126-5,580 m2/day) for the High Plains aquifer.
Direct field or laboratory tests on the mudstone matrix were not conducted in the Dakota Aquifer Program. However, a vertical hydraulic conductivity of 0.0022 ± 0.0006 ft (0.066 ± 0.018 cm)/day was calculated from a pumping test in Washington County. The analysis of other pumping test results from the confined Dakota near the outcrop in central Kansas reveals that the vertical hydraulic conductivity of the mudstone is considerably less than 0.001 ft (0.03 cm)/day, perhaps by several orders of magnitude.
The release of water from storage in confined aquifers is analogous to the process of consolidation in soil mechanics. Water is released from storage by (1) the expansion of water under confinement due to the decrease in fluid pressure to atmospheric pressure, and (2) the consolidation of the confined aquifer framework due to the release of water. These two phenomena are expressed jointly in the specific storage term:
Ss = ρg (α + nβ) (eqn.2)
where ρ is the water density mass (M) per unit volume (M/L3), g is the acceleration of gravity (L/), and α and β are the compressibilities of the aquifer framework and the water, respectively (LT2/M). In eqn. 3, the compaction of the framework is reflected in α and that of the water is reflected in the nβ term. In most cases the consolidation of the aquifer framework is the most important influence on the specific storage. The storativity is the product of the specific storage and the thickness of the sandstone aquifer.
Twenty-two reliable values of specific storage from field hydraulic tests of wells in the Dakota aquifer of Kansas were found in the literature or were derived from field tests conducted for the Dakota Aquifer Program. Most of the values come from pumping tests where the Dakota aquifer is shallow in central and southwestern Kansas. Values of specific storage range from 1.5 x 10⁻⁷ ft-1 up to 2.9 X 10⁻⁵ ft-1, which is within the expected range of values for confined sandstone aquifers. In fig. 6B, the data appear to be log-normally distributed with a geometric mean of 2.1 x 10⁻⁶ ft-1.
Both the transmissivity and the storativity determine the effect of well pumping on aquifers as will be discussed in a later section. In general, the higher the transmissivity and storativity of the aquifer the greater the yield to a pumping well. Well yields typically range from less than 25 up to 750 gal/min (95-2,850 L/min).
Over its extent in Kansas, the Dakota Formation is overlain by younger Upper Cretaceous bedrock units and Cenozoic unconsolidated deposits (table 1; fig. 8). The Upper Cretaceous sequence consists of shale, chalk, and limestone belonging to the Graneros Shale, the Greenhorn Limestone, the Carlile Shale, the Niobrara Chalk, and the Pierre Shale. In Kansas, the total thickness of this sequence generally increases to the west and north up to more than 2,000 ft (600 m) in the northwest corner of the state. These stratigraphic units form the Upper Cretaceous aquitard. The Dakota is considered a confined aquifer system where it is overlain by the Upper Cretaceous aquitard (fig. 8). In most of southwest and most of south-central Kansas and much of southeastern Colorado, the Upper Cretaceous aquitard has been eroded and the Dakota is overlain by and hydraulically connected to the High Plains aquifer (fig. 8). In the river valleys of the central part of the state, the Dakota aquifer is in hydraulic connection with the overlying saturated alluvial deposits which form the alluvial-valley aquifers (fig. 8).
Figure 8--Extent of Dakota aquifer in Kansas showing regions of hydraulic connection to other aquifers, where Dakota is a near-surface aquifer, and where it is confined by relatively impervious units.
Westward-dipping Jurassic and Permian rocks directly underlie the Dakota aquifer in Kansas. The subcrop of the Jurassic Morrison Formation beneath the Cretaceous is generally in the western part of the state, whereas the Permian subcrop is in the central part. In southwestern Kansas and southeastern Colorado, the Morrison and Dockum Groups form the Morrison-Dockum aquifer. The Morrison in southwestern Kansas consists mostly of sandstone and is a source of freshwater along with the Cheyenne Sandstone. Upper and lower Permian rocks consist of shale, siltstone, sandstone, and bedded salt with minor amounts of limestone and dolomite. Outside of southwestern Kansas, the Morrison, and the Permian and Pennsylvanian sequences form a thick regional aquitard. However, sandwiched within this aquitard is the Cedar Hills Sandstone aquifer which subcrops beneath the lower Dakota aquifer in central Kansas (table 1; fig. 8). The Cedar Hills Sandstone aquifer consists of the Permian Cedar Hills Sandstone and the sandstones and shaly sandstones at the top of the underlying Salt Plain Formation.
Without exception, ground water is constantly moving from points of recharge where it enters the subsurface hydrologic system to points of discharge where it exits back to the surface. The flowpaths taken by ground water are determined by the arrangement of aquifer and aquitard units and the land-surface topography. Some of the water only travels a short distance through the shallow subsurface from local recharge to local discharge areas. However, some water travels a much longer distance from regional recharge to discharge areas through the deeper subsurface. All the subsurface flowpaths from recharge to discharge areas taken together define a flow system that includes lateral flows within all the aquifer units and across all the aquitard units.
To define the pattern of moving ground water in a flow system, hydrogeologists use measurements of waterlevel elevation taken in wells distributed throughout all the regional aquifer in a ground-water basin. In most cases, the water-level elevation equals the hydraulic head in a well. The hydraulic head at any point in the flow system is a measure of the potential energy per unit weight of ground water at that point. The movement of ground water involves a loss of energy and is similar to the flow of water in river systems. Water naturally flows downhill from elevated regions of the continent (higher hydraulic head) to the sea (lower hydraulic head). In much the same way, but more slowly, ground water moves from points of higher hydraulic head to points of lower hydraulic head in a flow system. Most of the hydraulic-head data used to define the flow system come from the aquifer units. In wells tapping a confined aquifer, the water level is above the aquifer top whereas in an unconfined aquifer, the water-level (water-table) datum is the aquifer top. Hydraulic-head data are typically unavailable for the aquitard units. As a result, ground-water flow across the aquitards must be inferred from hydraulic-head measurements in the adjacent aquifer units.
In the central Great Plains, the ground-water flow system in the Dakota aquifer is influenced primarily by regional and local topography and the Upper Cretaceous aquitard. Hydrogeologists have long observed that the water table or the top of the saturated zone mimics the topography of the land surface. The land surface in the region slopes generally to the east and decreases in elevation from 5,000 ft (1,500 m) or more in eastern Colorado to 1,400 ft (420 m) or less in central Kansas (fig. 9). This decrease in elevation results in an easterly flow of ground water across the region in all the aquifer systems.
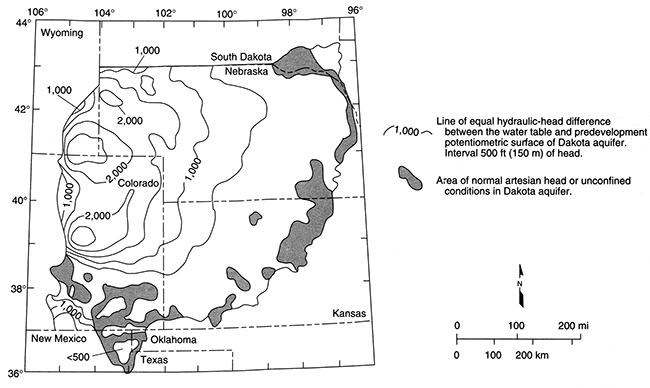
Due to its great thickness and extremely low permeability in the Denver basin of eastern Colorado, the Upper Cretaceous aquitard hydrologically isolates the flow system in the Dakota from the overlying water table. The aquitard is as much as 10,000 ft (3,000 m) thick in the deepest part of the basin adjacent to the Front Range of the Rocky Mountains. Here, the hydraulic heads in the Dakota aquifer are more than 2,500 ft (750 m) lower than the elevation of the overlying water table (fig. 10). An aquifer is usually considered in good hydraulic communication with the overlying water table if there are only small head differences between them. The regional flow models have shown that the aquitard restricts the downward movement of recharge to the Dakota to near negligible levels.
However, away from the basin center in Kansas and southeastern Colorado, the Upper Cretaceous aquitard thins toward its extent in central and southwestern Kansas. As a result, its control on the flow system in the Dakota aquifer diminishes toward the outcrop/subcrop belt. Within the last 10 million years, differential uplift and intense local dissection of the High Plains surface have created considerable local and regional topographic relief. Incisement is a common feature of the drainage in the Arkansas River basin in southeastern Colorado and southern Kansas and in the Smoky Hill, Saline, and Solomon River systems in north-central Kansas. Many of these river systems have cut down through the aquitard and into the geologic units that constitute the Dakota aquifer system. Consequently, the head difference between the Dakota and the overlying water table is less than 1,000 ft (300 m) in most of western and central Kansas and southeastern Colorado where the confined aquifer is relatively shallow (figs. 9 and 10). Here, local topographic relief is an important influence on groundwater flow in the Dakota aquifer so that changes in water-table elevations across the area parallel the land-surface elevations (fig. 9).
Figure 9--Water-level elevation versus land-surface elevation in the confined Dakota aquifer, southeastern Colorado and western and central Kansas. The slope of the best-fit line from regression is 0.993, which is significant (p = 0.001). The larger negative deviations of data from the fitted line indicate the greater influence of the Upper Cretaceous aquitard on the flow system between 3,000-ft (9000-m) and 3,700-ft (1,110-m) land-surface elevation.
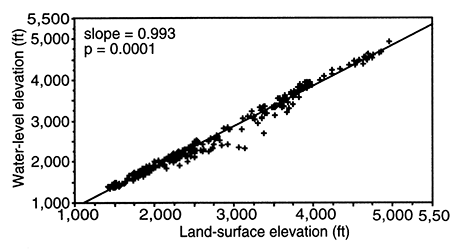
Figure 10--Hydraulic-head difference between Dakota aquifer and overlying water table in the Denver basin and adjacent areas to the east. Modified from Helgesen et al. (1993).
Geologic processes also have played an active role in changing the boundary conditions of the flow field and the hydraulic properties and composition of the hydrostratigraphic framework. Periods of deposition, erosion, and tectonic activity associated with the Laramide Orogeny at the close of the Cretaceous Period and cycles of erosion and deposition that occurred in the Quaternary have undoubtedly induced significant changes in the flow system over time. Climatic change associated with the last glacial period may have increased or decreased recharge to the regional aquifers. These geologic processes and variations in recharge would have changed the elevation and configuration of the regional water table and pore pressures in low-permeability porous media. As a result, it is possible that an overprint of a more recent flow system on an older one is causing the regional system to adjust to a new steady-state condition. However, it is believed that if the flow system is still adjusting to a new equilibrium configuration, the changes in hydraulic head caused by the adjustments are relatively minor in comparison to the large hydraulic-head differences in the aquifer systems between eastern Colorado and central Kansas.
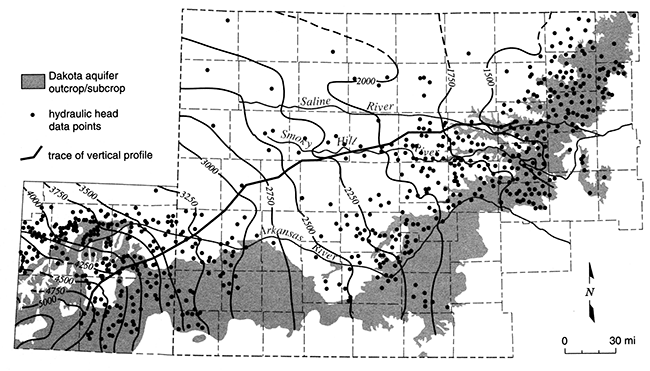
Figure 11 is a potentiometric surface map of the upper Dakota aquifer in Kansas and extreme southeastern Colorado as it might have appeared in the early 1900's. The water-level data used to produce the map come from records of the earliest wells drilled in the region. Because the aquifer is shallower nearer the outcrop/subcrop region, the data are more numerous in this region than in areas to the north where the Dakota is much deeper and waterresources development of the aquifer has been minimal. As a result the map accuracy is much better in southwestern and central Kansas than it is in northwest Kansas where there are only a few scattered measurements. Another factor limiting map accuracy is that the data used to assemble the map are not all from the same time period. Many of the water-level measurements were made in wells that were installed in the 1940's through the 1960's. This is because development of water resources in the Dakota began at different times in different places. To limit the amount of introduced error, only the earliest measurements taken in anyone area were used to generate the equipotentials on the potentiometric surface map. An insufficient number of measurements are available to define the regional potentiometric surface of the lower Dakota aquifer. The potentiometric surface of the lower Dakota is assumed to be similar to but not the same as the potentiometric surface of the upper Dakota at the regional scale.
Figure 11--Elevation in feet above mean sea level of the predevelopment potentiometric surface of the Dakota aquifer in southeastern Colorado and western Kansas. The shaded area shows the area of outcrop, primarily in central Kansas, and subcrop beneath Pleistocene and Tertiary deposits in southwestern Kansas and southeastern Colorado. Hydraulic-head data are from the U.S. Geological Survey's Central Midwest Regional Analysis Program.
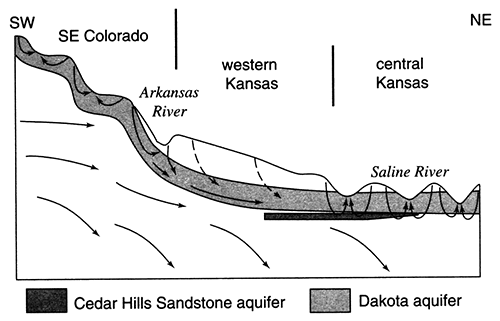
The potentiometric-surface map in fig. 11 shows that the hydraulic head in the upper Dakota is higher to the south of the Arkansas River in southeastern Colorado than elsewhere to the north and east. On the map the equipotentials are arranged concentrically around a hydraulic-head maximum in this area and decrease rapidly to the north and east of this region. This indicates northeastward flow away from an area of recharge in the upper Dakota. The total recharge from precipitation depends on the downward movement of water below the root zone to the water table or seepage into exposed bedrock outcrops. Within this recharge area in southeastern Colorado, a part of the upper Dakota underlies and is hydraulically connected to the High Plains aquifer. The total amount of seepage downward into the Dakota from the High Plains depends on the hydraulic connection between the two aquifers and the hydraulic-head gradient. As the conceptual model in fig. 12 shows, most of the recharge to the upper Dakota is intercepted by local shallow flow systems that discharge back to the surface drainage within the recharge area. Consequently, the age of ground water in this part of the system is generally less than 10,000 years.
Within the confined aquifer, the ground water moves slowly northeastward toward the regional discharge area in central Kansas due to low aquifer transmissivity (figs. 11 and 12). Over most of western Kansas, the vertical hydraulic conductivity of the overlying Upper Cretaceous aquitard is very low, on the order of 1 x 10⁻⁷ ft/day or less. Freshwater recharge to the confined Dakota is negligible, less than 0.1 % of the lateral flow within the aquifer (fig. 13). Most of the freshwater recharge to the confined Dakota enters where the aquitard is relatively thin and dissected near the outcrop/subcrop areas. Here, the vertical hydraulic conductivity is two to three orders of magnitude higher, and recharge from overlying sources may amount to as much as 10% of the lateral flow within the aquifer. In central Kansas, an additional source of recharge to the Dakota comes from the underlying Cedar Hills Sandstone where both aquifers are hydraulically connected (fig. 12). The total recharge from this source amounts to less than 1% of the lateral flow in the upper Dakota aquifer.
Figure 12--Conceptual model of ground-water flow through the confined Dakota aquifer from the regional recharge area in southeastern Colorado to the regional discharge area in central Kansas. The trace of the cross section is shown on fig. 3. Most of the recharge to the Dakota aquifer is routed back to the surface by local flow systems in central Kansas and southeastern Colorado.
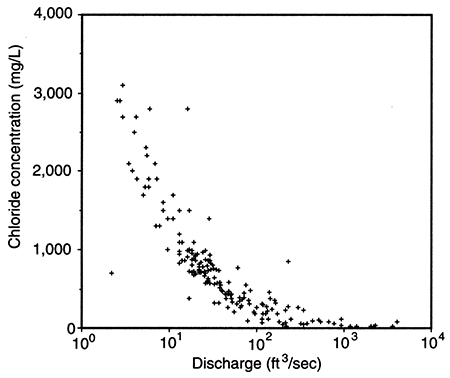
The potentiometric-surface map in fig. 11 indicates that the hydraulic head in the Dakota aquifer is lower in north-central Kansas than elsewhere. Beneath most of the river valleys, the hydraulic head in the Dakota is higher than the water level in the streams and may be higher than the land-surface elevation. This suggests that ground water in the Dakota is moving toward these river valleys from elsewhere in the region and is discharging to streams or to the surface along the sloping valley sides in springs. In the outcrop areas, the flow system in the Dakota is influenced by both regional flow from the confined Dakota to the west and local flow systems that result from local topographic relief. These local systems are replenished by infiltration of local recharge that may be discharged from the aquifer at points up to a few tens of miles away. Also, pumping-test results suggest that the Dakota is generally more permeable in this region than it is to the west. Computer simulations of the steady-state-flow system indicate that the flux of freshwater through the outcrop/subcrop belt is several times higher than in the confined aquifer to the west. In the Washington County area, the annual recharge to the Dakota is estimated to be on the order of 0.25 inches (0.625 cm) where the aquifer is unconfined. As a result, fresh and saline water springs and seeps can be found in the river Valleys. Salt marshes associated with saltwater discharge to surface water are common features in the Saline, Solomon, and Republican River valleys of north-central Kansas (fig. 14). During low-flow periods when baseflow constitutes the bulk of stream discharge, the chloride concentration of surface waters escalates rapidly (fig. 15). Elsewhere, freshwater is discharged from the upper Dakota to the Arkansas, Pawnee, and Wet Walnut River drainages.
Figure 13--Recharge and discharge from the Dakota aquifer in units of ft3/day/mi2.
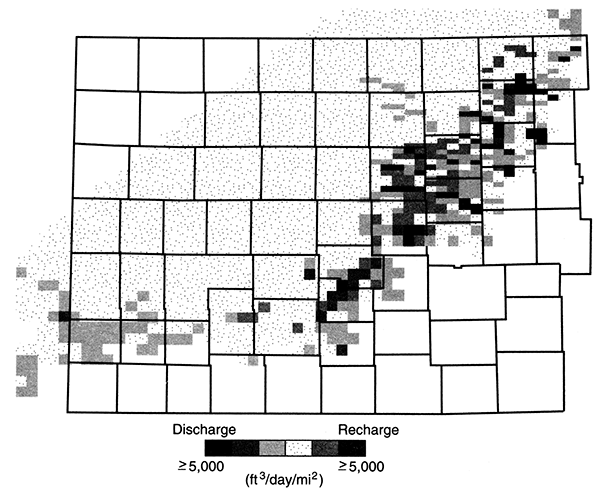
Figure 14--Location of salt marshes in central Kansas. Many of these features are associated with discharge from the Dakota aquifer.
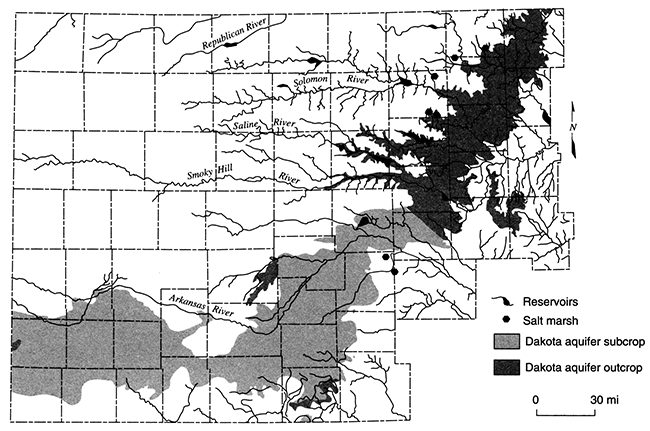
Figure 15--Stream discharge versus chloride concentration at the Saline River gaging stations north of Russell, Kansas.
The quality of ground water depends primarily on the type and concentration of dissolved substances in the water. These substances can be dissolved gases and inorganic and organic solids. In addition, particulates that might accompany water flowing from a well may be of concern. These include sediment from the subsurface formation, microorganisms, and chemical precipitates that might form as a result of the disturbances brought about by the well. The concentrations of the dissolved and particulate substances are of interest because they can affect the water use or operation of the well. One of the most common considerations is whether the concentrations of constituents fall below levels mandated or recommended for drinking-water supply. Table 2 lists the maximum and recommended concentrations for common major, minor, and trace constituents naturally present in Dakota aquifer water. The concentrations are values listed by the Kansas Department of Health and Environment and were adopted mainly from the U.S. Environmental Protection Agency for implementation of the Safe Drinking Water Act.
Table 2--Chemical properties, general concentration ranges, and water-quality criteria for dissolved inorganic substances and selected metals naturally occurring in Dakota aquifer waters. Natural values of the properties and concentrations can be less or greater than listed in the table but are usually within the general range.
| Name | Chemical symbol or representation |
General range, mg/L |
Drinking water criterion, mg/La |
Livestock water criterion, mg/Lb |
Irrigation water criterion, mg/Lbc |
|---|---|---|---|---|---|
| Properties | |||||
| Total dissolved solids | TDSd | 100-60,000 | R 500 | 5,000e | |
| Alkalinityf | Represented as CaCO3 | 10-1,500 | S 300 | ||
| Total hardness/ | Represented as CaCO3 | 10-9,000 | S400 | ||
| pH | 6.3-8.8 | R 6.S-8.5 unitsh | |||
| Major constituents (usually or often greater than 5 mg/L) | |||||
| Calcium | Ca | 2-2,000 | S 200 | ||
| Magnesium | Mg | 1-1,000 | S 150 | ||
| Sodium | Na | 3-22,000 | S 100 | ||
| Bicarbonatef | HCO3 | 12-1,800 | S 120i | ||
| Chloride | Cl | 2-35,000 | R 50 | ||
| Sulfate | SO4 | 1-6,000 | R 250 | 1,000j | |
| Silica | SiO2 | 4-S0 | S 50 | ||
| Minor constituents (usually or often greater than 0.5 mg/L) | |||||
| Potassium | K | 1-150 | S 100 | ||
| Fluoride | F | 0.2-8 | R 2, M 4 | 2 | |
| Nitrate | NO3 | <0.01-3k | M 10 | 100 | |
| Boron | B | 0.03-2 | H 0.6 | 5 | 1 |
| Iron | Fe | <0.001-30 | R 0.3 | 5 | |
| Trace constituents (usually or always less than 0.5 mg/L) | |||||
| Ammonial | NH4 | <0.01-5m | S 0.1 | ||
| Arsenic | As | <0.001-0.05 | M 0.05 | 0.2 | 0.1 |
| Barium | Ba | 0.005-0.5 | M 2 | ||
| Cadmium | Cd | <0.000 1-0.005 | M 0.005 | 0.02 | 0.01 |
| Chromium | Cr | <0.000 1-0.002 | M 0.1 | I | 0.1 |
| Copper | Cu | <0.0001-0.02 | T 1.3 | 0.5 | 0.2 |
| Lead | Pb | <0.0001-0.01 n | T 0.015 | 0.1 | 5 |
| Manganese | Mn | <0.001-1 | R 0.05 | 0.2 | |
| Mercury | Hg | <0.000 1-0.002 | M 0.002 | 0.01 | |
| Selenium | Se | <0.00 1-0.05 | M 0.05 | 0.05 | 0.02 |
| Silver | Si | <0.000 1-0.001 | R 0.1 | ||
| Zinc | Zn | 0.001-2 | R S | 25 | 2 |
| a Criteria from the Kansas Department of Health and Environment (KDHE). R = recommended (Federal Secondary Drinking Water Standard); S = suggested by KDHE; M = maximum contaminant level of U.S. EPA and KDHE; T = must be treated to below level for public supply; H = U.S. EPA health advisory. b Values recommended by the National Academy of Sciences/National Academy of Engineering or U.S. EPA except for sulfate, which is recommended by Environment Canada. c TDS and major constituent concentration limits range widely depending on salinity tolerance of plants and sensitivity of soil to sodium hazard of water. TDS concentration greater than 500 mg/L can be detrimental to sensitive crops whereas water with up to 5,000 mg/L TDS can be used for tolerant plants on permeable soils with careful management practices. d TDS can either be a measured value for evaporation to dryness or a sum of constituents in which bicarbonate is multiplied by 0.4917. e A TDS of greater than 3,000 mg/L is not recommended for poultry, Adult cattle, sheep, swine, and horses can tolerate up to 7,000 mg/L if accustomed to elevated TDS. f Nearly all of the alkalinity in ground water is bicarbonate. The bicarbonate can be calculated from the alkalinity by multiplying by 1.219. g Total hardness is the sum of calcium and magnesium concentrations multiplied by 2.497 and 4.116, respectively, to represent conversion to CaCO3. h The unit of pH is dimensionless and represents the negative log of the activity of the hydrogen (hydronium) ion in water. i The recommended limit for drinking water is based on conversion of the alkalinity value. j Very young livestock are sensitive to sulfate and may not be able to tolerate above 400 mg/L. k Concentration as nitrate-nitrogen. Values greater than 3 mg/L are often observed but are nearly always the result of human activities. Contaminated Dakota waters have been observed with nitrate. l Ammonia is present in natural water primarily as ammonium ion (NH4+). m Concentration as ammonia-nitrogen. n Lead concentrations >0.01 are occasionally observed in waters from water-supply wells. These are believed to be mainly related to lead in the piping system. |
|||||
Natural rainfall contains dissolved air and a very small amount of dissolved solids. During the travel of rainfall through soil, sediment, and rock to reach an aquifer, the water dissolves additional solids. Most of the soluble solids picked up by the water are inorganic because inorganic minerals are the main component of soils, sediments, and rocks; natural organic substances also tend to be less soluble than common mineral salts. Water flowing deeper into the subsurface may encounter very soluble minerals such as rock salt and produce saltwater after dissolving the salt. Other deep subsurface waters can be highly saline because they were originally trapped seawater that has been further altered through geologic time.
The total dissolved solids content (often abbreviated TDS) is a general measure of the salinity of a water. The most common substances contributing to the dissolved solids of most ground waters are the inorganic constituents calcium, magnesium, sodium (positively charged cations) and bicarbonate, chloride, and sulfate (negatively charged anions). Bicarbonate may also be represented as alkalinity in some water analyses. Inorganic constituents commonly contributing minor amounts to ground-water TDS are silica (uncharged), potassium (a cation), and nitrate and fluoride (anions). There are a large number of other individual and combined elements dissolved in water, including gases and metals. Table 2 lists the names, properties, and chemical symbols or representation for common major and minor dissolved inorganic substances, as well as several dissolved metals in Dakota aquifer waters. Concentrations of these dissolved substances are often reported as milligrams per liter (abbreviated mg/L). This concentration unit is essentially the same as a part per million (ppm) in freshwater, because the weight of a liter of water with dilute concentrations of dissolved constituents at ground-water temperatures is very close to 1,000 grams (one million milligrams). (In saltwater, a mg/L is a few percent different from a ppm because the density of the solution is greater than for freshwater.) Concentrations of trace amounts of dissolved constituents are often listed as micrograms per liter (µg/L), which is very close to parts per billion (ppb) in freshwater.
Freshwater is often defined as water containing less than 1,000 mg/L TDS. Freshwaters in the outcrop and subcrop portions of the upper and lower Dakota aquifers are usually calcium bicarbonate or calcium, magnesium bicarbonate-type waters. Most soils and near-surface rocks in Kansas, including the Dakota aquifer, contain at least small amounts of calcium carbonate present as calcite (CaCO3). The calcite contains small amounts of magnesium and the mineral dolomite (CaMg(CO3)2) can also be present. During infiltration of rainfall, the carbonate minerals dissolve and add calcium, magnesium, and bicarbonate to the water. Small amounts of other inorganic constituents also are dissolved from soils and near-surface rocks. These substances are present in the main carbonate minerals and in the small amounts of other soluble minerals, are adsorbed on clays, or have been concentrated as salts in soils during dry periods. Typical ranges of major constituents and fluoride concentrations in the most common chemical types of Dakota waters are listed in table 3.
Table 3--Typical ranges of major constituent and fluoride concentrations in the most common types of ground water in the Dakota aquifer. The water types are listed in order of generally increasing total dissolved solids (TDS) concentration.
| Constituent | Typical range, mg/L |
|---|---|
| Calcium bicarbonate type | |
| Calcium | 30-150 |
| Magnesium | 10-40 |
| Sodium | 10-60 |
| Bicarbonate | 150-400 |
| Chloride | 5-80 |
| Sulfate | 10-130 |
| Fluoride | 0.5-1.5 |
| Sodium bicarbonate type | |
| Calcium | 3-50 |
| Magnesium | 1-20 |
| Sodium | 100-350 |
| Bicarbonate | 25O-600 |
| Chloride | 20-200 |
| Sulfate | 20-200 |
| Fluoride | 1.5-5 |
| Calcium sulfate type | |
| Calcium | 80-600 |
| Magnesium | 15-90 |
| Sodium | 30-400 |
| Bicarbonate | 200-400 |
| Chloride | 20-500 |
| Sulfate | 200-1,800 |
| Fluoride | 0.4-1.5 |
| Sodium chloride type | |
| Calcium | 10-800 |
| Magnesium | 5-800 |
| Sodium | 300-15,000 |
| Bicarbonate | 200-1,300 |
| Chloride | 300-20,000 |
| Sulfate | 100-5,000 |
| Fluoride | 0.5-4 |
Fine-grained sediments in the upper and lower Dakota aquifers and overlying rocks often contain the mineral pyrite (FeS2). The pyrite weathers to produce dissolved iron and sulfate. The iron can then oxidize and precipitate as iron oxide and oxyhydroxide (hydrous oxide), which produces the red to orange coloration commonly occurring in Dakota strata. The solution from pyrite weathering is acidic and dissolves additional calcite in a natural neutralization process. These processes increase the calcium and sulfate concentrations dissolved in Dakota waters. Rocks overlying the Dakota aquifer such as the Graneros Shale often include gypsum (CaSO4 · 2H2O), a very soluble mineral. Water infiltrating through these rocks can have relatively high concentrations of calcium and sulfate from dissolving gypsum. Recharge passing through rocks with gypsum and entering Dakota strata can substantially increase the calcium and sulfate content of waters in the upper aquifer. In some cases calcium sulfate waters may result, although this water type is not as common as other chemical types in ground water from the Dakota (table 3).
Large areas of the Dakota aquifer contain saltwater (primarily dissolved sodium and chloride). Concentrations of TDS can be in the tens of thousands of mg/L (table 2). Geochemical tests have identified the main source of this saltwater as dissolution of rock salt (NaCl) in Permian rocks underlying Dakota strata. Although most of the Dakota sediments probably contained seawater either during their deposition (the marine shales and sandstones) or after deposition when the sea covered these units, nearly all of the seawater has been flushed out by surface recharge. However, saltwater from the underlying Permian rocks has been slowly intruding into Dakota strata for millions of years. The salt-dissolution brine replaced the seawater source of salinity long ago. During more recent geologic time, freshwater recharge has been slowly flushing saltwater from the Dakota aquifer.
The past occurrence of saline water in Dakota aquifer strata resulted in the adsorption of large amounts of sodium on the clays in the shales, siltstones, and sandstones. As freshwater of calcium bicarbonate type slowly flushed the saline water from the aquifer, the process of natural softening of the water occurred as dissolved calcium and magnesium adsorbed on the clays and released sodium to solution. The decrease in calcium concentration allowed some calcite to dissolve where present in aquifer strata, thereby supplying additional calcium and bicarbonate to the water. The added calcium was then available for more cation exchange with sodium. Some additional bicarbonate may have been generated from slow oxidation of organic matter trapped in the aquifer framework. The combined effect of these processes increased dissolved sodium and bicarbonate concentrations while decreasing dissolved calcium, magnesium, and chloride concentrations in confined parts of the Dakota aquifer where the water is now fresh to slightly saline. The water types range from sodium bicarbonate to sodium chloride, bicarbonate to sodium chloride with excess sodium in the direction of increasing salinity. These waters are typically soft because the calcium and magnesium concentrations are relatively low. Typical ranges of major dissolved constituents in sodium bicarbonate waters in the Dakota aquifer are listed in table 3.
The pH of the sodium bicarbonate waters in the confined upper Dakota is alkaline and usually in the 7.5 to 8.5 range (pH is a measure of how acidic or alkaline a water is; a value of 7.0 units represents a neutral solution at room temperature). Elevated concentrations of dissolved fluoride also are usually associated with the sodium bicarbonate waters, ranging from over 1 mg/L to several or more mg/L in comparison with less than 1 mg/L for calcium bicarbonate type waters. The high fluoride levels derive from calcium minerals containing fluoride (probably mainly apatites). The low calcium concentration resulting from the cation exchange that produced the sodium bicarbonate water allowed the calcium minerals to dissolve. Some fluoride adsorbed or weakly attached to clays was released in the higher pH waters by exchange with hydroxyl ion (OH-).
Other naturally occurring constituents of interest in upper Dakota waters are iron and manganese. Dissolved concentrations of iron range from less than a few µg/L to over 10 mg/L and manganese concentrations range from less than a µg/L to nearly a mg/L. The greater concentrations occur in two types of environments. One is in the outcrop or subcrop area of the Dakota aquifer where recharge containing dissolved oxygen reaches strata containing pyrite. Oxidation of pyrite was referred to earlier as a source of sulfate as well as dissolved iron in ground waters. Such waters can have a pH between 6 and 7 (very slightly acidic). The other type of environment exists where reactions with dissolved constituents and sediments have essentially completely consumed dissolved oxygen and produced a chemically reducing environment. This commonly occurs in the confined portion of the Dakota aquifer because the water is old, and no recent recharge with significant oxygen can enter. The reducing environment allows iron, manganese, and some other heavy metals to dissolve from the sediments. These waters can sometimes have a high enough hydrogen sulfide (H2S) content to give a "rotten egg" odor. Ammonium ion (NH4+) levels can be over a mg/L in the reducing environment (table 2).
Figure 16 shows the distribution of total dissolved solids (TDS) concentrations in the upper Dakota aquifer. The present salinity pattern of Dakota waters is mainly dependent on the rate at which freshwater is able to enter from above and move along the long flow paths in the aquifer in comparison with the rate of saltwater intrusion from the underlying Permian rocks. In some regions the saltwater is able to more rapidly intrude into the bottom of the Dakota, such as in parts of central to north-central Kansas where the Dakota directly overlies the Cedar Hills Sandstone (fig. 8). In northwest Kansas the thickness of the confining units is great and the amount of freshwater throughflow is low. The Dakota rocks contain saltwater in both of these regions. Surface recharge along the outcrop belt of the Dakota aquifer in southeast Colorado and central Kansas occurs at a much greater rate than underlying saltwater intrusion, resulting in essentially complete flushing of any previous saltwater. Fresh recharge flowing through the Dakota sandstones in southwest Kansas has also removed nearly all salinity. The freshwater flowing through sandstones in the confined aquifer between northwest and central Kansas has removed much of the saltwater, but enough dissolved salt remains to make much of the water slightly to moderately saline. The rate of flushing is slow, such that substantial changes would take many thousands of years. In general, the greater the distance from the edge of the confining zone, the greater the salinity.
Figure 16--Distribution of total dissolved solids (TDS) concentrations in ground waters in the upper Dakota aquifer in western and central Kansas. Water less than 1,000 mg/L TDS is defined as fresh. Water with 1,000-2,000 mg/L TDS is usable for many purposes but is less desirable than freshwater. A concentration of 10,000 mg/L TDS is defined by State statute K.S.A. 55-150 (g) of the Kansas Corporation Commission as the upper limit of usable water; above 10,000 mg/L TDS, water is classified as unusable or mineralized.
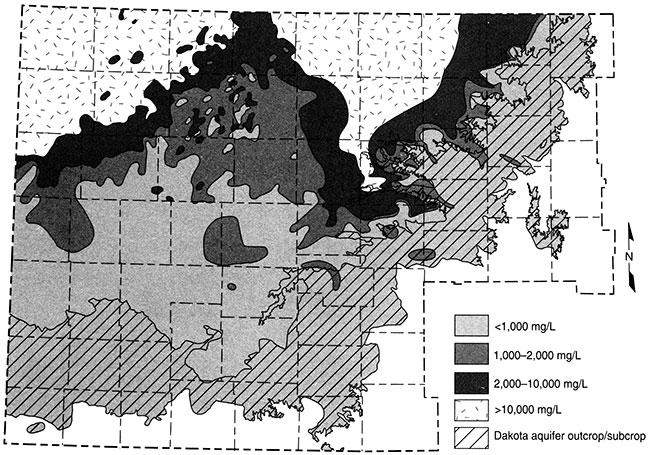
Ground water in the areas of the upper Dakota aquifer with high TDS or salinity (greater than 5,000 mg/L) shown in fig. 16 are of sodium chloride type. Waters in the area of the confined aquifer with 500-2,000 mg/L TDS are generally soft (low calcium and magnesium content), sodium bicarbonate in chemical type, and usually have elevated fluoride concentrations. Ground water with 2,000 to 5,000 mg/L TDS in the confined area is typically transitional between sodium bicarbonate and sodium chloride type. Waters in the outcrop and subcrop areas with less than 500 mg/L TDS usually are of calcium bicarbonate and sometimes of calcium, magnesium bicarbonate type. Concentrations of TDS between 500 and 2,000 mg/L in waters in the outcrop/subcrop areas are often due to high calcium and sulfate levels such that the waters can be calcium sulfate in type. Elevated sulfate concentrations can also produce sulfate type waters in less saline portions of the confined aquifer.
Figures 17 and 18 show the change in the relative concentrations of selected constituents in waters from supply wells along a traverse from the recharge area in southeastern Colorado, through the confined Dakota aquifer in western Kansas to the discharge area in central Kansas (see the cross section line on fig. 12). Although chloride is the predominant anion contributing to the large increase in TDS concentration in the Dakota aquifer in central Kansas (fig. 16), other anions are more important for TDS increases in western Kansas, as indicated by the relatively low chloride content (<100 mg/L) north to about R. 33 W. (fig. 17). Sulfate and chloride concentration of ground waters in the overlying High Plains aquifer and in the Dakota aquifer to the south near and within the unconfined areas tend to be substantially lower than in Dakota aquifer waters well within the confined-aquifer area.
Figure 17--Regional profile of sodium, chloride, and sulfate concentrations in ground waters in the upper Dakota aquifer along a cross section from southeastern Colorado to central Kansas. The approximate trace of the profile is shown in fig. 11.
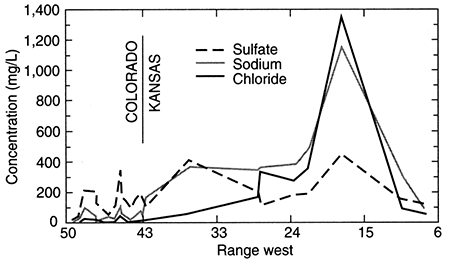
Figure 18--Regional profile of calcium, magnesium, and fluoride concentrations in ground waters in the upper Dakota aquifer along a cross section from southeastern Colorado to central Kansas. The approximate trace of the profile is shown in fig. 11.
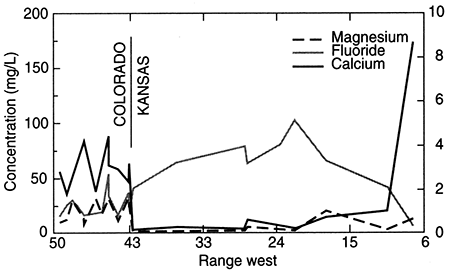
Sodium concentration in Dakota waters (fig. 17) follows a similar pattern as TDS along the cross section. The increase in sodium concentration along the flow path is derived from both softening (cation exchange with calcium and magnesium) and increased intrusion of saltwater from the underlying Permian as the waters approach central Kansas. In contrast, dissolved calcium and magnesium concentrations decrease appreciably from the local flow area of southeastern Colorado to the confined Dakota aquifer in western and central Kansas (fig. 18). Ground waters in southeastern Colorado derive calcium and magnesium from leaching of carbonate minerals concentrated in soils in an environment of greater evapotranspiration than precipitation, and also from carbonate minerals in the aquifer rocks. The aquifer is well flushed in this area, thus any saline water has been essentially removed, and sodium and chloride concentrations in the ground water are low. The flushing in the Dakota aquifer in southeastern Colorado has been extensive enough to also remove high sodium contents adsorbed on clays deposited in brackish or marine environments or subjected to later saltwater intrusion from underlying Permian strata. Thus, any former capacity to soften recharge waters has been largely removed, and recharge retains its higher calcium plus magnesium than sodium content.
When the calcium bicarbonate to calcium sulfate type waters flowing deep enough in the system reach the confined portion of the Dakota aquifer in western Kansas, exchange of calcium and magnesium for sodium becomes important. The aquifer in the confined area has not been as well flushed as in the local flow areas, leaving high sodium concentrations on marine clays or on clays subjected to saline waters derived from Permian saltwater intrusion in earlier geologic time. The high exchange capacity of most aquifer clays acts as a reservoir that must be changed by large volumes of interacting waters before the adsorbed cation concentrations approach ratios that are near equilibrium with the recharge waters, and thus no longer appreciably change the inflow chemistry.
Calcium and magnesium concentrations can become as low as a few mg/L each in the confined Dakota aquifer along the cross section in western Kansas. In contrast, the calcium concentrations in overlying High Plains aquifer waters and in the Dakota water from the southern flow path are within the range of the Dakota aquifer waters in southeastern Colorado. The decrease in calcium and magnesium is abrupt near the state line. The calcium plus magnesium/sodium ratio remains low along the northern flow path until the confining layer thins in central Kansas. Flushing of the saline water that intrudes from the underlying Cedar Hills Sandstone and removal of the high adsorbed sodium content on clays by recharge in the local flow area in central Kansas allows the return of the water type to calcium bicarbonate. The calcium plus magnesium/sodium ratio in the High Plains and Dakota waters in the unconfined Dakota aquifer in southwestern Kansas is within the same range as for the Dakota ground waters in southeastern Colorado and in the local recharge-discharge area in central Kansas. Relative changes in fluoride concentrations along the flow path are generally inversely related to the calcium concentrations due to the dissolution of fluoride-containing calcium minerals (fig. 18).
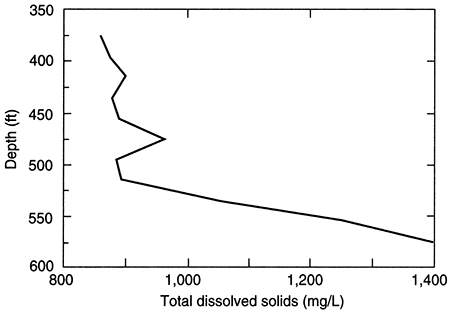
Where saline waters exist in the Dakota aquifer or in underlying strata, salinity generally increases with depth. The rate of change with depth is seldom uniform; TDS is often substantially greater below local or regional low aquitard units that impede the upward movement of salinity. This is especially true where the Kiowa shale aquitard is present and separates saltwater in the lower Dakota aquifer from fresh or much less saline water in the upper Dakota. An example of this is shown in the change in TDS concentration with depth for a test hole in Ellis County (fig. 19). The depth interval for the Dakota Formation is 295-548 ft (98-183 m) in the test hole; the hole then penetrated the Kiowa Formation starting at 548 ft (183 m) before drilling was stopped at 595 ft (198 m). The TDS content generally increases in waters collected from silty sandstone and sandstone units in the test hole from 375 to 515 ft (125-213 m). The salinity appreciably increases in the test-hole waters sampled from the bottom of a sandstone just above siltstone and shale of the Kiowa Formation, and it continues to markedly increase within the Kiowa.
Figure 19--Depth profile of total dissolved solids (tds) concentrations in the Dakota aquifer based on data for a test hole in Ellis County, Kansas.
The substantially greater permeability of the sandstone units within the Dakota aquifer in comparison with the shales can allow a faster rate of flushing of salinity by fresher regional flow. The general inverse correlation of the particle size of the Dakota sediments with TDS concentrations in areas where some salinity exists, primarily in the confined aquifer, means that substantial local differences can occur in both the vertical and areal distribution of water quality depending on the particular sandstone-to-shale ratio. Consequently, often the better the water-yielding characteristics of the aquifer, the better the water quality within a given area. In some locations where a thick sandstone body is found below low-permeability rocks in the Dakota aquifer, the water can be fresher in the sandstone than in the overlying, less-permeable units.
In the confined aquifer, recharge passing through the overlying units can have appreciably higher calcium, magnesium, and sulfate concentrations than in the fresh to slightly saline portions of the upper Dakota aquifer. An example of the changes with depth in these dissolved constituents in the upper Dakota aquifer is illustrated in figs. 20 and 21 for the same test hole in Ellis County as for fig. 19. The decrease in calcium and magnesium and the increase in sodium content caused by the softening process is marked in the upper part of the aquifer. The increase in dissolved sodium with depth is greater than that of chloride in the upper part of the formation, whereas the increase in chloride is greater towards the bottom (fig. 20). The fluoride concentration follows a pattern with depth opposite to that of the calcium because the low calcium concentration within the aquifer waters allows fluoride-containing calcium minerals to dissolve (fig. 20). Fluoride then decreases with depth at the bottom of the Dakota aquifer and into Permian strata where calcium concentrations are much greater in the saline water. Note the parallels of the constituent concentration changes with depth in figs. 20 and 21 to the changes along the cross section (figs. 17 and 18) from the recharge area in southwestern Kansas to the saline water in the confined aquifer in central Kansas.
Figure 20--Depth profile of sodium, chloride, and sulfate concentrations in Dakota aquifer waters from the same test hole in Ellis County as that of fig. 19.
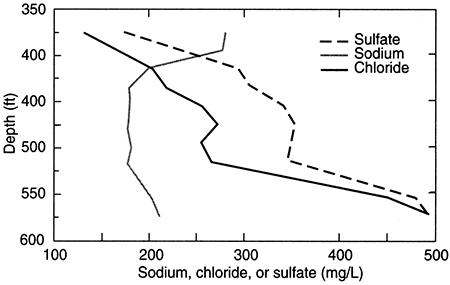
Figure 21--Depth profile of calcium, magnesium, and fluoride concentrations in Dakota aquifer waters from the same test hole in Ellis County as that of fig. 19.

The local and regional complexity of the Dakota aquifer and its influence on ground-water flow and water quality can best be appreciated by viewing a subsurface cross section across central Kansas. Gamma-ray logs (and other log types) are routinely used for stratigraphic correlation of sandstones between wells. A stratigraphic framework can be drawn out by linking laterally continuous levels recognized on the logs. The conventional log is presented as a wiggle trace, but there are other graphic methods that can be used to present the same data. The best graphic technique is one that produces a plot with information content that can be easily understood by viewers. A display of many logs on a regional cross section can be both tiring and confusing to the eye as it tries to make sense of multiple curves.
Alternatively, a well-designed image transformation can be made to mimic subsurface geology in a compelling and direct manner. A gray-level scale is adequate to capture the variation of the gamma-ray log. Because the gamma-ray log is primarily sensitive to volumetric content of shale, the obvious choice of gray-scale is to equate the lowest readings with white, the highest with black. Using this convention, the gray-level image from a gamma-ray log will often show a striking mimicry of interbedded shale sequences as would be seen in an outcrop. The use of color can be made to accentuate shades and tones that may be too subtle for the human eye to differentiate in their gray form. Different lithologies therefore often have distinctive colors, while sharp contacts show as breaks in color and are contrasted with transitional blends of gradational sections. Ideally, the result of a regional cross section of transformed logs is a false-color image in which structure and stratigraphy are revealed automatically, as the eye interpolates lateral changes between the separate images at their point locations.
Gamma-ray logs of closely spaced wells along a lengthy east-west traverse across central Kansas at T. 16 S. were digitized from just below the Stone Corral (Lower Permian) to the Fort Hays Limestone Member of the Niobrara Chalk (Upper Cretaceous). Each digital gamma-ray log was transformed to a gray-level image strip, where the darkness intensity is a function of the natural gamma radioactivity of the logged formations. Under this system, sandstones and limestones appeared as white or pale gray, while shales registered as dark gray or black. As an enhancement of this method, the gray intensities were converted to an arbitrary color scale in order to accentuate differences between stratigraphic units. The use of color was then similar to that used on multicolor topographic-relief maps, where the single variable of elevation is color-coded as a visual aid. When hung together on a common stratigraphic horizon and arranged in correct geographic order, the result is a regional image of the subsurface geology of the Permian to Cretaceous sequence. The major advantage of this approach is that the information is coded in a visual form that is close to a simulation of how the geology would actually appear, when making allowance for the vertical exaggeration.
The resulting regional image is shown in fig. 22 with the colors indexed with some major subsurface units. All the transformed gamma-ray logs are referenced to a common stratigraphic datum, the top of the Graneros Shale (table 1), which is easily recognized on gamma-ray logs and is easily identified in the cross section (fig. 22). The regional strike of the top of the Graneros Shale is approximately parallel to the trace of the cross section.
Figure 22--Colorized gamma-ray log intensity image of the Permian-Cretaceous section in western Kansas along T. 16 S. Each strip is a false-color rendition of a gray-level transformation of a gamma-ray log. Datum is the top of the Graneros Shale.
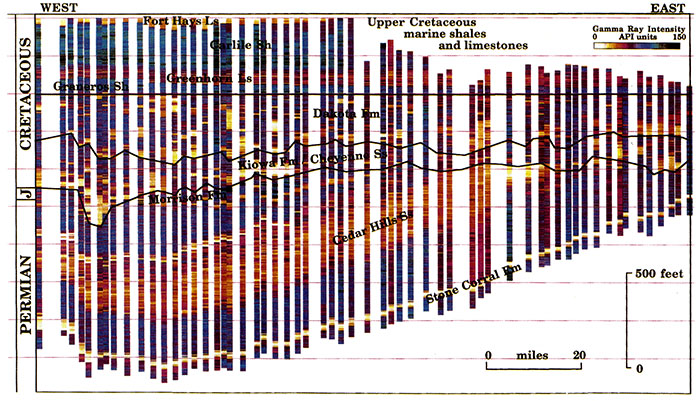
In fig. 22, the Permian units and the Jurassic Morrison Formation dip to the west in contrast to the nearly horizontal overlying Cretaceous sequence. The boundary between these two sequences is a regional angular unconformity that was produced by erosion prior to the deposition of Cretaceous deposits in Kansas and elsewhere. Within the Permian, the Stone Corral Formation forms a distinct and continuous band at the base of the cross section. The Cedar Hills Sandstone is the most obvious feature in the overlying Permian units as a thick continuous wedge that subcrops at the base of the Cretaceous to the east. The Cedar Hills Sandstone is an aquifer that contains natural halite-solution brine and is hydraulically connected to the overlying Dakota aquifer where they are in contact in central Kansas.
Most of the ground-water flow in the Dakota aquifer is through the thicker, and more extensive, sandstones that form a hydraulically continuous network. The sandstones of the Dakota Formation constitute the bulk of the upper Dakota aquifer. In the cross section, the sandstones in the lower part of the upper Dakota seem to be more continuous than overlying sandstones, perhaps because the east-west orientation of the cross section follows the trend of the paleodrainage at the time of their deposition. These overlying sandstones were deposited in environments that were closer to the north-south shoreline of the Western Interior sea and thus appear to be more patchy and discontinuous. This is the expected outcome of viewing the complex, three-dimensional mosaic of deposits that are typically found in river valleys and coastal plains in a single east-west cross section.
Beneath the upper Dakota aquifer, the thick blue bands in the western two-thirds of the cross section represent thick shales deposited offshore in a marine environment in the Kiowa Formation (fig. 22). The thick marine shales form the Kiowa shale aquitard. Thick, light-yellow bands just above the regional angular unconformity are the channel sandstone bodies in the lower Dakota aquifer (Cheyenne Sandstone) that rest on the regional unconformity that marks the base of the Cretaceous.
These were deposited in river valleys like the one shown near the west edge of the cross section. To the east, the thinner blue bands alternating with red and orange bands in the Kiowa in the eastern third of the cross section represent the interbedded sandstones and shales of the lower Dakota aquifer (Longford Member [Kiowa Formation]). In central Kansas at the east end of the cross section, the thicker yellow bands represent sandstone bodies that were deposited in deltaic environments during Longford deposition. Along the cross section (T. 16 S.), ground-water within the lower Dakota is believed to be at least brackish in quality. Where the Kiowa shale aquitard is absent in central Kansas, brines from the Cedar Hills Sandstone aquifer and brackish ground waters from the lower Dakota aquifer move upward into the upper Dakota aquifer. These saline ground waters are eventually discharged to streams crossing the Dakota aquifer outcrop.
The marine transgressive sequence of the Upper Cretaceous above the Dakota Formation (Graneros Shale, Greenhorn Limestone, Carlile Shale, and Niobrara Chalk) shows as broad regional bands at the top of the section. The limestones and chalks show as orange and yellow and the shales and siltstones as green and red. These units form the Upper Cretaceous aquitard along the cross section and restrict the vertical movement of recharge to lower aquifers from overlying sources.
Kansas Geological Survey, Geohydrology Section
Placed on web Aug. 19, 2014; originally published in 1999.
Comments to webadmin@kgs.ku.edu
The URL for this page is http://www.kgs.ku.edu/Publications/Bulletins/TS13/index.html