Kansas Geological Survey, Technical Series 2
Prev--Report Start ||
Next--Appendices
In his reconnaissance of the Great Plains in the early 1900's, N. H. Darton found widespread use of the Dakota for drinking water, steam locomotives, and non-irrigated agriculture. Flowing wells were very common in the Arkansas River valley of southeastern Colorado, in much of South Dakota, and parts of southeastern North Dakota and northeastern Nebraska in the Missouri River Valley. The artesian pressure within the aquifer in these areas was sufficient that many of the wells produced an adequate supply of freshwater without a pump.
In the Arkansas River valley of southeastern Colorado, the depths of these flowing wells ranged from more than 1,000 ft (300 m) at Pueblo and Fowler, Colorado, to 300 ft (90 m) at Coolidge, Kansas. Darton found considerable artesian pressure in many of the wells he visited. He estimated that in some cases if the well casing were extended up into the air, water levels would rise from a few feet up to 150 ft (45 m) above land surface. Flow rates ranged from less than one up to more than 100 gallons (3.8-380 L) per minute.
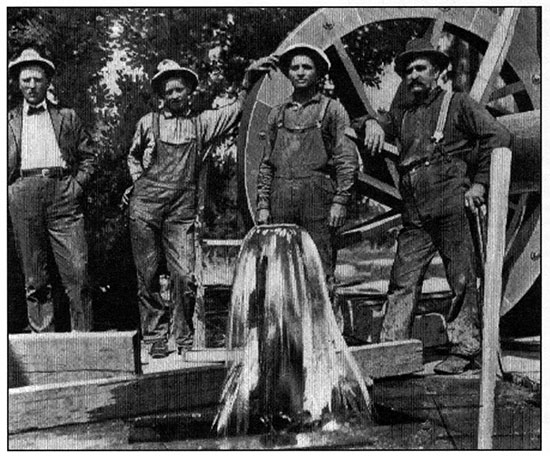
Figure 23 shows one of the flowing artesian wells visited by Darton in the early 1900's. The water levels in the first flowing artesian Dakota wells at Coolidge, Kansas, in 1885, were estimated to be almost 20 ft (6 m) above land surface. At the time of Darton's survey, flowing artesian wells in the Arkansas River valley between Coolidge and Syracuse produced 25 to 75 gallons (95-285 L) of water per minute. By the 1930's and early 1940's, the flow rates from these wells decreased to 30 gal (114 L)/min or less in this same stretch of the Valley.
Figure 23--Flowing wells in the Dakota aquifer in southeastern Colorado.
In the 1940's, flowing wells were commonly found in an area of the Bear Creek drainage north of Walsh, Colorado, and referred to as the Walsh artesian area. The flowing wells were 200-250 ft (60-75 m) deep and the static water levels were estimated to be 12-31 ft (3.6-9 m) above land surface. Flow rates from these wells ranged from a trickle up to an estimated 100 gallons (380 L) per minute during this time.
Many of the wells inventoried by Darton in the Arkansas River valley did not flow naturally to the surface. Water levels were generally 75 ft (22.5 m) or less below land surface eastward of Lamar, Colorado. Darton reported that some of the artesian pressure had been lost due to pumping and unregulated, year-round discharge from the flowing wells. Steam- or wind-power was needed to bring water to the surface at rates that ranged from 25 to 80 gal (95-304 L)/min. In 1913, the Kansas Geological Survey produced a map that outlined an area where the Dakota could be practically used for water supply. This area included most of the Arkansas River drainage above Great Bend, Kansas, and a portion of the Cimarron River basin. The extent of the area outlined was determined on the basis of only a few scattered reports of Dakota wells in Kansas. The early Survey scientists observed freshwater springs emanating from the hillsides in central Kansas. They reported that these springs were fed locally by the Dakota aquifer, but did not mention the springs' use by the local population for water supply.
Since the 1930's, the attention of users has been largely focused on the shallower and more prolific sources of water in the High Plains aquifer and in the river valleys of Kansas. In the last few decades, these shallower sources of water have been under intense development primarily from irrigated agriculture, especially in western Kansas. As a result, water levels in these shallow aquifer systems have declined significantly, and in several instances these sources now are insufficient to meet existing demand in local areas. During this period, the competition for water stimulated interest in tapping deeper sources in the Dakota aquifer in western Kansas to supplement yields from the dwindling shallower sources.
In the late 1970's, a regional study of the Dakota aquifer was conducted by K. M. Keene and C. K. Bayne of the Kansas Geological Survey, and their results were reported in the Survey's Chemical Quality Series 5, Ground Water from Lower Cretaceous Rocks in Kansas. They estimated that 80-95 million acre-ft of water with a total dissolved solids concentration of less than 3,000 mg/L could potentially be withdrawn from the Dakota. However, they recognized that development of water resources for irrigation of crops could be limited due to the complexity and highly variable water quality of the Dakota.
In southwestern Kansas, the institution of new management policies for the High Plains aquifer sparked interest in the Dakota as a source of water for irrigating crops. New management policies and regulations were developed and instituted by Southwest Groundwater Management District 3 that applied to both the High Plains and the Dakota aquifers. These policies and regulations were based on a limited quantitative understanding of the hydrologic interactions between the Dakota and the overlying High Plains aquifer in the District. The new regulations featured a graduated well spacing based on the yearly withdrawal of ground water from the well to be installed.
In north-central Kansas in the early 1970's, limited use of the Dakota aquifer for irrigating crops in southwestern Washington and adjacent Cloud and Republic counties also began and has continued to the present. The only guidelines applied to this development stipulated a well spacing of 1 mile (1.6 km) between the higher-yielding (greater than 150 gal [570 L]/min) irrigation and municipal wells.
Initial development of water resources in an aquifer depends on the quantity and quality of water available for particular uses and the economic costs to obtain the supply. After initial development, further water production also depends on the aquifer's ability to sustain additional withdrawals. At least moderate quantities of water can be found in the Dakota aquifer, where thicker sandstones have been identified locally by previous investigations or test drilling. Thus, the current level of development of the Dakota aquifer has been largely driven by the need for freshwater supplies where surface waters or more economically obtainable ground water are not present from the alluvial valley and High Plains aquifers. In addition, where available surface and ground waters have already been appropriated, wells have been drilled into the Dakota aquifer for supplies. Most of the development in the Dakota aquifer also has occurred where the depths to substantial sandstones are shallow to moderate (less than about 750 ft [225 mj), keeping well-construction costs within reason. Thus, most of the wells are located in the outcrop/subcrop area and the margin of the confined aquifer where the thickness of overlying rocks is not great. A past economic incentive that drove development in southeastern Colorado and the westernmost part of southwest Kansas was the artesian nature of the aquifer which caused wells to flow or nearly flow. Declines in the potentiometric surface in these areas have removed much of this incentive.
Additional development of water resources in the Dakota aquifer will be determined largely by the needs of users, the availability of water from the Dakota and other aquifers, and the management goals and the planning horizons established by state and local water planning and regulatory agencies in Kansas. Management options, including issues related to long-term sustainability, are discussed more fully in the "Sustainability of the Dakota Aquifer" section of this report.
In general, the closer potential well sites are to the northwest corner of Kansas, the greater the depth to the top of the Dakota aquifer. This makes well construction and pumping more expensive. Where the depth to the top of the confined aquifer approaches 1,000 ft (300 m) or more, the depth to water from land surface approaches 300 to 350 ft (90-105 m). Uses that are more water intensive, such as irrigated agriculture, are not practical because of the high energy costs associated with production relative to well yield. As a result, the Dakota is currently an underutilized resource in most of western Kansas because of the availability of shallower, more prolific supplies in the High Plains aquifer. However, as these supplies continue to become scarcer and more valuable, exploration for usable waters in the confined aquifer will increase for other uses, such as public water supply, stock watering, and domestic purposes. The salinity of Dakota aquifer waters is one of the most important factors limiting current exploration in the confined aquifer. Water availability and economics have caused the City of Hays to develop slightly saline waters in the Dakota in west-central Ellis County. For a short time, Hays also experimented with advanced treatment technologies to reduce the level of salinity in the water coming from its new well field.
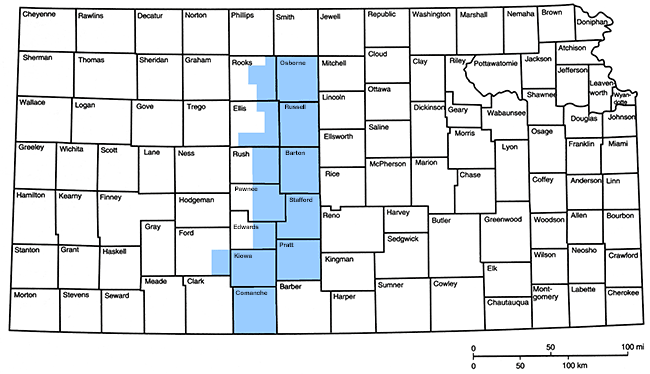
The Dakota Aquifer Program has discovered a substantial area of additional waters that are nearly fresh to slightly saline that could be important for future supplies. The aquifer area is roughly shaped as a triangle with its base along the south lines of Sheridan and Graham counties and extending into south-central Norton County (fig. 16). Most ofthis area was previously believed to have waters of substantially greater salinity. Regional flow of fresher ground water through the Dakota aquifer from the southwest is believed to have flushed salinity to the present levels. Some waters may even be slightly less than the TDS classification for fresh (less than 1,000 mg/L) in thick and wide sandstones in the south-central portion of this triangle where greater permeability could have allowed more extensive flushing. Parts of western Gove County may also have more freshwater than earlier thought.
Partially developed areas where additional withdrawals could occur are mainly (1) underneath greater saturated thicknesses of the High Plains aquifer in southwest Kansas, (2) in the portions of the aquifer not currently greatly stressed in the eastern outcrop/subcrop area, and (3) in the zone of the confined aquifer nearest the outcrop/ subcrop belt. In the confined aquifer the sandstones in the upper Dakota aquifer will be the primary targets for new exploration because of their greater thickness and permeability and lower levels of salinity. In southwest Kansas, the primary targets for exploration will be the sandstones in both the upper and lower Dakota aquifers and in the Morrison-Dockum aquifer. In the outcrop areas of central Kansas, the sandstones in the upper Dakota and near the eastern margin, in the lower Dakota will be likely targets of exploration for new water supplies.
The search for suitable freshwater-bearing sandstones can be frustrating and costly if users rely only on random test-hole drilling. In most cases exploration efforts must be made in an organized manner, starting with a review of the available information from Federal, State, and local agencies, water-well drillers, and other users of the Dakota aquifer in each local community. Appendix 2 is a listing of the various sources of information on the Dakota aquifer by agency, a synopsis of the information they can provide to users in Kansas, and their phone numbers and addresses. Appendix 3 is a short bibliography of reports that provide helpful background information on the Dakota aquifer and ground water in Kansas in more detail than is discussed in this publication. The remainder of this section ofthe user's guide is devoted to the use of geophysical logs in the exploration for freshwater in the Dakota aquifer and other major aspects of the exploration program leading to the installation of a well in the aquifer.
Delineation of local aquifer zones--The geology of the shallow subsurface in the western and central parts of Kansas is complex, because of periods of uplift, erosion, and deposition in the geologic past. This has resulted in complicated geologic relationships between rock units and created considerable variation in thickness and lithology within these units. Because of this complexity, the search for water supplies within the Dakota usually requires a test-hole drilling program to locate suitable aquifer zones. This can be expensive if a preliminary analysis of the available subsurface information is not performed to limit the scope of exploration. The information needed for this preliminary analysis is collected by technically trained people and contained in the geophysical logs of wells drilled for oil and gas and the logs of the cuttings produced during the drilling of boreholes for wells (a driller's log). The objective of this analysis is to identify the target stratigraphic units likely to contain sandstones sufficient for water production. To do this, well-site geologists or drillers must be able to locate formation boundaries from the logs of their test holes and integrate the results with the available information from surrounding boreholes. This is accomplished using geologic-correlation techniques. The correlation or extension of formation boundaries from the logs of one borehole to the logs of another must be done in a manner that is consistent with the subsurface stratigraphy. In this regard, geophysical logs provide a more accurate and objective location of formation and lithologic boundaries in the Dakota than is possible with a driller's log.
The critical stratigraphic boundaries relevant to the Dakota aquifer are (1) the base of the Cheyenne Sandstone or the Kiowa Formation, (2) the base of the Dakota Formation, and (3) the top of the Dakota Formation. These boundaries define the base of the Dakota aquifer system, the base of the upper Dakota aquifer, and the top of the Dakota aquifer system, respectively (table 1). In some areas, recognition of stratigraphic boundaries is straightforward; however, in other areas the boundaries are not easily located from a driller's log. New information from the Dakota Aquifer Program by the Kansas Geological Survey has provided the most precise information ever available to recognize these boundaries based on available subsurface gamma-ray logs of wells drilled for hydrocarbons and as test holes by the Survey. The Survey is publishing a set of type logs online for each township in central and western Kansas for which suitable logs are available. It will also be possible to output this information on compact disks as desired. Included with the logs in digital form on the Survey web site will be a table containing formation tops of these type logs, including the depth to the tops of the Dakota Formation, Kiowa Formation, Morrison Formation, and the underlying Permian. An understanding of the origin of the stratigraphic boundaries in the Dakota aquifer is useful in their identification on gamma-ray logs. More detailed information on the depositional history of these units and geologic correlation techniques can be found using the reference resource list at the back of this publication in Appendix 3.
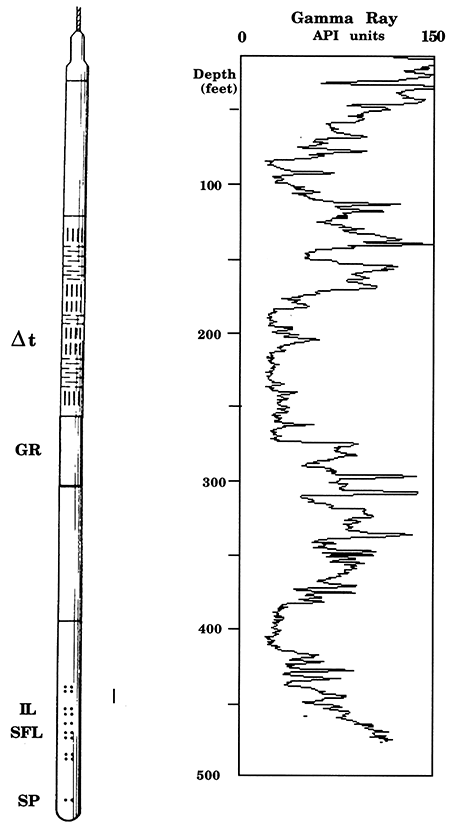
Geophysical log analysis of the Dakota aquifer--Geophysical logs are records of physical properties of rocks in boreholes drilled for hydrocarbons, minerals, or water. Logs are made by electrical, acoustic, and nuclear tools suspended on a wireline and winched up through formations penetrated by the borehole (fig. 24). A logging tool may be about 50 ft (15 m) in length and its measurements are recorded as traces on a graphic chart of deptha "log." Most tools are run by logging service companies for the oil industry in both exploration holes and producing wells. Fortunately, many of the rock properties used to locate and describe oil and gas reservoirs also are useful in the search for aquifer beds with usable water.
Figure 24--Combination logging tool for measuring acoustic travel time (Δt), natural gamma radiation (GR), shallow-focused (SFL) and deep-focused (IL) electrical conductivity, and spontaneous electrical potential (SP) of rock formations in a borehole, together with a typical gamma-ray log of a Dakota aquifer section. The tool shown is 55 ft, 7 inches (16.9 m) long.
The long history of oil exploration in Kansas has resulted in the recording of hundreds of thousands of logs across the state. These are filed with the Kansas Corporation Commission and then archived at both the Kansas Geological Survey in Lawrence and the Kansas Geological Society in Wichita, where copies are available for purchase by the public. The main use of logs is for the identification of the depths of stratigraphic formation boundaries ("tops") and their correlation between wells. The maps of correlated tops are similar in style to topographic maps. However, underground surfaces cannot be seen, but must be estimated between the available well control.
Logs also provide valuable information on the Dakota aquifer because they can be used for
These three applications are explored in more detail in the following pages, where the properties and uses of the common logs are described. All the logs illustrated have been taken from a single well, so that the properties and interrelationships can be understood more easily.
The gamma-ray log: The gamma-ray log is widely used as a record to locate the depth of key stratigraphic formations (fig. 25) and to subdivide the Dakota into units of sandstone and shale (fig. 26). The gamma-ray tool measures natural radioactivity of rocks in a similar way to a Geiger counter. The sources of radiation are almost entirely from isotopes of thorium, uranium, and potassium. Although the radioactivity of most rocks is fairly low, it is sufficient to make a clear distinction between sandstones (low radioactivity) and shales (higher radioactivity) (fig. 26). Older gamma-ray logs are recorded in "counts," the numbers of which vary according to the tool design. Almost all modem gamma-ray logs are recorded in API (American Petroleum Institute) units, which makes a common standard for log comparison. The scale was chosen so that a value of zero would mean no radioactivity and a value of 100 would match a typical midcontinent shale. In practice, shales can be somewhat variable in their radioactivity according to their silt content, types of clay mineral, and the occurrence of small amounts of uranium.
Figure 25--Use of a gamma-ray log for stratigraphic subdivision of the Dakota aquifer in KGS Jones #1, NE NE NE sec. 2, T. 10 S., R. 8 W., Lincoln County, Kansas.
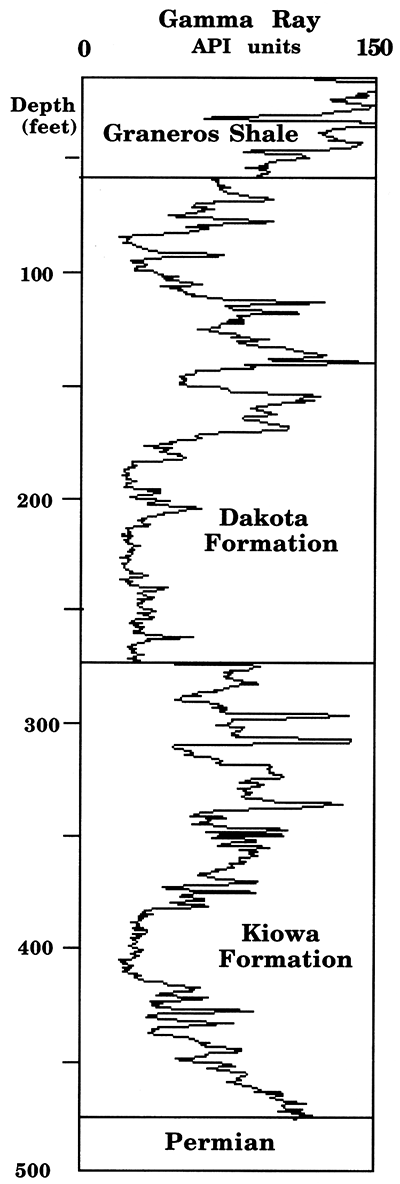
Figure 26--Use of a gamma-ray log to subdivide the Dakota aquifer in KGS Jones #1, NE NE NE sec. 2, T. 10 S., R. 8 W., Lincoln County, Kansas, between sandstone-aquifer zones and shale-aquitard zones through the use of a gamma-ray cut-off value.
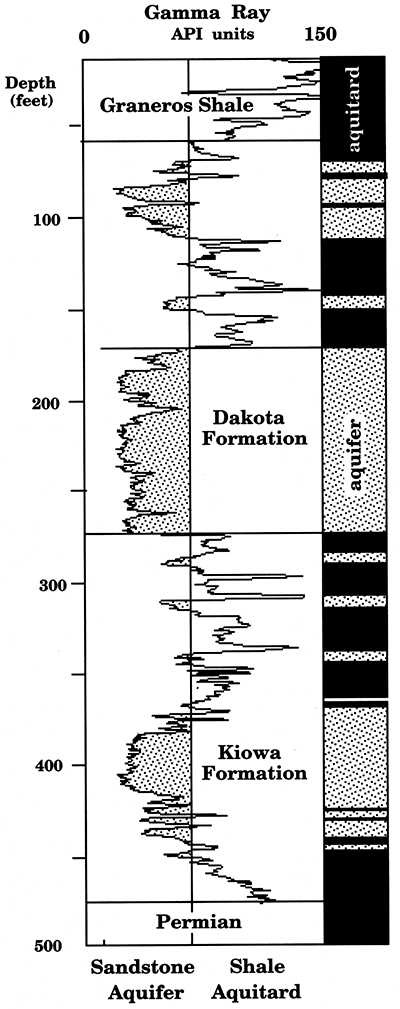
Once the stratigraphic boundaries of the Dakota aquifer are located (fig. 25), the gamma-ray log can be used to mark off depth intervals of sandstones and shales. As a rule-of-thumb, experience has shown that a value of 60 API units is a satisfactory boundary to differentiate sandstones (below 60) and shales (above 60). An example of using this procedure is shown in fig. 26. The subdivision of a Dakota aquifer section into sandstones and shales reveals the structure of aquifer and aquitard layers.
The "porosity" logs: Three types of logging tools are used to estimate the amount of pore space in a rock: the neutron, density, and acoustic velocity (or sonic) tool. Although either one or several of these types of logs are commonly run in oil-exploration holes that penetrate the Dakota, they are not always recorded in the Dakota interval. Commonly, a full suite of logs is recorded in the deeper section, where there is a potential for oil and gas up to the level of the Permian Stone Corral. Above the Stone Corral, a more restricted suite may be run for correlation purposes and typically consists of the gamma-ray, SP, and resistivity logs.
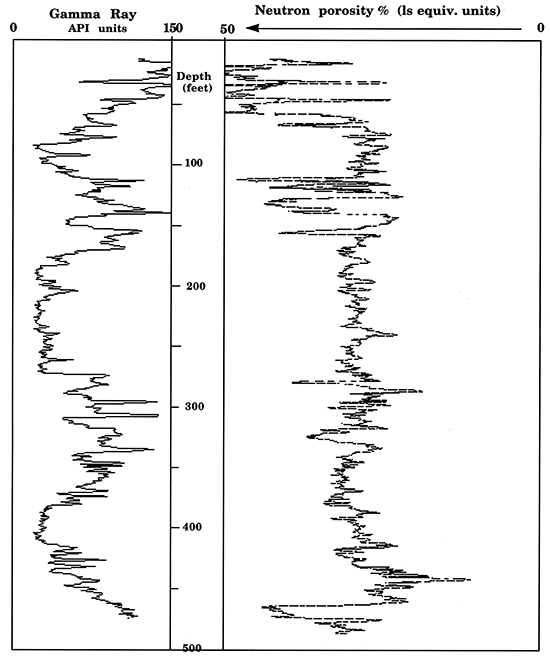
The neutron log records the number of collisions between neutrons that radiate from a tool source and hydrogen atoms within the rock of the borehole wall. So, the log is mainly a measure of hydrogen concentration (mostly contained by the pore fluids of the formation). Older neutron logs are recorded in numbers that require conversion to porosity units either by calibration to units of known porosity within the logged section or by reconciliation with cored samples from the same well. Newer neutron logs are scaled directly in units of porosity (fig. 27). Shales appear to have high porosities on the neutron log, mostly because of bound water, rather than effective porosity. However, porosities recorded in shale-free sandstones are a reasonable estimate of pore spaces containing water that can be produced in a well.
Figure 27--Neutron-porosity log from KGS Jones #1, NE NE NE sec. 2, T. 10 S., R. 8 W., Lincoln County, Kansas. Note that porosity increases from right to left. A "limestone scale" is normally recorded, because oil-exploration targets below the Dakota are usually limestone. Actual porosities in the sandstones will be about 3% higher. The porosity reflects "free" water in the sandstones, but bound water in the shales.
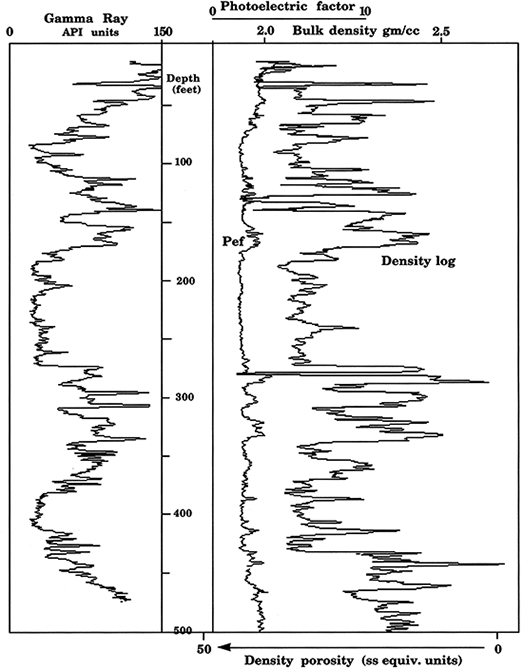
The density log is a measure of apparent density of the rock and is computed from the absorption of gamma rays by the formation upon exposure to a radioactive source. An example of a density log run in the Dakota is shown in fig. 28. The density of quartz is about 2.65 grams per cubic centimeter, and that of water is approximately 1.0. These two values correspond to the density of a sandstone with zero porosity and a hypothetical sandstone with a porosity of 100%. The two limits can be used to convert the density scale to values of equivalent porosity units. On more recent density logs, a supplementary curve of the photoelectric factor also is recorded, and is a useful measure of formation mineralogy.
Figure 28--Density log from KGS Jones #1, NE NE NE sec. 2, T. 10 S., R. 8 W., Lincoln County, Kansas, recorded in grams per cm3 (above) and an equivalent sandstone porosity scale (below). Newer density logs cornmonly have a photoelectric factor curve which is a useful lithology discriminator.
Both the neutron and density logs are commonly recorded on the same logging run and shown as an "overlay" on a common scale of equivalent limestone porosity units (see fig. 29). The overlay allows shales, sandstones, and other lithologies to be distinguished and a better estimate to be made of the true porosity of the formation at any depth. The log overlay has sufficient information to be converted to a profile that graphically shows shale content and volume of effective pore space (fig. 30). Notice that the overall shale composition estimated from the density-neutron log combination is similar to shale indicated by the gamma-ray log, but there are also systematic differences. That is because both measurements are sensitive to shale content, but the gamma-ray log responds to the natural radioactivity of the shale, while the neutron-density logs are influenced by the bound water and density of the shales.
Figure 29--Neutron and density logs from KGS Jones #1, NE NE NE sec. 2, T. 10 S., R. 8 W., lincoln County, Kansas, overlaid on a cornmon equivalent limestone-porosity scale. The overlay allows the log analyst to recognize lithologies and read values of true porosity in zones of interest.
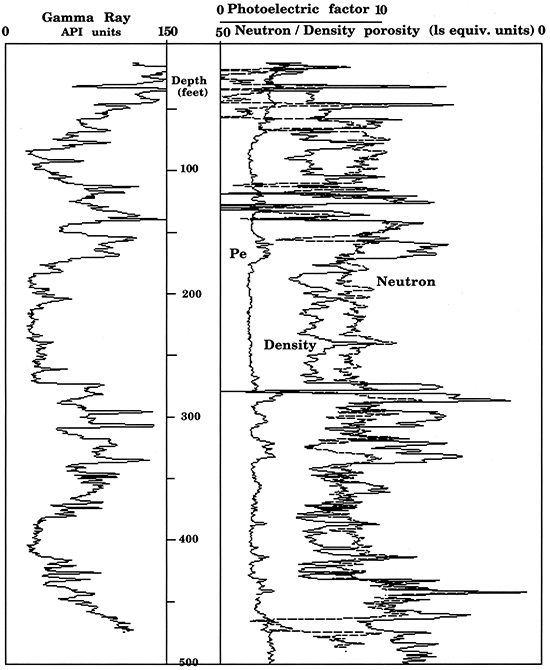
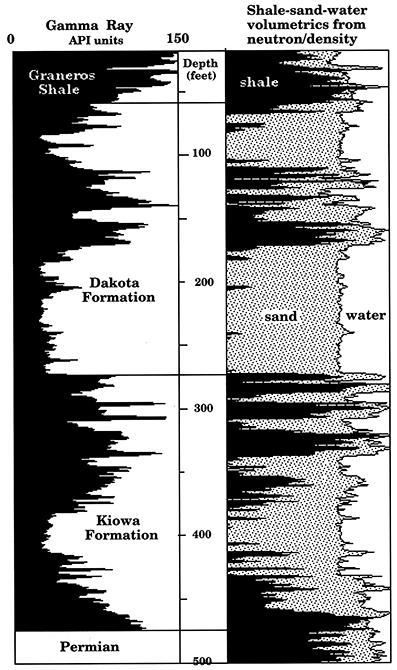
Figure 30--Volumetric summary of shale, quartz, and pore space indicated by gamma-ray and lithodensity-neutron logs from KGS Jones #1, NE NE NE sec. 2, T. 10 S., R. 8 W., Lincoln County, Kansas. Note that shale estimation by the gamma-ray log is based on natural radioactivity and shows slight differences with shales from the lithodensity and neutron logs which are based on shale-bound water and density characteristics.
The third type of porosity estimate is computed from measurements of the speed of ultrasonic sound through the formation. The sonic tool has a mechanical source of compressional energy that radiates sound through the rock formation in the borehole wall. The log records the acoustic velocity of the rocks as a trace that is shown as a continuous function of depth. The log is measured as transit time in units of microseconds per foot. Sound travels faster in rocks with low amounts of contained fluids than those with higher fluid contents. This physical relationship can be used to compute the porosity of a sandstone at any depth, by interpolating the measured value at any depth between the expected value of quartz (55.5 microseconds per foot) and that of water (189 microseconds per foot) as extremes of a porosity scale of zero to 100% porosity.
The spontaneous potential (SP) log: The spontaneous potential tool measures natural electrical potentials that occur in boreholes and generally distinguishes porous, permeable sandstones from intervening shales. The "natural battery" is caused when the use of drilling mud with a different salinity from the formation waters causes two solutions with different ion concentrations to be in contact. Ions diffuse from the more concentrated solution (typically formation water) to the more dilute. The ion flow constitutes electrical current, which generates a small natural potential measured by the SP tool in millivolts.
When the salinities of mud filtrate and formation water are the same, the potential is zero and the SP log should be a featureless line. With a fresher mud filtrate (and thus, more saline formation water), a sandstone will show a deflection in a negative potential direction (to the left) from a "shale base line" (fig. 31). The amount of the deflection is controlled by the salinity contrast between the mud filtrate and the formation water. Clean (shale-free) sandstone units with the same water salinity should show a common value, the "sand line." In practice, drift will occur with depth because of the changing salinity of formation waters. The displacement on the log between the shale and sand lines is the "static self-potential" (SSP).
Figure 31--Spontaneous potential (sp) and gamma-ray log from KGS Jones #1, NE NE NE sec. 2, T. 10 S., R. 8 W, Lincoln County, Kansas. Although they record different physical properties, the two logs are comparable because of their sensitivities to shale and so both can be used to differentiate between sandstones and shales. The stronger sandstone differentiation at greater depths on the SP log is caused by greater salinities in the deeper sandstones.
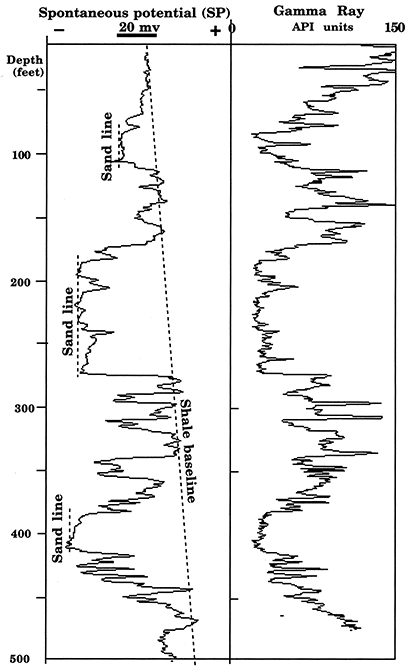
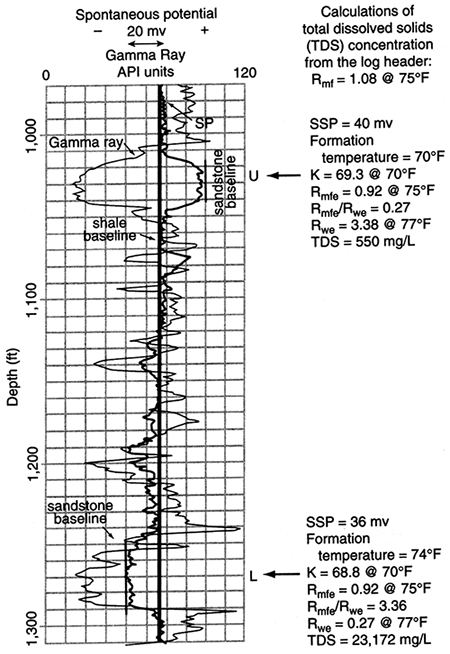
The SP log in fig. 31 is an example taken from a shallow section of the Dakota. Notice how the shale baseline shows a distinctive drift with depth. This characteristic is commonly observed in shallow sections and may be caused by increases in relative oxidation of the rocks that are close to the land surface. The highest sandstone in the well has a muted deflection on the SP log as compared with the lower sandstones. This contrast is an immediate indication that water in the upper sandstone may be significantly fresher than waters of the lower sandstone. In other wells it is not uncommon to see sandstone units where the SP deflection goes to the right of the shale baseline. In these instances, the drilling mud filtrate is saltier than the formation water. A good example of this phenomenon is shown in fig. 32 from a well in northwest Kansas. In the upper sandstone, "U," the SP log shows a deflection to the right, indicating formation water to be fresher than the drilling mud, while in the lower sandstone, "L," the deflection is to the left, showing the formation water to be more saline.
Figure 32--Spontaneous potential (SP) and gamma-ray logs of the upper Dakota from Cities Service Montgomery #2, center NE NW sec. 7, T. 8 S., R. 23 W., Gorham County, Kansas. Note the SP deflects to the right in the upper sandstone (U) but to the left in the lower sandstone (L). This "reversal" occurs because the formation water in the upper sandstone is fresher than the drilling mud, but saltier than the drilling in the lower sandstone. The calculations of total dissolved solids (TDS) concentration (mg/L) in the two sandstones were made using the flow chart in fig. 33 and the correction chart in fig. 34. See Boeken (1995) listed in Appendix 3 for more details.
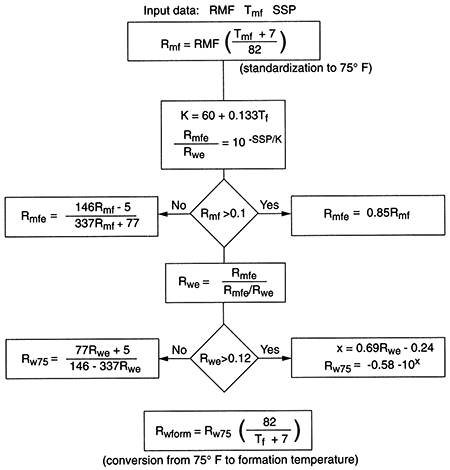
The conductivity of the drilling-mud filtrate is measured by engineers at the well-site and recorded on the "header" of the log. This information combined with the SSP "battery effect" shown on the log can be used to estimate the conductivity of the formation water. The calculation is made commonly by petroleum-log analysts as an important variable in the search for potential oil or gas zones (see fig. 33). When used to evaluate the quality of aquifer waters, care must be taken to ensure realistic conclusions. Although formation-water compositions at greater depths tend to be mostly sodium and chloride (monovalent ions), the divalent ions of calcium, magnesium, bicarbonate, and sulfate become more important in shallow, fresher aquifer waters. As a result, the equations used by petroleum-log analysts are only approximate and must be adjusted to consider the ionic mix of the local aquifer water. In general, the divalent ions of shallow waters tend to make them appear slightly more saline than they actually are when computed from the SP log.
Figure 33--Flow chart from oil-industry log analysis to estimate formation-water resistivity, Rw, in deep formations from the SP log (Bateman and Konen, 1977). RMF is mud-filtrate resistivity measured at temperature Trnf and recorded on the log header; Tf is the temperature of the formation, generally estimated by interpolating between the bottom-hole temperature (BHT) at total depth (TD) and mean annual temperature at the surface; SSP is the static self-potential measured on the log between the "clean line" and "shale line" in millivolts (mv) AND with associated sign (positive or negative).
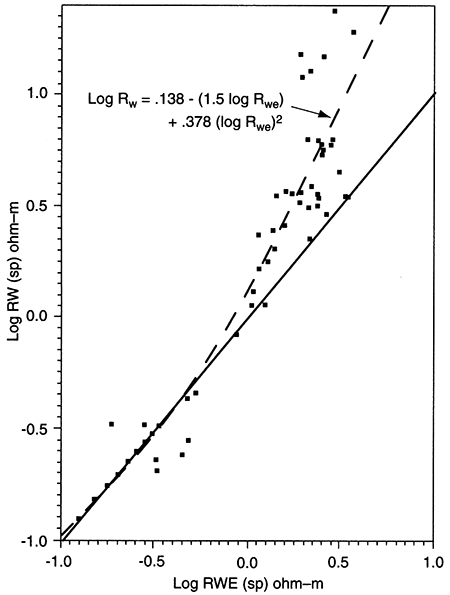
An empirical chart was developed as part of the research in the Dakota to correct apparent water resistivities calculated from standard equations to estimates of real resistivities measured in Dakota aquifer water samples (fig. 34). The corrected resistivities were then transformed to estimates of total dissolved solids concentrations. The method is particularly useful in Dakota aquifer studies because it allows water-quality studies to be extended beyond wells from which Dakota water samples were taken to wells that were unsampled but logged with an SP device. This procedure was used to estimate the TDS concentrations in the upper Dakota aquifer in northwest Kansas (fig. 16).
Figure 34--Custom-designed chart and function to convert apparent water resistivity (Rwe) calculated from oil-industry algorithms to actual resistivity (Rw) of Dakota aquifer waters. The correction is necessary because Rwe is calculated with the assumption that the dissolved solids in the water are from a single salt; actual Rw's will be controlled by the ionic mix of natural waters, and discrepancies with Rwe will be particularly noticeable in the relatively fresher waters of shallow formations. From Boeken (1995).
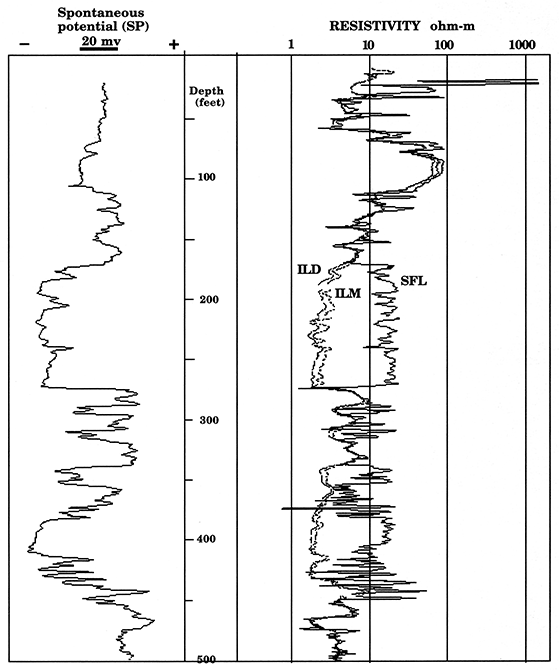
The resistivity log: Resistivity logs measure the ability of rocks to conduct electrical current and are scaled in units of ohm-meters. There are many resistivity-tool designs, but a major difference between them lies in their "depth of investigation" (how far does the measurement extend beyond the borehole wall?) and their "vertical resolution" (what is the thinnest bed that can be seen?). These characteristics become important because of the process of formation "invasion" that occurs at the time of drilling. In addition to its other functions, drilling mud forms a mudcake seal on the borehole wall of permeable formations. However, in doing this, some mud filtrate penetrates the formation, displacing formation water. This is called "invasion." The replacement of formation water by mud filtrate involves a change of pore-water resistivity.
The difference between the resistivity-log measurements and the invasion process can be seen on fig. 35, where separation between the curves can be seen in the more porous and permeable sandstones, but minimal separation is seen in the shales, which are effectively impermeable. From a hydrologic perspective, the multiple-resistivity curves are therefore excellent discriminators of aquifer and aquitard units. The mud used in the example well was less saline than formation waters in the deeper units, as is common in many drilling operations. The shallowest reading resistivity device (in this case, the spherically focused log) therefore records the highest resistivity because it responds mostly to the formation being invaded by the higher-resistivity mud filtrate. The two induction logs draw their responses from deeper in the formation, so that the deep induction log (ILD) probably records a reading close to the true resistivity of the undisturbed formation. Notice that the resistivities in the uppermost sandstone (depth, 100 ft [30 m]) are less separated than those in the lower sandstones. As observed already, the dampened deflection of this sandstone on the SP log shows that its contained water is only slightly more saline than the drilling mud and much less saline than the lower sandstones. Therefore, invading mud filtrate is only slightly fresher than the formation water, so that invasion effects on the resistivity logs are masked.
Figure 35--Spontaneous potential (SP), spherically focused (SFL), medium- (ILM) and deep- (ILD) induction resistivity logs from KGS Jones #1, NE NE NE sec. 2, T. 10 S., R. 8 W., Lincoln County, Kansas.
The sensitivity of resistivity logs to water salinity can be used in an alternative method to SP-Iog estimates of water quality. In a sandstone-shale sequence, resistivity variation is controlled by a variety of phenomena, including cation-exchange mechanisms of clay minerals within the shalier zones, conduction by metallic minerals, and the dissolved ions within the pore water of the sandstones. However, formation water resistivity may be calculated in shale-free sandstone zones that are logged by resistivity and porosity tools. The water resistivity (Rw) is calculated from the resistivity and porosity log readings by the Archie equation that incorporates a "cementation factor" (m), expressing the tortuosity of the pore network as a modifier to the fractional volume of pore space (Φ):
Rw = RoΦm, (eqn. 3)
where Ro is the resistivity reading of the zone when it is completely saturated with water whose resistivity is Rw. The method is widely used by log analysts in the oil industry and generally gives good estimates of water resistivity in deeper (more saline) formation waters. Results are less reliable in aquifers because of claymineral effects as well as surface conduction on quartzgrain surfaces.
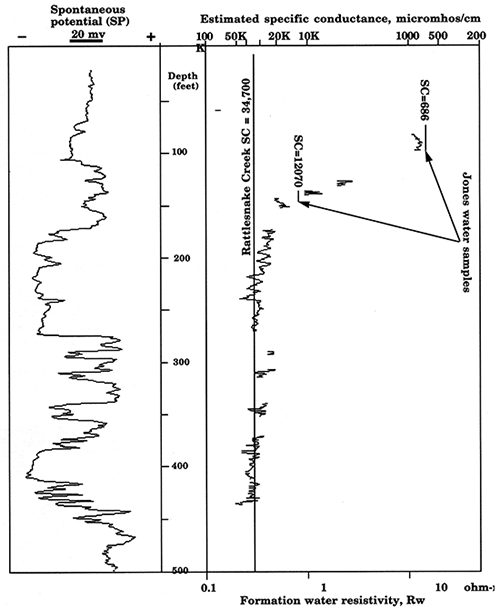
A water-resistivity/specific-conductance curve was computed for the Dakota aquifer in the Jones well using the Archie equation with a cementation exponent (m) of 1.6 (an appropriate value for a slightly cemented sandstone). The water-resistivity curve is shown in fig. 36 and is indexed with two water-sample measurements and a reference value for a low-flow sample of water from Rattlesnake Creek, in a valley in northern Lincoln County near the Jones well in NE NE NE sec 2, T. 10 S., R. 8 W. The saltwater sample from Rattlesnake Creek is believed to be a good representative of the saltwater discharging from the lower stratigraphic interval of the Jones well into the creek bottom. The curve is shown only for zones of sandstone that are relatively low in clay content as indicated by the gamma-ray log. The estimated specificconductance trace is a highly acceptable match with sample measurements and appears to show a transition zone between the fresher water of the upper sandstone and the more saline waters of the lower sandstones.
Figure 36--Spontaneous potential (SP) log and profile of specific conductance of formation water estimated from resistivity and porosity logs in KGS Jones #1, NE NE NE sec. 2, T. 10 S., R. 8 W., Lincoln County, Kansas. Note match between profile and conductances measured from well-water samples.
Again, it must be emphasized that log estimates of water quality should only be used (and then with caution) where no samples are available for direct analysis. In each case, the log property is an indirect measure, because it records a physically dependent property, rather than water salinity itself. In addition, rock properties other than water salinity may contribute to overall conductivity effects. The accuracy of the estimates degrades as water salinity decreases, generally overpredicting salinity in fresher waters. However, when used judiciously with water-chemical measurements, log-data estimates are valuable in extending knowledge of Dakota aquifer water quality over larger geographic areas and greater depth ranges.
Pumping of test holes--When suitable aquifer zones have been located through test-hole drilling, a temporary casing and well screen may be installed, creating a test well. The test well can then be pumped to obtain preliminary estimates of well yield, water quality, and aquifer characteristics. Final site selection and well design are determined on the basis of these preliminary tests and an analysis of the cuttings produced from drilling the borehole.
Well yields in the Dakota aquifer of Kansas range widely from less than 25 up to more than 750 gal/min (95-2,850 L/min). The highest reported yields come from near the central Kansas outcrop belt. Lobmeyer and Weakly (1979) reported well yields up to more than 1,000 gal/min (3,800 L/min) for wells in the Dakota of Hodgeman and northern Ford counties. Wade (1991) reported the results of a pumping test on a well used for crop irrigation in a part of southwestern Washington County where highcapacity wells in the Dakota are common. The rate of production during the test was approximately 592 gal/min (2,250 L/min). Watts (1989) reported the results of a pumping test on a Dakota well near Garden City. For the duration of the test, the production rate was more than 1,000 gal/min (3,800 L/min). To the north in Ellis County, pairs of wells in the Dakota installed by the City of Hays were pumped at a rate of 75 gal/min (285 L/min) during the summer of 1994. Farther west, wells in the Dakota are primarily for low-demand domestic and stock use. These wells yield up to 100 gal/min (380 L/min) in some cases.
Well yield is partly a function of the aquifer's ability to produce water. For the Dakota aquifer, the most important factors governing this ability are the total thickness and hydraulic conductivity (transmissivity) of the sandstone. In general, the greater the accumulated thickness of sandstone adjacent to the well screen, the greater the yield because more of the aquifer is available to the well for water production. The hydraulic conductivity of a material is a measure of its resistance to flow. The larger the value, the easier it is for the well to produce water. From the set of pumping-test results available for the Dakota, the aquifer appears to be much more permeable near the central Kansas outcrop belt than in western Kansas. This generally coincides with the area of the state where highyielding wells in the Dakota are more common. However, even in this part of the state, the Dakota is less permeable than the High Plains aquifer.
Another important factor is the aquifer extent in the vicinity of the well. The aquifer extent refers here not only to size and shape of the individual sandstone body adjacent to the screened well, but also to the degree of interconnection with other nearby sandstone bodies. In general, the greater the net thickness of sandstone adjacent to the well screen, the greater the likelihood of the well penetrating one or more sandstone bodies that are part of a network of aquifer units. Tapping into the network of hydraulically connected sandstones helps to ensure that well yield will be maintained over the long term.
Figure 16 can be used as a general guide as to whether the waters in the upper part of the Dakota aquifer at a given location will be fresh or saline. The great range in TDS concentration that can be encountered in the Dakota aquifer shows the need for careful monitoring of salinity during test drilling in those areas near or within regions of saline water, especially if deeper wells are drilled. The specific conductance of a water is a very easy measurement to make; relatively inexpensive, hand-held meters are now available for determining conductances of sufficient accuracy for salinity estimation. The specific-conductance reading in µmho/cm or µS/cm can be multiplied by 0.63 for an estimate of the TDS in mg/L (nearly the same as ppm) of most Dakota aquifer waters. Freshwaters are classified as containing less than 1,000 mg/L. Field tests of chloride concentration can also be made in the field with simple test kits.
Monitoring of salinity during drilling could be particularly valuable when passing below shale units into lower sandstones in areas of potential salinity. The wide range in the rate of salinity increase with depth, for example in fig. 19, shows that waters of acceptable quality in an upper sandstone may lie above a sandstone with saline water. Frequent measurement of the conductance of drilling fluids could aid in early determination of how deep the zone of usable water extends. The presence of drilling mud will somewhat affect the conductance reading of the water. Thus, measurement of the difference in specific conductance between the drilling water before and after drilling mud or rock cuttings are mixed is useful for approximate adjustment of readings to values representative of the true conductance of the aquifer water.
Water samples should be collected from the test hole and submitted for analysis in a chemical laboratory. If the waters are to be used for drinking, the analysis should be examined for constituent concentrations relative to recommended levels and maximum contaminant limits (MCL). Some of the contaminant limits are listed in table 2; the complete list is available from the Kansas Department of Health and Environment. In addition to major constituents contributing to the salinity of the water, fluoride, iron, and manganese contents of the water may be of particular interest because they are often high in the confined portion of the upper Dakota aquifer as indicated in the previous section on water quality, Hydrogen sulfide may be present in ground waters in some locations, particularly in the confined aquifer; the dissolved gas will be apparent as a "rotten egg" odor. Natural contents of nitrate and heavy metals are nearly always below MCL's in uncontaminated Dakota waters, although nitrate contamination might be present in shallow waters in the outcrop zone. Consideration should be given to determining the presence of arsenic, mercury, and lead in an assessment for drinking-water use because these have been observed to be somewhat above MCL's in a very few locations. However, the observed lead values may be related to the presence of lead solder in the piping or electrical systems, and care must be taken to avoid these materials in test and constructed wells and distribution systems. Waters in the confined aquifer can be corrosive due to higher dissolved solids contents and dissolved hydrogen sulfide. The sodium bicarbonate waters in the confined aquifer have high sodium-adsorption ratios and should be used carefully as irrigation waters to prevent reduction of soil permeability.
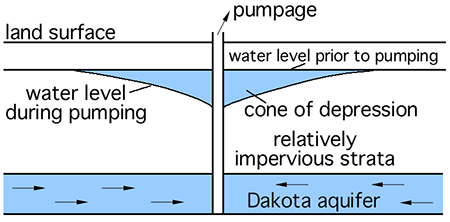
Ground water from the surrounding aquifer must move toward the well for it to produce; this happens when the pump is turned on. As water is removed from the well by pumping, the hydraulic head in the well and in the aquifer adjacent to the well screen is decreased. This causes ground water in the aquifer to move laterally toward the well. The drawdown is the decline of water level (or hydraulic head) observed in wells screened in the aquifer being pumped. Under ideal conditions of a relatively uniform regional aquifer, such as the High Plains aquifer, the area experiencing drawdown around the pumping well is nearly circular in plan view. The amount of drawdown is a maximum at the pumping well and diminishes to zero some distance away. The region affected by drawdown from pumping is referred to as the cone of depression (fig. 37). The size of the cone of depression and the drawdown will increase until there is a balance between the pumping rate and the flow in the aquifer moving radially toward the well from all directions. If the rate of water production greatly exceeds the radial flow moving toward the well, the cone of depression will grow continuously and the aquifer around the well will eventually be depleted. The movement of water toward the well is governed by the aquifer permeability and thickness.
Figure 37--The cone of depression that results from pumping water from a confined aquifer. Pumping decreases the fluid pressure in the confined aquifer, thereby also decreasing the hydraulic head in the aquifer.
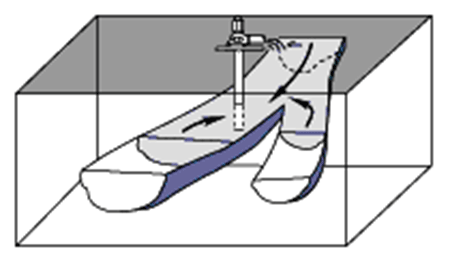
As discussed earlier, the Dakota is not a uniform regional aquifer; it consists of hydraulically connected and isolated permeable sandstone bodies that are finite in size and encased in relatively impervious mudstone. Because the mudstones effectively do not yield water, the edges of these sandstone bodies are hydrologic barriers to flow depending on the rate and duration of pumping. This reduces the rate of recharge moving laterally toward the developing cone of depression or zone of influence. As a result, the zone of influence can extend out from the well along the length of these elongated sandstone bodies for several miles or more and may extend into other hydraulically connected sandstone bodies. However, in the direction perpendicular to the long axis of the sandstone body, this zone may only extend to the edge of the aquifer. In some cases this may be less than a mile away (fig. 38). These boundaries affect the well by accelerating the rate of drawdown with time. The lower water levels may necessitate lowering the pump in the well, which increases energy costs associated with water production.
Figure 38--Ground-water flow to a pumping well in a river-deposited sandstone aquifer. Ground-water flow follows the axis of the channel. The effects of ground-water withdrawals may be felt a long distance from the pumping, depending on the geometry of the sandstone body and its hydraulic diffusivity.
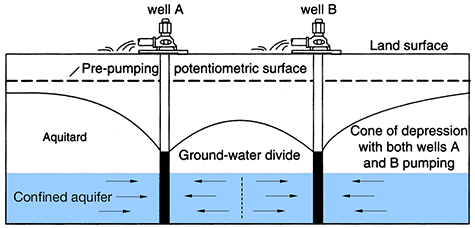
If two pumping wells in the Dakota aquifer are spaced even a few miles apart and are withdrawing water from the same sandstone body, their zones of influence will likely overlap and coalesce (fig. 39). When this occurs, the total recharge moving laterally into each well's zone of influence from the adjacent aquifer is reduced, creating an impairment. Impairment results when one well diminishes the supply of water available to another nearby well. The immediate impact of this impairment is to increase the drawdown in both wells. If both wells continue pumping for longer periods of time, it may cause local depletion of the aquifer. This is most likely to happen where the pumping wells are located far away from sources of recharge or a discharge area.
Figure 39--The mutual interference developed from wells spaced too closely together in a confined aquifer. Note how the drawdown in the coalescing cones of depression is greater than for the drawdown produced by a single pumping well.
The pumping effect on hydraulic head is transmitted through an aquifer much faster than the actual movement of water. However, pumping does move water and can induce the movement of saline water in the aquifer into a supply well. Figure 19 shows the great increase in salinity at the bottom of a sandstone into the underlying shale. Water withdrawn from a well will be preferentially derived laterally from the most permeable layers in a sandstone. Some water also may be derived vertically as leakage from overlying units. However, if pumping occurs at a great enough rate or over a long enough period of time, the stress may be sufficient to cause upward movement of saline water from the bottom of a sandstone below which there is a great salinity increase. Pumping stress can also move water laterally from near the edge of sandstone bodies where water in the confined aquifer can be more saline in finer-grained sediments. In addition, long-term pumping near lateral zones of freshwater to saltwater transition could obtain higher-salinity water from the transition zone. Decreasing the rate of withdrawal could decrease the amount of saline water drawn from below and laterally if leakage from above the sandstone is relatively important. However, upconing and lateral movement of salinity from nearby sandstone boundaries and saltwatertransition zones could eventually cause slow increases in TDS concentrations if the leakage rate from above is relatively low.
The Chief Engineer, Division of Water Resources (DWR), and the groundwater management districts (GMDs) have each formulated regulations that address the minimum spacing between pumping wells in the Dakota. The purpose of well-spacing requirements is to ensure that there is no direct impairment between wells using the Dakota as a source of supply. The regulations take into account either the rate of withdrawal or the local hydrogeologic setting or both. The DWR well-spacing for the Dakota where the Dakota is confined by the Upper Cretaceous aquitard is 4 mi (6.4 km) for all wells other than domestic, and 0.5 mi (0.8 km) for domestic wells because the local recharge to the Dakota is negligible. Where the Dakota aquifer is at the surface or is beneath the alluvial valley or High Plains aquifer, the new well spacing is 0.5 mi (0.8 km) for all wells other than domestic and 1,320 ft (0.25 mi [0.4 km]) for domestic wells. Computer simulations indicate that there is sufficient local recharge to the aquifer from infiltrating precipitation or from overlying shallow aquifers to justify the smaller well spacing. In Great Bend GMD 5, West-central Kansas GMD 1, and Northwest Kansas GMD 4, the spacing between Dakota wells other than domestic is 1 mi (1.6 km).
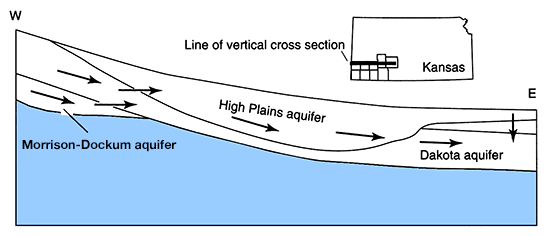
In Southwest Kansas GMD 3, the hydrogeology and use of the Dakota are sufficiently diverse across the District that a variable well spacing is appropriate. Figure 40 shows the generalized hydrogeology of the District in cross section. Beneath the unconsolidated High Plains aquifer, the bedrock units are slightly tilted to the north. In the northern part of the District, the Upper Cretaceous aquitard is present and the Dakota and High Plains aquifers are separate systems. In the southern part of the District where the Upper Cretaceous aquitard is not present, the Dakota thins to the south due to erosion and is hydraulically connected to the overlying High Plains aquifer. As a result, the boundary separating the High Plains from the Dakota is an irregular surface. Within this part, the upper Dakota aquifer is not present near the southern extent of the Dakota aquifer system. In this part of the District, the Kiowa Shale aquitard provides a local separation between the lower Dakota and the High Plains aquifers, or the lower Dakota is hydraulically connected to the overlying High Plains aquifer. Where both aquifer systems are hydraulically connected, the spacing for wells in the Dakota withdrawing more than 500 acre-ft/yr is 2,300 ft (690 m), the same as it is for High Plains aquifer wells. Wells withdrawing less water can be placed more closely together.
Figure 40--Ground-water flow in the Dakota, Morrison-Dockum, and High Plains aquifers in southwestern Kansas.
The major ground-water management issue that will affect the long-term viability of the Dakota as a major resource is its sustainability under development. As it is defined here, sustainability is the ability of the aquifer to supply water to users without being depleted during the planning period. As a practical matter, we arbitrarily set the planning horizon to be 20 years.
Sustainability implies the attainment of a new dynamic equilibrium under conditions of widespread development. For equilibrium to occur, withdrawals from the aquifer must either induce additional recharge to the aquifer, reduce discharge from the aquifer, or both. This occurs by increasing the hydraulic gradient in the aquifer when the hydraulic head within the aquifer is decreased. These decreases will continue until changes in recharge and discharge balance withdrawals from the aquifer. The most direct evidence of this new balance is long-term stability of hydraulic heads in the aquifer. The sustained yield depends on the rate at which the hydraulic-head decreases propagate through the aquifer to the recharge or discharge area. The closer the pumping centers are placed to either the recharge or discharge areas, the more likely it is that additional recharge or reduced discharge can be realized by withdrawals. The rate of propagation is a function of aquifer diffusivity (the ratio of the hydraulic conductivity to the specific storage). The higher the diffusivity, the faster the rate of propagation of the cone of depression. It is likely that pumping centers located farther away from either the recharge or the discharge areas will influence the amount of recharge to and discharge from the aquifer only if the diffusivity is high.
Water budgets are useful for examining the flow of water between the various compartments within the hydrologic cycle or a ground-water-flow system. Under predevelopment conditions within an aquifer, there is a dynamic equilibrium between recharge and the discharge or outflow from an aquifer (fig. 41A). Water also is in storage within the pores of the aquifer framework, and under these conditions, the total volume in storage remains relatively constant.
Figure 41--Changes in the water budget of a confined aquifer caused by water-resources development. The dashed line represents the trace of the potentiometric surface in the cross section. Under the steady-state, predevelopment phase, recharge (R) is balanced by discharge (D) from the aquifer with no change in storage. In the early stages of development, the water produced by wells comes entirely from storage. Once the potentiometric surface has been lowered sufficiently to increase the hydraulic gradient near the recharge or discharge area, additional recharge (r) or reduced discharge (d) or both may occur, generating capture. In this later stage of development, the water produced by wells comes entirely from capture, and there is no further loss of storage; a new equilibrium condition is created. The time required to generate significant capture depends on the diffusivity (the ratio of hydraulic conductivity to specific storage) of the aquifer.
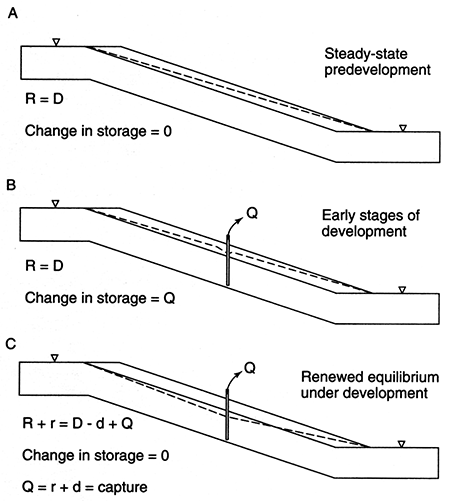
With the introduction of pumping wells, the volume of water in each of these three categories changes depending on the location of the pumping wells in the aquifer with respect to sources of recharge and discharge, rates of withdrawal, and aquifer hydraulic diffusivity. All the water withdrawn by a pumping well in a confined aquifer comes either from storage or capture (fig. 41B). Initially, all the water produced by the well comes from storage in the aquifer adjacent to the well. As the well continues to pump, more and more of the aquifer experiences waterlevel declines. The higher the hydraulic diffusivity, the faster these water-level declines propagate through the aquifer system. Given enough time, these declines will propagate to either the recharge or the discharge area, or both, producing "capture" (fig. 41C). When this happens, additional recharge enters or discharge from the aquifer system is decreased, resulting in an additional source of water added to the aquifer to balance the withdrawal. Capture is the sum of the increase in recharge and the decrease in discharge that results from pumping. As the well continues to pump, more and more of the water produced by the well is replaced by capture. The additional recharge coming from the recharge area may result from reduced local discharge to streams in the recharge area or from another hydraulically connnected aquifer. The generation of capture by pumping does not create any "new" water but is merely a reallocation of the amounts in the total hydrologic budget for a region. All other things being equal, the proportion of the capture that comes from added recharge or decreased discharge will depend on whether the well is located closer to the source of the recharge or the discharge area. Eventually, a new dynamic equilibrium occurs when the amount of water withdrawn is balanced by capture. At this point, the hydraulic heads in the aquifer approach stability at levels that are lower than they were during predevelopment (fig. 42).
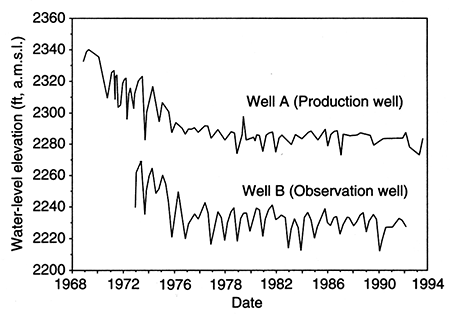
Figure 42--Hydrographs of a production well and an observation well in the upper Dakota aquifer of Ford County, Kansas. The wells are approximately 6 mi (9.6 km) apart. Water-level declines during the early phase of development induce flow into the Dakota aquifer from the High Plains aquifer, eventually creating a new equilibrium within the aquifer.
In the confined part of the Dakota aquifer, the effects of development will be pronounced. The distance from recharge to discharge areas is up to several hundred miles away in the Dakota in northwest Kansas. If the production wells are more than approximately 20 mi (32 km) away from sources of recharge or discharge, the generation of capture is unlikely within a 20-year time frame. Even where the High Plains aquifer is present, significant amounts of additional freshwater recharge to the confined Dakota are unlikely because of the low vertical hydraulic conductivity and thickness of the overlying aquitard. Hence, all the water withdrawn from the aquifer will come from storage. Meaningful management plans in this part of the system should be premised on an acceptable rate of water-level decline within the planning period and not on the premise of sustained yield.
Depletion of the confined aquifer is likely if production wells are spaced too closely together and the rates of withdrawal from the aquifer are unregulated. Computer simulations to assess the effects of pumping have demonstrated that in the confined upper Dakota aquifer, coalescing cones of depression from multiple pumping wells spaced from 1 to 4 mi (1.6-6.4 km) apart form quickly after pumping begins. After 10 years, larger drawdowns than would be expected from a single pumping well are produced and a much larger area of the aquifer is affected by the withdrawals. Taking into account the heterogeneity of the Dakota, a well spacing of 20 mi (32 km) in an eastwest direction and 5 mi (8 km) in a north-south direction is recommended to avoid mutual interference problems. A 20-mi (32-km) spacing between well fields with multiple wells also is recommended where only one or two wells are pumped at a time.
The steps taken to prevent depletion clearly depend on the total intensity of development. At low intensities (average spacing of major centers of withdrawal of 20 mi [32 km] or more), well spacing and control of pumping rates should be adequate. Under higher-intensity development, prevention of depletion is only possible by maintaining the points of withdrawal in proximity to sources of recharge or the discharge areas from the aquifer, if capture from these sources is allowed in the management scheme.
Where wells are located within the confined part of the aquifer and a few miles from the confined-unconfined boundary, the loss of storage will continue until the cone of depression, due to pumping, reaches a source of recharge, such as an overlying aquifer. At this point, additional recharge will be induced to enter the unconfined Dakota and the loss of water from storage will diminish and water levels in the aquifer will begin to stabilize. The time it will take to attain this new equilibrium depends on the distance from the source of recharge or discharge and the properties of the aquifer. In the more permeable part of the aquifer, this may take up to 10 years or more to accomplish. Management on the basis of sustained yield may be more realistic in this part of the confined system.
However, not all of the consequences of managing these systems on the basis of sustained yield are necessarily positive. The generation of capture may create saltwater-intrusion problems if the points of withdrawal from the aquifer are located too closely to water-quality transitions, or sources of saltwater recharge, as in the case of the Dakota aquifer in central and northwest Kansas.
From an overall management perspective, capture may not be beneficial if the additional recharge moving into the confined aquifer is coming from an already overappropriated, hydraulically connected aquifer system such as the High Plains. In the 1970's, Southwest Kansas GMD 3 declared that high-capacity wells (withdrawal rates of greater than 100 acre-ft/yr) in the confined Dakota aquifer could not be located closer than 5 mi (8 km) from the confined/unconfined boundary of the Dakota within the district. Wells pumping at lower rates can be located closer to the confined/unconfined boundary. The purpose of this regulation is to prevent induced recharge to the confined aquifer from the hydraulically connected High PlainslDakota aquifer system by pumpage in the confined part of the Dakota.
Where the Dakota is unconfined, the effects of development will be less dramatic than in the confined part of the aquifer because pumping will be located near local recharge and discharge areas where the aquifers are more permeable. In the outcrop areas, local recharge areas for the Dakota coincide with the upland areas and are near the drainage divides, and local discharge zones are along the drainage network. The distance from local recharge to local discharge areas is relatively short (on the order of a few tens of miles or less). As a result, the potential for a well to generate capture and produce a new dynamic equilibrium is very much enhanced. The high probability of occurrence of sandstones with higher than average hydraulic conductivity in the outcrop belt indicates that capture can be quickly generated by pumping. This will most likely result by reduction in discharge from the aquifer to streams in central Kansas and to the High Plains and Arkansas River alluvial aquifer in parts of Stanton, Morton, and Hamilton counties. The long-term hydrographs of high-capacity wells tapping ground-water supplies in this part of the aquifer do not show a pattern of decline.
In much of southwestern Kansas, the Dakota is hydraulically connected to the overlying High Plains aquifer. Computer simulations demonstrate that capture is produced in the Dakota due to an increase in downward leakage from the High Plains aquifer and reduced downgradient flow of water to the east. The model results also show that the High Plains-Dakota aquifer system is sensitive to the nature of the coupling between both aquifers. This suggests that the proportion of increased leakage to capture generated by pumpage also depends on this coupling. Hence, the more hydraulically connected the Dakota is to the High Plains aquifer, the more easily leakage (or flow) will transfer from one aquifer to the other in response to pumping.
Protection from surface sources of contamination--Most of the contamination observed in Dakota aquifer waters involves elevated concentrations of nitrate and other constituents associated with nitrate sources. Nitrate occurs naturally at low concentrations (usually below a couple mg/L) in Dakota ground waters. High nitrate concentrations are derived from anthropogenic sources and are generally local. The number of wells yielding high nitrate content is appreciably greater in the eastern outcrop area than in the confined aquifer and the subcrop area overlain by the High Plains aquifer.
Although some infiltration of surface sources of nitrate could pass through soils and rock to reach shallow water tables in the outcrop area, most of the nitrate contamination of Dakota ground waters is probably related to old or poor well construction. Most of the wells in the outcrop and subcrop area are used for domestic and stock purposes. Many of the wells yielding water with elevated nitrate were installed before the State required construction methods that increased protection from surface contamination. Irrigation wells and newer domestic and stock wells tend to yield water with substantially lower nitrate concentrations in the outcrop area. Older wells were constructed without adequately thick surface seals around the well casing; this can allow surface or near-surface drainage to enter well water in the borehole along the outside of the casing (pipe lining the borehole). Another avenue of contamination is through unplugged, abandoned wells, especially those that were poorly constructed or have deteriorated. Several older wells in the confined Dakota aquifer near the eastern outcrop/subcrop belt yield waters with high nitrate content, definitely indicating well construction or abandoned, unplugged wells as the problem, because recharge could not penetrate to the confined Dakota aquifer in the time since settlement of the area. Newer well-construction methods, well rehabilitation, and active programs to plug old abandoned wells are an important approach to protecting the aquifer from surface contamination.
The sources of the high nitrate at the surface are primarily animal and human wastes and fertilizer, although oxidation of nitrogen in soil organic matter can contribute as well. Domestic and stock wells in rural areas are often in or near barnyards and may be relatively close to septic tanks and drainage lines. Domestic wells in towns can also be close to human-waste discharges and lawn and garden chemicals and could be susceptible to contamination if not properly constructed or if close to abandoned, unplugged wells. Other inorganic constituents associated with high nitrate concentrations, in order of average decreasing importance, are chloride, calcium, sodium, and magnesium. Thus, ground waters in the Dakota aquifer with nitrate contamination usually have elevated TDS content. Other chemicals associated with agricultural activities and lawn maintenance such as pesticides, and organic compounds used in commerce such as degreasing solvents could accompany inorganic constituents in water draining through poorly constructed or deteriorated used and unused water wells.
Although direct entrance of surface or near-surface waters through boreholes and improperly plugged testholes and wells is probably the main avenue of contamination of the Dakota aquifer, pollutant chemicals could also infiltrate through soil and shallow thicknesses of the Dakota aquifer to reach ground waters in the outcrop area. Well-head protection is an important method of keeping potential sources of contaminants at a distance from wells. The approach involves delineating an area on the ground surface around a water-supply well and disallowing or removing activities or materials that could lead to the release of contaminants. Thus, gasoline stations, pesticide and fertilizer distribution, and waste sites, for example, should not be placed within the protection area. The simplest area boundary is a circle of a fixed radius such as a quarter mile, although better well-head protection areas are based on the zone under the surface within which water would be pumped or "captured" by a supply well over a given time period such as 50 years.
Protection from subsurface contamination by formation brines--Oil and gas is produced from rock formations underlying much of the region of the Dakota aquifer. The oil or gas pumped by production wells is accompanied by varying amounts of saltwater from the deep formations containing the petroleum. The saltwater must be disposed in subsurface formations containing saltwater at depths that will not lead to contamination of overlying aquifers. Current Kansas regulations establish minimum depths for disposal of oil and gas brines (Table II of the General Rules and Regulations for the Conservation of Oil and Natural Gas of the Kansas Corporation Commission [KCC]). However, some disposal of formation brine took place in the early 1940's into zones in the lower part of the upper Dakota aquifer already containing saline water in Russell County and in the lower Dakota aquifer in central Kansas until 1970.
Oil brine has been and is disposed into the Cedar Hills Sandstone underlying the Dakota aquifer. A concern has been whether the additional pressures in the Cedar Hills could allow upward movement of saltwater into the Dakota aquifer through abandoned oil and gas boreholes that were improperly sealed or plugged or not plugged. Consequently, the eastern limit of the area where brine disposal was allowed in the Cedar Hills Sandstone was moved to the west by a moratorium regulation to better protect water quality in the High Plains and the Dakota aquifers (fig. 43). The south-central Kansas moratorium passed by the KCC in 1987 prohibits Cedar Hills disposal in (1) all of Pratt, Stafford, Barton, Comanche, and Kiowa counties; (2) the eastern half of R. 18 W. and all of R. 16-17 W. in Rush, Pawnee, and Edwards counties; and (3) all of T. 27-29 S., R. 21-22 W. in Ford County. The northcentral Kansas moratorium passed by the KCC in 1990 prohibits Cedar Hills disposal in all of Russell and Osborne counties, and established a buffer zone in T. 7-15 S., R. 16 W.; T. 7-11 and 15 S., R. 17 W.; T. 7-8 and 15 S., R. 18 W.; and T. 15 S., R. 19 W., in Ellis and Rooks counties.
Figure 43--Cedar Hills disposal moratorium areas established by the Kansas Corporation Commission for central Kansas.
Kansas regulations also require the petroleum industry to protect fresh and usable aquifers from contamination by establishing minimum depths for surface casing in an oil or gas borehole (Table I of the General Rules and Regulations for the Conservation of Oil and Natural Gas of the KCC). The surface casing is a pipe that is inserted into the borehole being drilled during oil or gas exploration and sealed by injecting cement under pressure to fill the space between the casing and the borehole. The primary function of the surface casing in the petroleum industry is to prevent saltwater from entering a usable aquifer from lower zones intersected by the borehole. Although the static fluid level in some of the formations underlying the Dakota aquifer can be below the bottom of the aquifer, the fluid level can often be above the aquifer base in some areas such as where saltwater intrudes from the Cedar Hills Sandstone into the base of the Dakota in central Kansas. In other areas, pressures have been increased in the petroleum-bearing strata by the injection of secondary or waterflood waters or in brine-disposal zones by disposed saltwater. The greater pressures could also lead to flow of saltwater into overlying aquifers if the aquifer sediments were not sealed along the borehole. The cemented surface casing has the added advantage of protecting fresh and usable aquifers from surface contamination and from loss of water resources by drainage down boreholes where fluid levels in deeper formations are below the aquifer.
State statutes define the classifications for the fresh and usable aquifer waters that must be protected:
The map of total dissolved solids (fig. 16) includes contour lines for both the 1,000 mg/L and 10,000 mg/L TDS values for the limits of fresh and usable waters. Figure 16 was produced to generally display the freshest water within the aquifer and can serve as a conservative estimate of what waters should be protected. The data for this figure are based on analyses of water samples primarily in the fresh to usable water areas and on interpretation of geophysical logs in northwest Kansas. Table I of the KCC includes some of the regulations for minimum surface-casing requirements that were established using data preceding the Dakota Aquifer Program. Figure 16 provides improved information on which future revisions of Table I could be based.
The chloride distribution in Dakota aquifer waters is similar to the pattern shown in fig. 16. However, the area of ground water with chloride concentrations less than or equal to 500 mg/L is larger than for the area of TDS concentrations of 1,000 mg/L or less (freshwater). The main dissolved constituents in saltwater in Dakota aquifer waters are sodium and chloride, with lesser concentrations of calcium, magnesium, and sulfate. Fresh or slightly saline water contains appreciable amounts of dissolved constituents other than sodium and chloride, including bicarbonate. Thus, Dakota water with a TDS of 1,000 mg/L has a chloride content of from about 70 to 270 mg/L, values substantially less than 500 mg/L. In contrast, the average chloride concentration of Dakota aquifer water with a TDS content of 10,000 mg/L is very close to 5,000 mg/L; therefore, the chloride and TDS classification values agree well for the limit of usable water. Chloride concentration can be approximately estimated from TDS values greater than 1,350 mg/L using the following equation:
Chloride (mg/L) = 0.5441 (TDS [mg/L]) - 381. (eqn.4)
For example, if the TDS equals 5,000 mg/L, the approximate chloride content would be 5,060 mg/L, or about 50% of the TDS. The other 4,940 mg/L of dissolved solids would primarily be sodium, sulfate, bicarbonate, calcium, and magnesium. The higher the TDS content, the better the estimate. Chloride concentration cannot be estimated very accurately from TDS values less than 1,350 mg/L, although the following relationship will at least give a rough approximation of chloride usually within ±50% of the true value:
Chloride (mg/L) = 0.3815 (TDS [mg/L]) - 163. (eqn.5)
Based on this equation, a water with a TDS concentration of 1,000 mg/L would contain a chloride content of about 220 mg/L. The other dissolved constituents would account for approximately 80% of the total TDS, in comparison with the example above in which a water with 10,000 mg/L TDS would contain about 50% chloride.
From Part 1, it is clear that the regional hydrogeologic setting, including sources of recharge, discharge, groundwater-flow paths, and water quality are highly variable in the Dakota aquifer of Kansas. Locally, the heterogeneity in the aquifer framework strongly influences ground-water availability and the potential for inducing water-quality problems. Development in some areas may also induce capture (the increase in recharge and the decrease in discharge that results from pumping near recharge or discharge areas). In other areas, development may only result in the loss of water from storage in the aquifer.
This variability strongly indicates that management of water resources in the Dakota aquifer is best undertaken at the subregional level by defining water-supply suitability areas. Within each suitability area, the hydrogeologic and water-quality characteristics are similar within a certain range of possible states and parameter values. Each suitability area has its own set of factors to consider in developing appropriate policies and plans for development. Hence, the constraints on water-resources development will vary from one suitability area to another. A similar basis was used to define the boundaries of the groundwater management districts (subregions of the High Plains aquifer). However, for the Dakota, it is not appropriate to establish groundwater management districts because the boundary locations between suitability areas are not well known and may change. The rate and intensity of development may necessitate the adjustment of these boundaries. We have partially addressed these factors by arbitrarily selecting a 20-year planning horizon. More importantly, the Dakota remains a relatively unknown aquifer system in Kansas in comparison to the High Plains aquifer. It is expected that as development of the Dakota proceeds, the boundaries defining these suitability areas will be refined as more information becomes available.
The following is a description of these water-supply suitability areas, which we believe adequately capture the variable nature of the Dakota aquifer in Kansas. Figure 44 shows the approximate extent of each of the suitability areas. They are defined primarily on the basis of their hydrogeologic and secondarily on their water-quality characteristics.
Figure 44--The water-supply suitability areas of the Dakota aquifer in Kansas. The boundaries of these areas are defined by their hydrogeologic and water-quality characteristics.
Suitability Area I: This suitability area encompasses the region where the Dakota and the High Plains aquifers are hydraulically connected in southwestern and south-central Kansas. Where the High Plains aquifer's saturated thickness is greatest, the depth below the surface to the top of the Dakota aquifer is more than 500 ft (150 m). In western Stanton, western Morton, and southern Hamilton counties, the High Plains aquifer is absent or is very thin and the Dakota aquifer is the primary shallow aquifer. Ground water in the upper Dakota aquifer is fresh throughout this suitability area. However, ground-water chemical quality is variable in the lower Dakota aquifer because of the small amount of freshwater recharge that passes through the Kiowa shale aquitard. Ground-water salinities may exceed 2,000 mg/L (a value too high for human consumption but usable for livestock) in these parts of the suitability area. Nearer the Kansas-Colorado border and the Dakota's southern extent in southwestern Kansas, the lower Dakota contains freshwater because of its proximity to the regional recharge area in southeastern Colorado and local recharge from the High Plains aquifer. In this suitability area, the Dakota is used for drinking, industry, and agriculture, including irrigation. Water-level declines in the Dakota from previous development are less than 50 ft (15 m) in Suitability Area I.
Because the Dakota and the High Plains aquifers are hydraulically connected, they behave as a single system in this suitability area. The water-management policies developed for one of the aquifers will eventually have an impact on the other. Consequently, it is appropriate to consider both aquifer systems in policy development.
Suitability Area II: In this area, the Dakota aquifer is confined by the Upper Cretaceous aquitard and is adjacent to the area where the Dakota is hydraulically connected to the High Plains aquifer in Suitability Area I. The depth below the surface to the top of the Dakota aquifer is less than 400 ft (120 m) over most of this suitability area. Because the aquitard is thin, recharge from overlying sources contributes significantly to the upper Dakota aquifer but is less than the amount being withdrawn by pumping. Ground water in the upper Dakota is fresh (TDS of less than 1,000 mg/L) over most of the region. Groundwater salinity in the lower Dakota is believed to be less than 5,000 mg/L in the western half and more than 5,000 mg/L in the eastern half of the area. The upper Dakota is used for drinking water, industry, and agriculture, including irrigation. Use of the Dakota for irrigation is more common in Hodgeman and Ford counties. Water-level declines from previous water-resources development are generally less than 50 ft (15 m). Pumping wells in the Dakota aquifer in Suitability Area II may increase recharge from the High Plains aquifer into the Dakota aquifer in Suitability Area I.
Suitability Area III: In the eastern part of Suitability Area III, the Dakota is a shallow unconfined aquifer or is in contact with stream/aquifer systems. In the western part of the suitability area, the Dakota is poorly confined because the Upper Cretaceous aquitard is thin and relatively pervious. The depth below the surface to the top of the Dakota aquifer in the western part of this suitability area is generally less than 150 ft (45 m). The maximum recharge rates are on the order of a few tenths of an inch per year where the Dakota is unconfined. Ground-water quality in the upper part of the Dakota is locally variable where the salinity has not been flushed from the aquifer by freshwater recharge. In the unconfined regions, ground water in the upper part of the Dakota is mostly fresh. Salinity generally increases with depth in the lower part of the aquifer where the Dakota is confined and near some of the major streams that cross central Kansas. In this suitability area, the Dakota is used for drinking water, industry, and agriculture, including irrigation. Irrigation use is concentrated primarily in southwestern Washington, southeastern Republic, and northern Cloud counties. Water-level declines from development in Suitability Area III are believed to be less than 20 ft (6 m).
According to computer simulations, the primary impact of water-resources development in Suitability Area III is a reduction in discharge from the Dakota aquifer to streams, and the lateral movement of water from the confined to the unconfined Dakota aquifer from west to east. Further increases in development may only slightly increase water-level declines where the Dakota is a shallow aquifer.
Suitability Area IV: This suitability area includes that part of the confined Dakota aquifer located west of its regional discharge areas in north-central Kansas. Depth below the surface to the top of the Dakota aquifer is generally less than 400 ft (120 m). Freshwater recharge from overlying sources is variable locally and may have flushed some of the salinity from the upper part of the aquifer. However, natural saltwater in the lower part of the Dakota from the Cedar Hills Sandstone is widespread in this suitability area. Consequently, ground-water salinity generally increases with depth. In Suitability Area IVa, the salinity in the upper Dakota is less than 1,500 mg/L, whereas in Suitability Area IVb the salinity ranges from 1,500 mg/L to 10,000 mg/L. In Suitability Area IVa, water quality is acceptable for most uses, but in Suitability Area IVb, the aquifer is marginally usable. Ground-water salinities in the lower part of the Dakota aquifer probably exceed 10,000 mg/L over the entire suitability area. Water-level declines from development are believed to be less than 10 ft (3 m). In this suitability area, the upper Dakota is used primarily for drinking water and stock water. In Suitability Area IVb, the Dakota's use is limited and may require advanced treatment technologies to reduce ground-water salinity.
Wells in the upper part of the Dakota aquifer near the eastern edge of Suitability Area IV may reduce the eastward flow of fresher ground waters into the regional discharge areas. This may allow deeper, more saline ground water to move into the upper part of the Dakota and may increase the salinity of ground-water discharge to streams.
Suitability Area V: The confined Dakota aquifer receives negligible freshwater recharge from overlying sources. Depth below the surface to the top of the aquifer ranges from 400 ft to more than 1,500 ft (120-450 m) along the shared boundary with Suitability Area VI in northwest Kansas. The major source of freshwater is from the regional recharge area in southeastern Colorado. Ground-water salinities in the upper Dakota aquifer generally increase northeastward from less than 500 up to 1,500 mg/L in Suitability Area Va, and from 1,500 mg/L to 10,000 mg/L in Suitability Area Vb. Ground-water salinities in the lower Dakota aquifer are greater than 2,000 mg/L and may locally exceed 10,000 mg/L in the far northern and eastern parts of the Suitability Area V. In Suitability Area Va, water quality is acceptable for most uses and the Dakota is used primarily for drinking and livestock, but in Suitability Area Vb the water quality is marginal. In general, the farther to the north and east, the greater the increase in salinity with depth in the upper Dakota. Water-level declines from development are believed to be less than 50 ft (15 m) in this suitability area due to its limited use.
Water-resources development in this part of the aquifer is not likely to induce additional freshwater recharge from the High Plains aquifer into the unconfined Dakota aquifer in Suitability Area I. Pumping rates greatly exceed recharge from overlying sources. As a result, pumping may locally deplete the aquifer if wells and well fields are spaced too closely together.
Suitability Area VI: The Dakota is a confined aquifer and contains saline or "mineralized" ground water as defined by State statute, where mineralized ground water is defined as water containing more than 5,000 mg/L chloride or more than 10,000 mg/L total dissolved solids. Mineralized ground water is considered undesirable for most uses except oil and gas operations (such as secondary recovery) and is not protected by State and local regulations. In the northwest part of Suitability Area VI, the Dakota receives negligible freshwater recharge from overlying sources, flow rates are very low, and the depth to the top of the Dakota exceeds 1,500 ft (450 m). In the centra) part, vertical and lateral flow rates through the aquifer are higher and the top of the aquifer is less than 500 ft (150 m) deep. However, the flow of freshwater through the aquifer has been insufficient to flush the salinity from the aquifer where it is hydraulically connected to the Cedar Hills Sandstone.
The High Plains aquifer and the saturated alluvium adjacent to the streams that cross western and central Kansas have been major sources of water for agriculture, drinking water, and industrial use. Withdrawal of water from these shallow sources in some areas has resulted in substantial decreases in saturated thickness indicating overdevelopment. To control further development, more stringent management policies were applied by the Division of Water Resources (DWR), Kansas Department of Agriculture, and the groundwater management districts. These policies effectively eliminated new appropriations of water from these sources to users. However, even with more stringent policies in place, these once prolific sources of water may become insufficient to meet existing demand in the next few decades. These factors have combined to create interest in using a deeper source, the Dakota aquifer, to supplement or replace the dwindling shallower sources.
The Dakota aquifer covers approximately 40,000 mi2 (104,000 km2) of western and central Kansas and is more extensive than the shallower High Plains aquifer. The geologic units that form the Dakota aquifer in Kansas are the Dakota Formation, the Kiowa Formation, and the Cheyenne Sandstone. The Dakota has been used as a source of water for more than a century in the central Great Plains region that includes Kansas. Flowing wells tapping the Dakota were common in the Arkansas River valley of southeastern Colorado and southwestern Kansas in the late 1800's and early 1900's.
Unlike development in the High Plains aquifer, development in the Dakota is minimal even where the aquifer is relatively shallow in southwestern and central parts of the state. Until recently, the Dakota was less well understood than other aquifers because of its geologic complexity and, in some parts of the state, its great depth. Uncertainties with respect to (1) the quantity and quality of ground waters available, (2) the effects of withdrawals, and (3) the potential impact of oil-brine disposal on Dakota water quality have significantly impeded development of appropriate management policies by State and local agencies. Past management decisions were often made with little or no technical guidance. Well yield, water quality, and the considerable depth to the top of the aquifer are major factors contributing to the minimal use of this aquifer system in Kansas.
The major ground-water management issue that will affect the long-term viability of the Dakota as a major resource is its sustainability under increased development. Research results indicate that the Dakota will not produce water at the same rate as the High Plains aquifer on a sustained basis. The high variability of the deposits that constitute this aquifer system and the distances to recharge and discharge areas strongly indicate a potential for depletion due to overdevelopment in most of the confined aquifer. Also, pumping in areas of marginal water quality near saltwater-freshwater transition zones will need to be at rates that do not induce substantial encroachment of saline water. Because of these factors, the goal of managing for sustainability as it it is currently understood is untenable in this part of the aquifer. Controls on the spacing between pumping wells and rates of withdrawal are likely to be the most successful management tools. This will reduce the likelihood of water-rights impairment and large-scale depletion as long as the intensity of development is low. Where the Dakota is a near-surface aquifer in central Kansas, increased development will result in fewer longterm impacts than in the confined area because the potential for generating induced recharge is much higher. In southwestern Kansas, the hydraulic connection between the Dakota and the overlying High Plains aquifer suggests that both aquifers should be managed as a single system.
Prev--Report Start || Next--Appendices
Kansas Geological Survey, Geohydrology Section
Placed on web Aug. 19, 2014; originally published in 1999.
Comments to webadmin@kgs.ku.edu
The URL for this page is http://www.kgs.ku.edu/Publications/Bulletins/TS13/02_resources.html