Kansas Geological Survey, Technical Series 13
Next--Appendices
1U. S. Geological Survey and 2Kansas Geological Survey
Originally published in 1999 as Kansas Geological Survey Technical Series 13. This is, in general, the original text as published. The information has not been updated. An Acrobat PDF version (7 MB) is also available.
Comparisons of saturated hydrocarbon and terpane (m/z = 191) distributions for 26 Forest City basin oils demonstrate three geochemically distinct groups. Group 1 oils (n = 18) are produced from Middle and Upper Ordovician sandstones and limestones and Silurian-Devonian dolomites in anticlines along the north-northeast-south-southwest-trending basin axis close to the Humboldt fault, and from the Vassar and Easton-McLouth complex of fields on its eastern flank. Group 2 oils (n = 7) are produced from stratigraphic and combination structural-stratigraphic traps in lenticular Middle and Upper Pennsylvanian sandstones in fields extending south-southwestward from the Kansas City region into the Cherokee platform, and from the Yaege field on the Nemaha uplift to the west of the Humboldt fault. The Group 3 oil is produced from the Kansas City Group in the Davis Ranch field along the axis of the basin.
Rock-Eval© and organic-carbon analyses of 123 core, sidewall core, cuttings, and mine samples show good hydrocarbon source-rock potential for Middle Ordovician, Upper Devonian-Lower Mississippian, and Middle and Upper Pennsylvanian intervals. Organic-matter thermal maturity for all intervals generally increases from north to south. Organic matter in lower Paleozoic strata is generally marginally mature to mature, whereas, organic matter in Pennsylvanian strata is immature to marginally mature. Comparison of saturated hydrocarbon and terpane (m/z = 191) distributions from rock extracts with those of the oils show that source rocks for the Group 1 oils are shales in the Middle Ordovician Simpson Group; Group 2 oils, the Upper Devonian-Lower Mississippian Chattanooga Shale, and Group 3 oil, marine black shales within the Middle and Upper Pennsylvanian section.
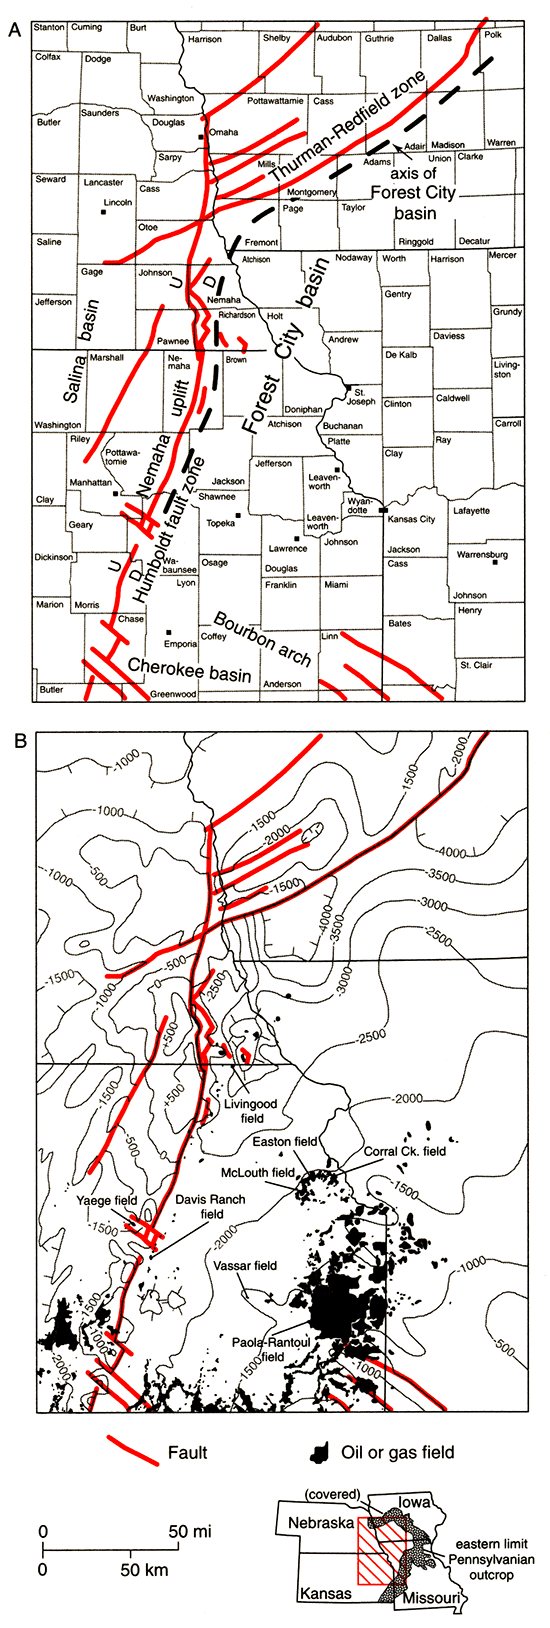
The Forest City basin is a shallow late Paleozoic interior cratonic basin occupying the northeastern portion of Kansas and parts of adjoining Missouri, Iowa, and Nebraska (fig. 1). It is an asymmetric structural depression with a broad eastern flank. The basin axis is situated very close to the Humboldt fault, which separates the basin from the Nemaha uplift to the west. The northern boundary with the Iowa shelf is defined by the Thurman-Redfield fault zone in southwestern Iowa, whereas, the southern boundary with the Cherokee basin is the low-lying Bourbon arch. The eastern boundary is poorly defined and has been placed arbitrarily along the line marking the outcrop of the Middle Pennsylvanian Cherokee Group (Wells, 1971). Maximum depth to the Precambrian surface is about 5,200 ft (1,585 m) in Page County, Iowa (Newell et al., 1987).
Figure 1--Forest City basin index maps. Basement structure contours (in feet) are from Burchett et al. (1983b); oil and gas fields are from Burchett et al. (1983a) and Paul et al. (1988).
The U.S. Geological Survey (1995) and Gautier et al. (1996) estimated mean amounts of undiscovered, technically recoverable conventional hydrocarbons for the Forest City basin to be about 20 million barrels of crude oil, about 70 billion cubic feet of gas, and less than 10 million barrels of natural gas liquids.
Two oil- and gas-production trends dominate the Forest City basin. On the eastern flank of the basin, a broad belt of oil and gas fields extends south-southwestward from the Kansas City region and continues into the Cherokee basin in southeastern Kansas and northeastern Oklahoma. This trend is characterized by stratigraphic and combination structural-stratigraphic traps developed in lenticular Middle and Upper Pennsylvanian sandstones of the Cherokee, Marmaton, and Pleasanton Groups (Jewett, 1954; Newell et al., 1987). Early production records are not accurate, but fields in this trend have probably produced in excess of 74 million barrels of oil and 6.6 billion cubic feet of gas (Newell et al., 1987).
The second production trend is defined by a series of fields that occur in anticlines present along the north-northeast–south-southwest-trending axis of the basin (fig. 1). Most production in this western trend comes from lower Paleozoic reservoirs including Middle Ordovician Simpson Group sandstones, Upper Ordovician Viola Limestone, and Silurian-Devonian "Hunton" dolomites (Newell et al., 1987). Most reservoirs in this production trend are in relatively deep structural positions along the axis of the Forest City basin. About 32 million barrels of oil have been recovered from fields in this western trend (Newell et al., 1987).
A third hydrocarbon trend is present in western Missouri and eastern Kansas on the southern and eastern basin margins. This trend is characterized by the occurrence of low-gravity, high-viscosity oil in discontinuous shallow Pennsylvanian sand bodies at depths of less than 200 ft (60 m) (Wells and Anderson, 1968; Wells, 1979; Ebanks and Weber, 1987). In-place oil in these shallow deposits in the Forest City basin and Cherokee platform to the south has been estimated to be about two billion barrels (Wells, 1979). Except for local heavy oil produced from stripper wells or through enhanced-recovery techniques (Ebanks and Weber, 1987), production from these deposits currently is not significant. This third trend will not be discussed further in this report.
This paper provides a summary of the geochemistry of oils and potential hydrocarbon-source rocks from the Forest City basin and adjacent areas of the midcontinent. This summary includes (1) a brief review of previous studies characterizing the geochemistry of oils and hydrocarbon-source rocks; (2) compilations of new and previously published geochemical data characterizing (a) the oils from the two identified major production trends in the basin, and (b) potential hydrocarbon-source rocks, including representative samples from formations of Middle and Upper Ordovician, Upper Devonian-Lower Mississippian, and Middle and Upper Pennsylvanian age; and (3) analyses of the available data which identify three different oil groups and correlate these oils with their hydrocarbon-source rocks.
Previous studies listing geochemical analyses of oils from the Forest City basin and adjacent areas in the midcontinent include Reed et al. (1986), Hatch et al. (1987, 1989), Longman and Palmer (1987), and Newell et al. (1987). These studies clearly document the presence of at least two different oil groups in the Forest City basin. One of these groups, the "Ordovician" oils, is primarily produced from Middle and Upper Ordovician sandstones and limestones, and Silurian-Devonian "Hunton" dolomites in anticlines along the north-northeast–south-southwest-trending basin axis close to the Humboldt fault (Newell et al., 1987). Oils from this group also are produced from Mississippian limestone and/or Pennsylvanian sandstone reservoirs in at least three fields (Easton and Corral Creek fields, Leavenworth County, Kansas, and Vassar field, Osage County, Kansas) on the eastern side of the Forest City basin. The second oil group is primarily produced from lenticular Middle and Upper Pennsylvanian sandstones in the production trend on the eastern flank of the basin.
Oils similar to those from the first group also are produced from Middle and Upper Ordovician sandstones, limestones, and shales in fields on the southern margin of the Salina basin (Marion, Saline, McPherson, and Harvey counties, Kansas) southwest of the Forest City basin, and from Middle Ordovician dolomite in the Keota Dome field, Washington County, Iowa, northeast of the Forest City basin (Hatch et al., 1987, 1991). Oils similar to those from the second group are produced from lenticular sandstone reservoirs in the Middle Pennsylvanian Cherokee Group in the Cherokee basin in southeastern Kansas and northeastern Oklahoma (Hatch et al., 1989).
Gas-chromatographic characteristics of the Ordovician oils include a relatively high abundance of n-alkanes with carbon numbers less than 20, a strong predominance of odd-numbered n-alkanes between C10 and C20, and relatively small amounts of branched and cyclic alkanes (Reed et al., 1986; Hatch et al., 1987; Longman and Palmer, 1987). Gas-chromatographic characteristics of the second oil group include regularly decreasing amounts of n-alkanes with increased carbon number, no odd-carbon predominance, and relatively abundant branched and cyclic compounds.
The "Ordovician oils" are characterized by unusually wide ranges in the carbon-isotope compositions of the saturated and aromatic hydrocarbon fractions. Analyses for 10 oils from the Forest City basin listed in Hatch et al. (1987, table 1) and for six oils listed in Longman and Palmer (1987, table 2) show δ13Csat ranging from -26.9 to -31.3‰, and δ13Carom from -26.2 to -31.5‰. Similar wide ranges in oil carbon-isotope compositions were noted for seven "Ordovician" oils collected from the southern margin of the Salina basin by Hatch et al. (1987). There, δ13Csat ranges from -24.9 to -30.9‰, and δ13Carom from -24.3 to -31.0‰. For the "Ordovician" oil from the Keota Dome field in Iowa, δ13Csat is -32.1‰, and δ13Carom is -31.5‰ (Hatch et al., 1987). In contrast, for seven samples of the second group of oils collected from the Cherokee basin, Hatch et al. (1989) document a much smaller range in carbon-isotope compositions. There, δ13Csat ranges from -29.2 to -30.6‰, and δ13Carom from -28.2 to -29.4‰.
Terpane distributions (from GCMS) for the "Ordovician" oils from the Forest City basin are characterized by nearly equal amounts of C19, C20, C21, C23, and C24 tricyclic terpanes and relatively large amounts of C24 tetracyclic terpane (Longman and Palmer, 1987). Terpane distributions for oils from the second group from the Cherokee basin are characterized by low relative amounts of C19 and C20 tricyclic and C24 tetracyclic terpanes and high relative amounts of C23 through C28 tricyclic terpanes (Hatch et al., 1989).
Previous studies characterizing hydrocarbon source-rock potential and extract geochemistry of rock intervals from the Forest City basin and adjacent areas of the midcontinent region have focused on organic-matter-rich intervals in the Middle Ordovician Simpson Group and correlative units (Newell et al., 1987; Hatch et al., 1987, 1991; Jacobson et al., 1988), the Upper Devonian-Lower Mississippian Chattanooga Shale (Hatch et al., 1989), and on Middle and Upper Pennsylvanian, thin, widespread, marine black shales (Baker, 1962; James, 1970; James and Baker, 1972; Hatch et al., 1984, 1989; Wenger et al., 1988; Ece, 1989; Hatch and Leventhal, 1992, 1997). Newell et al. (1987) modeled organic-matter thermal maturity of the Paleozoic section in the Forest City basin utilizing time-temperature index calculations (after Waples, 1980). Brief summaries of these studies follow:
More detailed modeling of paleotemperatures and organic matter maturation on the Cherokee platform farther south by Forster and Merriam (1994) shows similar problems in attempting to account for observed vitrinite reflectance in the Cherokee Group. Here, higher maturation can be achieved by invoking flow of heated waters out of the deep Anadarko and Arkoma basins (Forster and Merriam, 1994). The extent to which this fluid flow would affect the Forest City basin is unknown.
This study reports geochemical data for 26 oils and 123 samples of potential hydrocarbon source rocks. Locations and descriptive information for the oil samples are in appendix 1; sampled locations are shown in fig. 2A. Four oils (index map locations C through F) are from the broad belt of oil and gas fields that extends south-southwestward from the Kansas City region on the eastern flank of the basin; two oils (index map locations O and R) are from fields (Easton and Vassar) to the west and downdip of the first trend. Eighteen oils (index map locations A, I-N, P, and Q) are from fields found along the north-northeast–south-southwest-trending axis of the basin. For comparison with Forest City basin oils, three additional oils (index map locations B, G, and H) are included in appendix 1. Two of these oils (locations G and H) were collected from fields in Greenwood and Woodson counties, Kansas, on the northern edge of the Cherokee platform region. The third oil (location B) was collected from the Yaege field, Riley County, Kansas, on the Nemaha uplift.
Figure 2--(A) Oil-sample locations (A-R) and (B) rock-sample locations (1-22) from the Forest City basin area in eastern Kansas, northwestern Missouri, southwestern Iowa, and southeastern Nebraska. Oil-sample locations are listed in appendix 1; rock-sample locations, appendix 2. Oil Groups 1-3 are defined in the text. Formation or group sampled at each location is shown in B.
Locations and descriptive information for the 123 samples of potential hydrocarbon-source rocks are in appendix 2; sampled locations are shown in fig. 2B. These samples were collected from conventional and sidewall cores, strip mines, and well cuttings at 21 locations in southwestern Iowa, southeastern Nebraska, northwestern Missouri, and eastern Kansas. Twenty-two samples are from shales and limestones in the Middle Ordovician Simpson Group; three samples, Upper Ordovician Maquoketa Shale; 20 samples, Upper Devonian-Lower Mississippian Chattanooga Shale; 22 samples, Middle Pennsylvanian (Desmoinesian) Cherokee and Marmaton Groups; and 56 samples, Upper Pennsylvanian (Missourian and Virgilian) Pleasanton, Kansas City, Lansing, and Shawnee Groups. The samples from the Middle and Upper Pennsylvanian were primarily collected from thin, widespread, marine black shales that represent the offshore shale lithofacies (Heckel, 1977, 1991; Ebanks et al., 1979).
Descriptions for many of the oil and rock samples included in this report have been previously published. Descriptions for oils from locations G and H are from Hatch et al. (1989, appendix 1); the 10 oils from locations A, K-N, P, and Q are from Hatch et al.(1987, table 1). Descriptions for the samples from the Stark Shale Member of the Dennis Limestone from location 12 are from Hatch and Leventhal (1992, table 1); for the Cherokee Group samples from locations 15 and 16, Hatch et al. (1984, table 1); and for the Chattanooga Shale samples from locations 12,20, and 21, Hatch et al. (1989, appendices 1 and 2). Descriptions for the samples of the Upper Pennsylvanian shales from locations 1, 4-6, and 14 are from core logs at the Iowa Geological Survey. Descriptions for samples of the Stark Shale Member of the Dennis Limestone from locations 11 and 13 are from core logs at the Kansas Geological Survey, whereas descriptions for samples of the Upper Pennsylvanian shales from location 7 were provided by R. M. Coveney, University of Missouri-Kansas City.
Available core samples of the Chattanooga Shale in eastern Kansas represent only a fraction of the thickness of the formation. As examples, the samples of Chattanooga Shale from location 12 (Davis A #2 well) represent the basal 3 ft (0.9 m) of the formation, for location 20 (Bock #1 well) the basal 12 ft (3.7 m) of shale, and for location 21 (Stauffer #1 well) the basal 9 ft (2.7 m) of shale. In this part of eastern Kansas, the Chattanooga Shale is between 50 and 100 ft (15-30 m) thick (Adler et al., 1971, fig. 13).
In this report, organic-carbon content (weight %) hydrogen index (HI, mg HC/g TOC), oxygen index (OI, mg CO2/g TOC), Tmax (°C), genetic potential (S1+S2, mg HC/g rock) and production index (PI, S1/[S1+S2]) from Rock-Eval© pyrolysis are used to characterize organic-matter amount, composition, thermal maturity, hydrocarbon-generation potential, and the conversion of organic matter to hydrocarbons. These measurements were determined by the Delsi-Nermag model II instrument with the attached carbon analyzer. Methods and interpretations of the Rock-Eval© results follow Espitalie et al. (1977), Tissot and Welte (1978, p. 445-447), Orr (1983), and Peters (1986).
Oil samples were separated into saturated-hydrocarbon, aromatic-hydrocarbon, resin (NSO), and asphaltene fractions by a Baker-10 Extraction System (J. T. Baker Chemical Co.) using SPE (3-ml) 20-micron filtration columns, silica-gel columns (6 ml), and cyano (CN) columns (6 ml). Elutants used were cyclohexane, cyclohexanelbenzene (3/1), and chloroform after Anders et al. (1987). Powdered rock samples were extracted by chloroform (CHCl3) in a Soxhlet apparatus for 24 hours. Sulfur was removed by refluxing with polished copper strips. The extract solution was filtered, concentrated under a stream of nitrogen at room temperature, and then diluted with n-heptane to precipitate asphaltenes. A concentrate of the solution was separated by column chromatography on silica gel, eluting successively with n-heptane, benzene, and benzene-methanol (1:1 v/v) to collect the saturated-hydrocarbon, aromatic-hydrocarbon, and resin (NSO) fractions, respectively.
Gas chromatography of the saturated-hydrocarbon fractions of both oils and rock extracts was performed by a Hewlett-Packard 5880 gas chromatograph equipped with fused-silica capillary column (50 m x 0.32 mm J.D., SE-54). Oven temperature was programmed from 50° to 320°C at 4°C min-1. Detector output was digitized and stored on computer disk for calculation of relative amounts of hydrocarbon components. Absolute quantification of peaks was not attempted. Gas chromatography-mass spectrometry (GC-MS) was performed using a HP 5890 gas chromatograph interfaced to a VG 7035 doublefocusing mass spectrometer. Relative amounts of biomarker compounds were determined by single-ion monitoring of characteristic ions. Relative peak heights of m/z = 191 fragmentograms were used to compare distributions of terpane compounds. The identified terpane compounds are listed in table 1.
Table 1--List of identified terpanes.
| Peak | Compound Name |
|---|---|
| 1. | C19 tricyclic |
| 2. | C21 tricyclic |
| 3. | C23 tricyclic |
| 4. | C25 tricyclic |
| 5. | C26 tricyclics |
| 6. | C24 tetracyclic |
| 7. | C28 tricyclics |
| 8. | C29 tricyclics |
| 9. | C29 norhopane |
| 10. | C30-17α(H), 21β(H) hopane |
| 11. | C31-17α(H), 21β(H) homohopane (s + r) |
| 12. | C32-17α(H), 21β(H) bishomohopane (s + r) |
| 13. | C33-17α(H), 21β(H) trishomohopane (s + r) |
To determine carbon-isotope composition, saturated- and aromatic-hydrocarbon fractions from oils and rock extracts were comb us ted to carbon dioxide in a high-vacuum furnace and gas-transfer system. Stable-carbon isotope ratios were determined with a Finnigan MAT 251, isotope-ratio mass spectrometer. Isotope compositions of carbon dioxide from the samples were compared directly to reference standards of carbon dioxide prepared from NBS-19 limestone (δ13C = 1.96‰ PDB). Ratios are reported as standard per mil (‰) deviation relative to the Peedee belemnite standard (PDB):
δ13C = [(R sample/R standard) - 1] x 103,
where:
R = ratio of 13C to 12C.
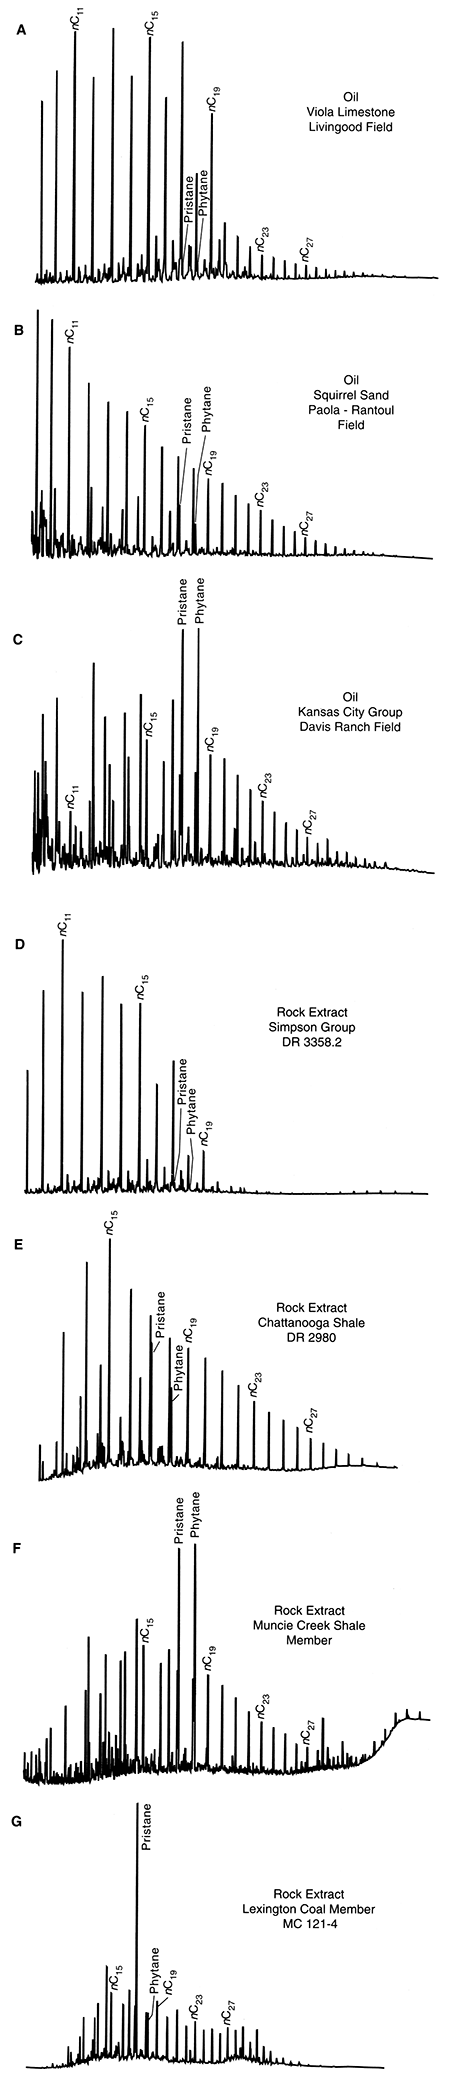
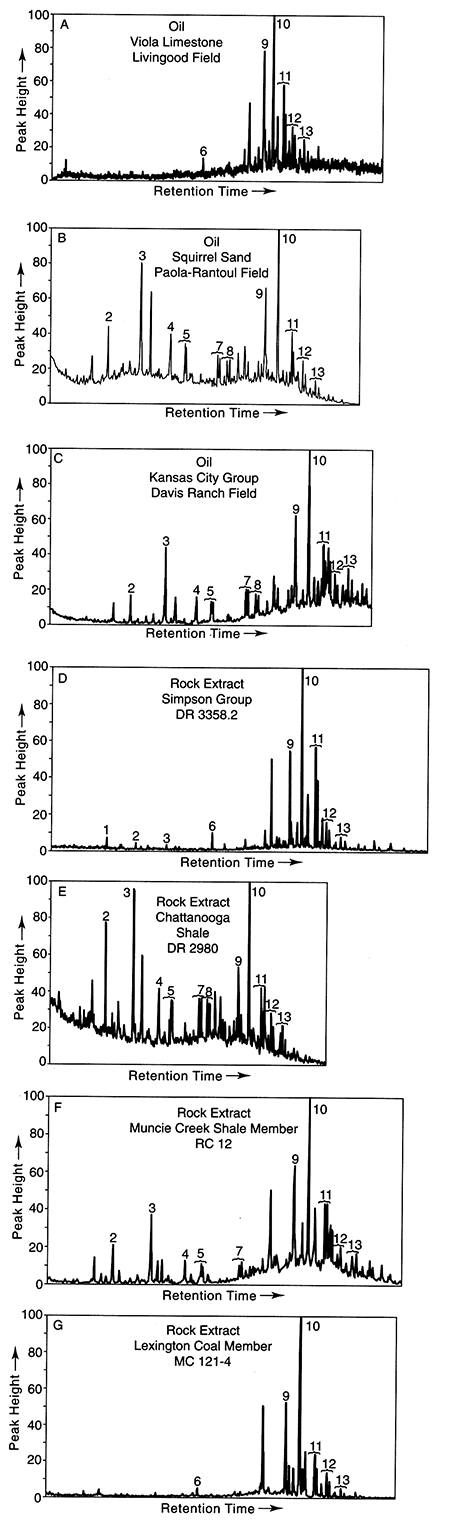
The saturated-hydrocarbon fractions from the oils show three gas chromatographic patterns (figs. 3A-C). The first pattern (Group 1, fig. 3A) is shown by 18 oils and is characterized by a dominance of odd-carbon-number n-alkanes between nC10 and nC20, relatively small amounts of branched and cyclic alkanes (including the isoprenoids), and relatively small amounts of alkanes with carbon numbers greater than nC19. The second pattern (Group 2, fig. 3B), shown by seven oils, is characterized by decreasing amounts of n-alkanes, and the presence of isoprenoids (e.g., pristane and phytane). The third pattern (Group 3, fig. 3C) shown by one oil, is characterized by isoprenoid compounds dominant over the n-alkanes, with maximum n-alkane content at nC15.
Figure 3--Representative saturated hydrocarbon distributions for: (A) Oil Group 1, (B) Oil Group 2, and (C) Oil Group 3, and rock extracts from the (D) Middle Ordovician Simpson Group, (E) Upper Devonian-Lower Mississippian Chattanooga Shale (F), Upper Pennsylvanian Kansas City Group, and (G) Middle Pennsylvanian Marmaton Group coal.
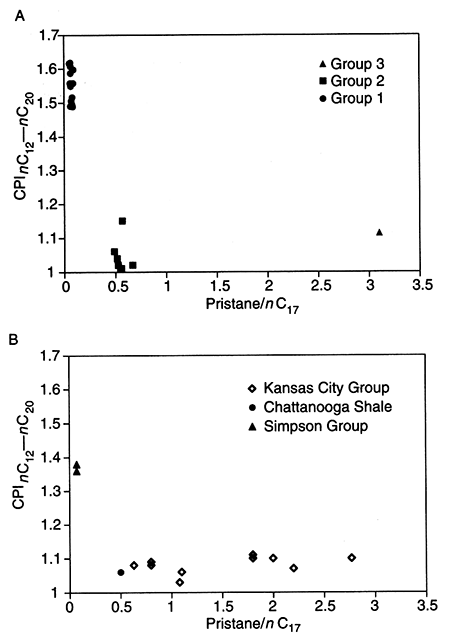
Pristane/phytane, pristane/nC17, and carbon-preference index (CPI, after Bray and Evans, 1961) for n-alkanes between nC12 and nC20 for the oils are listed in table 2. Median values and ranges for these parameters are summarized in table 4. A plot of oil pristane/nC17 versus CPI for nC12-nC20 is shown in fig. 4A. Figure 4A shows clear differences in pristane/nC17 to nC12-nC20 CPI for the three oil groups. For the Group 1 oils, pristane/nC17 ranges from 0.04 to 0.10; Group 2 oils, 0.49 to 0.67; and for the Group 3 oil, 3.1. The nC12-nC20 CPI for the Group 1 oils is higher (range = 1.5 to 1.6) than for the Group 2 oils (range = 1.0 to 1.1) or the Group 3 oil (1.1).
Table 2--Organic geochemical characteristics of 26 oil samples from northwestern Missouri, southeastern Nebraska, and eastern Kansas. (Oil groups are defined in the text; oil-sample locations are shown in fig. 2A.)
| Location map letter |
Sample name |
°API | Pristane/ Phytanea |
Pristane/ nC17a |
nC12-20b CPI |
δ13Coilc | δ13Csatc | δ13Caromc |
|---|---|---|---|---|---|---|---|---|
| Group 3 | ||||||||
| A | Davis A#15 | 30 | 0.9 | 3.1 | 1.1 | -29.5 | -30.1 | -29.1 |
| Group 2 | ||||||||
| B | Yaege #12 | 23 | 1.6 | 0.57 | 1.1 | -29.9 | -30.5 | -29.3 |
| C | Keegan | 31 | 1.6 | 0.56 | 1.0 | -30.7 | ||
| D | Kramer | 20 | 1.4 | 0.67 | 1.0 | -29.9 | ||
| E | Andersen | 1.6 | 0.53 | 1.0 | ||||
| F | Polhamus | 1.5 | 0.56 | 1.0 | ||||
| G | Teeter #37 | 1.6 | 0.52 | 1.0 | -30.2 | -29.4 | ||
| H | Headley A | 1.6 | 0.49 | 1.1 | -29.6 | -28.9 | ||
| Group 1 | ||||||||
| I | #1 Watkins | 1.0 | 0.10 | |||||
| J | #1 Miles A | 0.9 | 0.09 | 1.6 | ||||
| K | Reesman | 0.9 | 0.08 | 1.5 | -29.0 | -28.7 | ||
| K | Seiberson | 0.9 | 0.07 | 1.5 | ||||
| K | Sand Rock | 1.0 | 0.07 | 1.5 | -28.8 | -29.0 | ||
| K | Harper #7 | 31 | 0.9 | 0.08 | 1.5 | -29.0 | -29.1 | -28.9 |
| K | Walldraff | 0.9 | 0.08 | 1.5 | ||||
| K | Liniger | 0.9 | 0.07 | 1.6 | ||||
| L | Hustead | 1.0 | 0.07 | 1.5 | -29.7 | -29.7 | ||
| M | #1 Aberle | 25 | 0.8 | 0.08 | 1.6 | -30.6 | -30.4 | -30.6 |
| M | #1 Parli | 0.8 | 0.06 | 1.6 | -30.0 | -30.2 | ||
| N | #1 Potts-V | 29 | 0.8 | 0.06 | 1.6 | -29.3 | -29.3 | -29.0 |
| N | #1 Potts-S | 28 | 0.8 | 0.04 | 1.6 | -31.3 | -31.3 | -31.1 |
| O | Crook Lease | 23 | 1.2 | 0.07 | 1.5 | -28.9 | ||
| A | Davis A #11 | 28 | 0.9 | 0.09 | 1.5 | -26.7 | -26.8 | -26.2 |
| P | #8 Olsen | 0.7 | 0.07 | 1.5 | -26.9 | -26.6 | ||
| Q | #1 Greer | 0.8 | 0.06 | 1.6 | -27.1 | -26.8 | ||
| R | #1 Woodard | 1.2 | 0.05 | 1.6 | ||||
| Blank space indicates no data. Sample locations are listed in appendix 1. a. Ratios calculated from relative peak heights above base line. b. Modified from Bray and Evans (1961). c. In parts-per-mil relative to the PPB marine-carbonate standard. δ13Coil values were provided by Sohio Petroleum Geochemistry Group. δ13Csat and δ13Carom for the Teeter #37 and Headley A #1-9 oils are from Hatch et al. (1989, table 5). δ13Csat and δ13Carom for the Group 1 oils except #7 Harper are from Hatch et al. (1987. table 2). δ13Csat and δ13Carom for the #7 Harper and Yaege #12 oils were provided by Sohio Petroleum Geochemistry Group. |
||||||||
Figure 4--Plot of pristane/nC17 versus nC12-nC20 carbon preference index (CPI) for (A) Oil Groups 1,2, and 3, and (B) rock extracts from shales of the Middle Ordovician Simpson Group shales, Upper Devonian-Lower Mississippian Chattanooga Shale, and Upper Pennsylvanian Kansas City Group.
The distributions and relative amounts of tricyclic, C24 tetracyclic, and pentacyclic terpanes (m/z = 191) for the oils are shown in figs. 5A-C. Terpane distributions for Group 1 oils (e.g., fig. 5A) are characterized by relatively abundant pentacyclic terpanes (peaks 9-13), minimal amounts of the tricyclic terpanes, and intermediate amounts of C24 tetracyclic terpane (peak 6). Terpane distributions for the Group 2 oils (fig. 5B) and the Group 3 oil (fig. 5C) are similar to each other, with hopane (C30, peak 10) the most abundant pentacyclic terpane, C23 (peak 3) the most abundant tricyclic terpane, relatively abundant extended tricyclic compounds (C26, C28, and C29 doublets, peaks 5, 7, and 8), and low relative amounts of C24 tetracyclic terpane. Relative to amounts of pentacyclic terpanes, the amounts of tricyclic terpanes are relatively greater in the Group 2 oils compared to the Group 3 oil.
Figure 5--Representative terpane (m/z = 191) ion fragmentograms for: (A) Oil Group 1, (B) Oil Group 2, and (C) Oil Group 3, and rock extracts from the (D) Middle Ordovician Simpson Group, (E) Chattanooga Shale, (F) Kansas City Group, and (G) Marmaton Group coal. Numbered peaks are identified in table 1.
Measures of whole oil δ13C for 10 oils and δ13C of the saturated- and aromatic-hydrocarbon fractions for 15 oils are listed in table 2. Whole oil δ13C for six Group 1 oils ranges from -26.7 to -31.3‰, a 4.6‰ difference; for the three Group 2 oils, the range is -29.9 to -30.7‰, a 0.8‰ difference. Oil δ13Csat and δ13Carom measures show similar trends. For 11 Group 1 oils, δ13Csat ranges from -26.8 to -31.3‰, a 4.5‰ difference; for three Group 2 oils, δ13Csat ranges from -29.6 to -30.5‰, a 0.9‰ difference; δ13Carom for the Group 1 oils ranges from -26.2 to -31.1, a difference of 4.9‰; δ13Carom for the Group 2 oils ranges from -28.9 to -29.4‰, a difference of 0.5‰.
Hydrocarbon source-rock potential is dependent on the amount, thermal maturity, and composition of organic matter in the rock. The amount of organic matter is measured by the organic carbon content [TOC]; relative organic matter compositions, by hydrogen index [HI] and oxygen index [OI]. The relative potential to generate hydrocarbons is measured by genetic potential (GP), thermal maturity by Tmax (°C), and vitrinite reflectance (R, %), whereas, the conversion of organic matter to hydrocarbons is indicated by production index (PI). TOC, HI, OI, GP, Tmax. and PI for 87 core and mine samples are listed in appendix 3; similar data for 36 cuttings samples, appendix 4. Vitrinite reflectance for 17 cuttings samples are included in appendix 4. Median values and ranges for TOC, HI, and GP are listed in table 5.
Table 3--Organic geochemical characteristics of bitumens extracted from 24 samples of Paleozoic rocks from northwestern Missouri and northeastern Kansas. The Kansas City Group is of Upper Pennsylvanian age. The Marmaton Group and Cherokee Group are of Middle Pennsylvanian age; the Chattanooga Shale is of Upper Devonian-Lower Mississippian age; whereas, the Simpson Group is of Middle Ordovician age.
| Location map letter |
Sample name |
Bitumen mg/kga |
Pristane/ Phytaneb |
Pristane/ nC17b |
nC12-20c CPI |
δ13Csatd | δ13Caromd |
|---|---|---|---|---|---|---|---|
| Kansas City Group | |||||||
| 7 | RC12 | 5700 | 1.0 | 2.2 | 1.1 | -29.4 | -29.2 |
| RC5 | 6300 | 1.1 | 1.1 | 1.0 | -28.9 | -29.0 | |
| 12 | S2-1 | 7050 | 1.3 | 1.1 | 1.1 | ||
| S4-1 | 5600 | 1.4 | 0.6 | 1.1 | |||
| S5 | 5590 | 1.1 | 1.3 | * | |||
| S8T | 6360 | 1.1 | 2.0 | 1.1 | |||
| S11 | 9840 | 1.2 | 2.8 | 1.1 | |||
| S12B | 5050 | 1.4 | 0.8 | 1.1 | |||
| 13 | W5A6 | 5750 | 1.3 | 1.8 | 1.1 | -28.7 | -28.4 |
| W5A12 | 2930 | 1.4 | 0.8 | 1.1 | -28.3 | -27.9 | |
| W5A16 | 2310 | 1.2 | 1.8 | 1.1 | -28.5 | -28.1 | |
| Marmaton Group | |||||||
| 15 | MC121-2 | 6700 | 1.4 | 3.2 | * | ||
| MC121-3 | 2000 | 1.8 | 2.7 | * | |||
| MC121-4 | 9400 | 6.7 | 4.7 | * | -26.6 | -24.9 | |
| 16 | 349-3 | 6300 | 1.7 | 1.3 | * | -27.4 | -27.6 |
| Cherokee Group | |||||||
| 16 | 349-46 | 3800 | 1.8 | 1.1 | * | ||
| 349-57 | 2800 | 2.0 | 1.9 | * | |||
| Chattanooga Shale | |||||||
| 12 | DR2980 | 4000 | 1.6 | 0.83 | * | -29.1 | -28.4 |
| 20 | STA2319 | 5300 | 1.6 | 0.55 | * | -29.3 | -28.7 |
| 21 | BOC2174.8 | 2094 | 1.5 | 0.50 | 1.1 | ||
| Simpson Group | |||||||
| 12 | DR3313.5 | 3800 | 1.5 | 0.07 | 1.4 | -26.3 | -26.7 |
| DR3315.5 | 1010 | 0.7 | 0.06 | * | -26.4 | -26.1 | |
| DR3321.0 | 580 | 0.8 | 0.05 | * | -25.6 | -25.4 | |
| DR3358.2 | 4240 | 1.5 | 0.07 | 1.4 | |||
| Blank space indicates no data. Sample locations are listed in appendix 2. a. gHC/kg sample b. Ratios calculated from relative peak heights above base line. c. Modified from Bray and Evans (1961); *indicates CPI could not be calculated because some of the nC12 to nC20 compounds were lost during evaporation of excess solvent. d. In parts-per-mil relative to the PDB marine-carbonate standard. Total bitumen and pristane/phytane ratios for Marmaton Group, Cherokee Group, and Chattanooga Shale samples are from Hatch et al. (1984. table 7; 1989, table 5 and appendix 3). δ13Csat and δ13Carom for the Simpson Group samples are from Hatch et al. (1987. table 2). |
|||||||
Table 4--Median values and ranges of pristane/phytane, pristane/nC17, nC12-nC20 CPI for oil groups 1, 2, and 3, and rock extracts from shales in the Upper Pennsylvanian Kansas City Group and Middle Pennsylvanian Marmaton and Cherokee Groups, Upper Devonian-Lower Mississippian Chattanooga Shale, and Middle Ordovician Simpson Group shales from the Forest City basin and adjacent areas. (Data are listed in tables 2 and 3.)
| Pristane/phytane | Pristane/nC17 | nC12-nC20 CPI | |
|---|---|---|---|
| Group 3 oil | 0.9 * |
3.1 * |
1.1 * |
| Group 2 oils | 1.6 (n = 7) 1.4-1.6 |
0.56 (n = 7) 0.49-0.67 |
1.0 (n = 7) 1.0-1.1 |
| Group 1 oils | 0.9 (n = 18) 0.7-1.2 |
0.07 (n = 18) 0.04-0.10 |
1.6 (n = 17) 1.5-1.6 |
| Kansas City Group | 1.2 (n = 11) 1.0-1.4 |
1.3 (n = 11) 0.6-2.8 |
1.1 (n = 10) 1.0-1.1 |
| Marmaton and Cherokee Groups |
1.8 (n = 5) 1.4-2.0 |
2.7(n =11) 1.1-3.2 |
* * |
| Chattanooga Shale | 1.6 (n = 3) 1.5-1.6 |
0.55 (n = 3) 0.50-0.83 |
1.1 (n = 1) |
| Simpson Group | 1.2 (n = 4) 0.7-1.5 |
0.06 (n = 4) 0.05-0.07 |
1.4 (n = 2) 1.36-1.38 |
| * = not calculated. | |||
Median values and ranges of organic-carbon contents (table 5) show considerable variation for the nine different formations/groups summarized. Median TOC contents are high for shale samples from the Shawnee Group (10.1%), Lansing Group (10.0%), Kansas City Group (12.1%), and Marmaton Group (9.9%); intermediate TOC contents characterize shale samples from the Pleasanton Group (4.4%-8.0%), Cherokee Group (5.0%), and Chattanooga Shale (3.6%). Relatively low TOC contents characterize shale samples from the Maquoketa Shale (1.5%) and shales and limestones from the Simpson Group (1.1%). TOC for the coal samples are highest: 47% TOC for the Cherokee Group coal sample and 61 % TOC for the Marmaton Group coal sample.
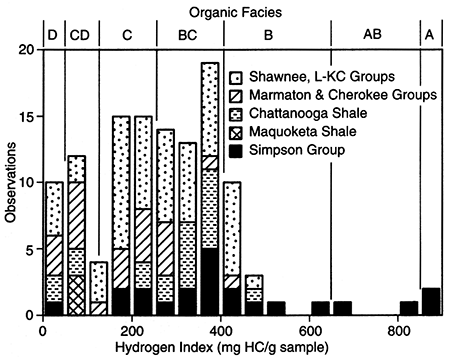
Median values and ranges for hydrogen indices for the nine different formations/groups are listed in table 5. The distribution of hydrogen indices for each formation/group is shown in fig. 6. Median hydrogen index is highest (between 370 and 380 mg/g) for the Simpson Group shale and limestone samples and the Chattanooga Shale samples (350 mg/g). Lower median values are shown for samples of Kansas City Group shales (295 mg/g), Marmaton and Cherokee Group coals (230 mg/g), Shawnee Group and Marmaton Group shales (220 mg/g), and Cherokee Group shales (170 mg/g). The lowest median values were obtained for the Lansing Group shales (130 mg/g), Pleasanton Group shales (between 120 and 140 mg/g), and Maquoketa Shale samples (70 mg/g). The range of hydrogen index measures for each formation/group can be considerable. As examples, hydrogen index for the Kansas City Group samples ranges from 13 to 505 mg/g; Chattanooga Shale samples, 210 to 490 mg/g; and Simpson Group samples, 11 to 1,160 mg/g.
Table 5--Median values of organic carbon, hydrogen index, and genetic potential for core, sidewall core, and well cuttings of shale samples from the Upper Pennsylvanian Shawnee Group, Lansing Group, and Kansas City Group, Middle Pennsylvanian Marmaton Group, Cherokee Group, Upper Devonian-Lower Mississippian Chattanooga Shale, Upper Ordovician Maquoketa Shale, and shale and limestone samples from the Middle Ordovician Simpson Group in the Forest City basin and adjacent areas. (Data are listed in appendices 3 and 4.)
| Organic carbon (weight %) |
Hydrogen Index (mg/g)a |
Genetic Potential (mg/g)b |
|
|---|---|---|---|
| Shawnee Group (n = 5) | 10.1 (5.2-21.0) |
220 (205-365) |
22 (12-51) |
| Lansing Group (n = 3) | 10.0 (2.0-15.2) |
130 (19-415) |
21 (0.43-43) |
| Kansas City Group (n = 46) | 12.1 (0.9-30.8) |
295 (13-505) |
32 (0.5-150) |
| Pleasanton Group (n = 2) | * (4.4-8.0) |
* (120-140) |
* (5.7-12) |
| Marmaton Group (n = 9) | 9.9 (1.1-21.6) |
220 (38-400) |
23 (0.8-64) |
| Cherokee Group (n = 11) | 5.0 (1.1-14.9) |
170 (26-410) |
6.1 (0.6-49) |
| Chattanooga Shale (n = 16) | 3.6 (1.9-4.4) |
350 (210-490) |
25 (8-57) |
| Maquoketa Shale (n = 3) | 1.5 (0.3-3.1) |
70 (60-90) |
1.0 (0.2-2.3) |
| Simpson Group (n = 22) | 1.1 (0.3-15.8) |
370-380 (11-1,150) |
4.0 (0.3-180) |
| HC = hydrocarbons, TOC = total organic carbon. n = number of samples. * = value not calculated. a = S2/TOC, mg HC/g TOC. b = S1 + S2, mg HC/g TOC. Summaries for the Chattanooga Shale are based on cores only. |
|||
Figure 6--Stacked bar histogram of hydrogen indices for samples from the Middle Ordovician Simpson Group, Upper Ordovician Maquoketa Shale, Upper Devonian-Lower Mississippian Chattanooga Shale, Middle Pennsylvanian Cherokee and Marmaton Groups, and Upper Pennsylvanian Kansas City (KC), Lansing (L), and Shawnee Groups from the Forest City basin and adjacent areas. Boundaries for organic facies D through A are from Jones (1987) and are discussed in the text.
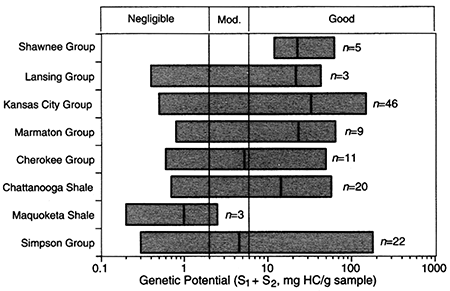
Ranges and median values of genetic potential for samples from each formation/group are listed in table 5 and shown in fig. 7. Median genetic potential is highest for shale samples from the Kansas City Group (32 mg/g), Chattanooga Shale (25 mg/g), Marmaton Group (23 mg/g), Shawnee Group (22 mg/g), and Lansing Group (21 mg/g). Lower median values were measured for shale samples from the Pleasanton Group (between 5.7 and 12 mg/g), Cherokee Group (5.0 mg/g), and Simpson Group shales and limestones (4.0 mg/g). The lowest median value was for the Maquoketa Shale (1.0 mg/g). As was the case for hydrogen index, the range of genetic potential for each formation/group can be considerable. As examples, genetic potential for the Kansas City Group samples ranges from 0.5 to 150 mg/g, Chattanooga Shale samples, 8 to 57 mg/g, and Simpson Group samples, 0.3 to 180 mg/g.
Figure 7--Median values and ranges of genetic potential for samples from the Middle Ordovician Simpson Group, Upper Ordovician Maquoketa Shale, Upper Devonian-Lower Mississippian Chattanooga Shale, Middle Pennsylvanian Cherokee and Marmaton Groups, and Upper Pennsylvanian Kansas City, Lansing, and Shawnee Groups from the Forest City basin and adjacent areas. Number of observations = n.
For all stratigraphic units, Tmax of organic matter generally increases from north to south. Tmax ranges from 411° to 433°C for shales from the Kansas City, Lansing, and Shawnee Groups from southwestern Iowa, northwestern Missouri, and Nemaha and Doniphan counties, Kansas (locations 1, 2, and 4-11, figs. 2B and 8C). For the Upper Pennsylvanian rocks in the southwestern and southern parts of the basin, Tmax is more variable, ranging from 423° to 439°C at locations 12 and 13 in Wabaunsee and Bourbon counties, Kansas, to 434° to 444°C at location 3 in southwestern Wabaunsee County (figs. 2B and 8C). Tmax ranges from 421° to 436°C for organic matter in the Cherokee and Marmaton Groups at location 14 in Clarke County, Iowa, and locations 2 and 10 in Nemaha and Doniphan counties in northeastern Kansas (figs. 2B and 8C). For the Middle Pennsylvanian rocks in the southwestern and southern parts of the basin, Tmax ranges from 436° to 460°C for cuttings samples from location 3 in southwestern Wabaunsee County, Kansas, and location 15 in Bates County, Missouri, and for core samples from location 16 in Greenwood County, Kansas, on the northern edge of the Cherokee platform (figs. 2B and 8C).
Figure 8--Maps of the Forest City basin area showing the mean Rock-Eval© Tmax for organic matter in (A) limestones and shales from the Middle Ordovician Simpson Group and Upper Ordovician Maquoketa Shale, (B) Upper DevonianLower Mississippian Chattanooga Shale, and (C) shales from the Middle Pennsylvanian Cherokee and Marmaton Groups and Upper Pennsylvanian Pleasanton, Kansas City, Lansing, and Shawnee Groups. Tmax measures < 435°C are immature with respect to petroleum generation; Tmax measures from 435° to 470°C are mature (Peters, 1986).
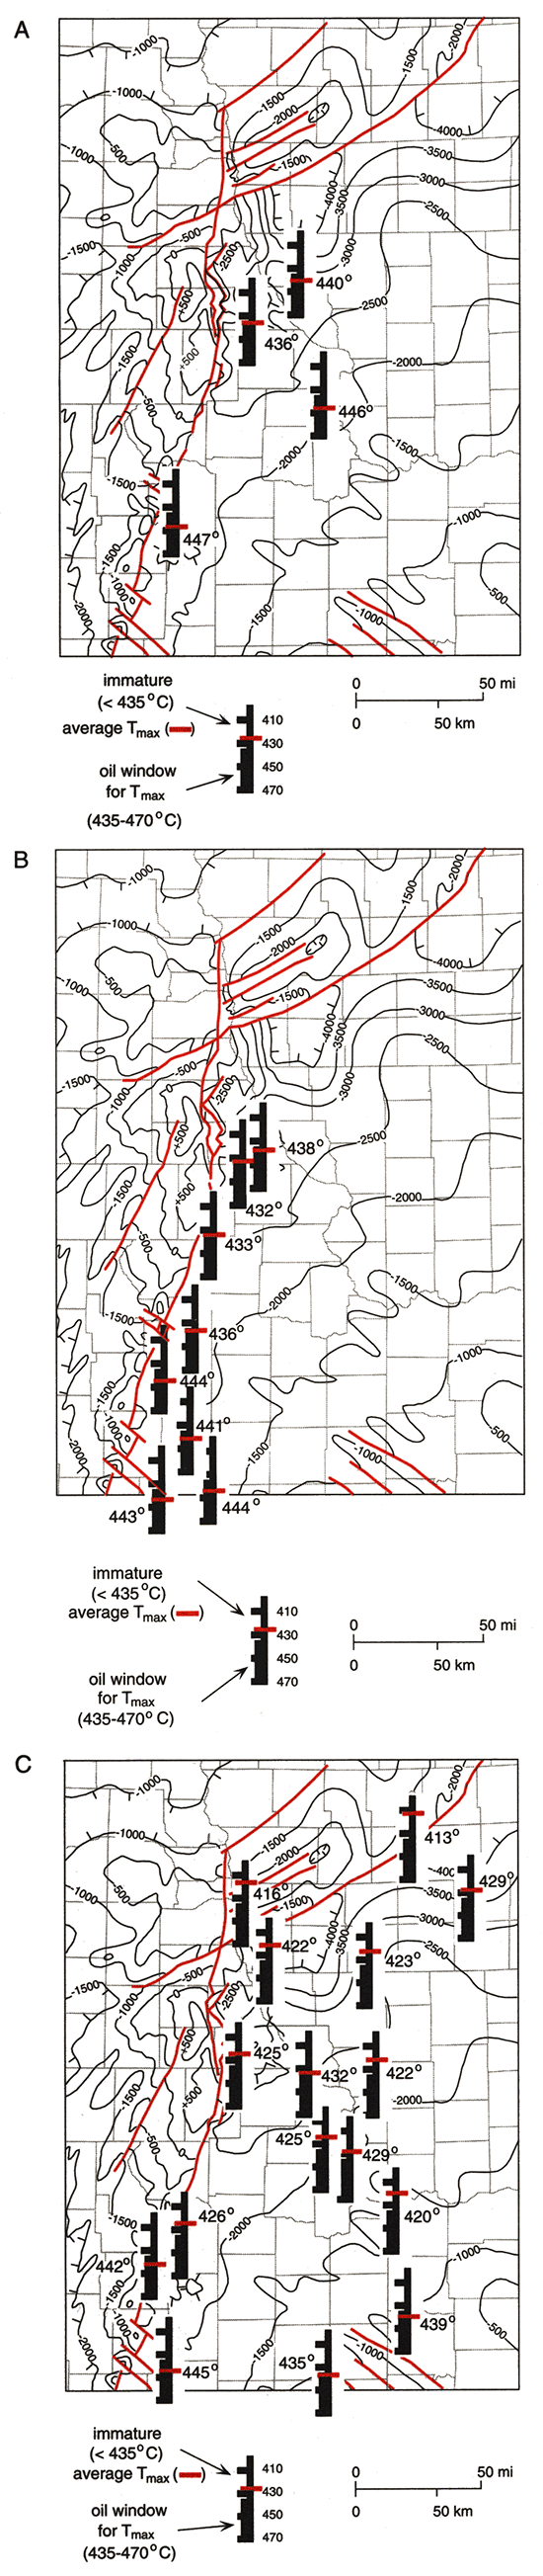
A similar general increase in Tmax from north to south is characteristic of organic matter in the Chattanooga Shale (figs. 2B and 8B) and in the Simpson Group (figs. 2B and 8A). For the Chattanooga Shale, Tmax ranges from 431° to 438°C at location 17 in Richardson County, Nebraska; location 2 in Nemaha County, Kansas; and at location 12 in Wabaunsee County, Kansas. Tmax ranges from 440° to 445°C in a sample of cuttings from location 3 in Wabaunsee County, Kansas, and in core samples from locations 19-21 in Lyons and Greenwood counties, Kansas. For the Simpson Group, Tmax of organic matter ranges from 436° to 444°C at location 22 in Atchison County, Missouri; from 441° to 446°C at location 2 and 10 in Nemaha and Doniphan counties, Kansas; and from 433° to 447°C for Simpson Group rocks at location 12 in Wabaunsee County, Kansas.
Vitrinite-reflectance (Ro) measures (appendix 4) range from 0.39%? to 0.59% for six samples from the Kansas City, Lansing, and Shawnee Groups from locations 2 and 10 in Nemaha and Doniphan counties, Kansas. The range is from 0.55% to 0.60% for four samples from location 3 in southwestern Wabaunsee County, Kansas. R, ranges from 0.47% to 0.56% for three Cherokee Group samples from locations 2 and 10 in Nemaha and Doniphan counties, Kansas; for the one sample from location 3 in Wabaunsee County, Kansas, R, is 0.70%. For two Chattanooga Shale samples from locations 2 and 18 in Nemaha County, Kansas, Ro is 0.58% and 0.63%; for the one Chattanooga Shale sample at location 3, R, is 0.60%, which is less than the R, (0.70%) of the Cherokee Group sample 200 ft (61 m) higher in the section.
For the Forest City basin in Iowa, Missouri, and northeastern Kansas, production indices (for samples with ≥1.0% TOC) are ≤0.10 for 66 of 69 samples from the Middle and Upper Pennsylvanian shales for four of 17 Chattanooga Shale samples, for two of three Maquoketa Shale samples, and for 13 of 14 Simpson Group shale and limestone samples.
Rock-extract CompositionsSaturated hydrocarbon distributions from extracts of potential hydrocarbon-source rocks from the Forest City basin follow four chromatographic patterns (figs. 3D-G). The first pattern (fig. 3D), typical of four shale samples in the Simpson Group, is characterized by a dominance of odd-carbon number n-alkanes between nC10 and nC20, relatively small amounts of branched and cyclic alkanes, and relatively small amounts of n-alkanes with carbon numbers greater than nC19. The second pattern (fig. 3E), typical of three samples of the Chattanooga Shale, is characterized by smoothly decreasing amounts of n-alkanes, and the presence of intermediate contents of isoprenoids (e.g., pristane and phytane). The third pattern (fig. 3F), typical of distributions from 16 samples of Middle and Upper Pennsylvanian shales, is primarily characterized by pristane and phytane dominant or equal in abundance to the n-alkanes. The fourth pattern (fig. 3G) from the Marmaton Group coal (MCI21-4) is characterized by pristane dominant over the other isoprenoids and the n-alkanes.
Pristane/phytane, pristane/nC17 and carbon-preference number for the n-alkanes between nC12 and nC20 for the rock extracts are listed in table 3. Median values and ranges are summarized in table 4. Pristane/nC17 versus nC12-nC20 CPI for the rock extracts is illustrated in fig. 4B. Figure 4B shows major differences in pristane/nC17 versus nC12-nC20 CPI. For Simpson Group shale extracts, pristane/nC17 ranges from 0.05 to 0.07, for Chattanooga Shale extracts, 0.50 to 0.83, for Upper Pennsylvanian shale extracts, 0.60 to 2.8, and for Middle Pennsylvanian shale extracts, 1.1 to 3.2. The nC12-nC20 CPI is higher for the two samples from the Simpson Group (1.4 and 1.4) compared to the Chattanooga Shale (1.1) sample or the seven Upper Pennsylvanian shale samples (1.0 to 1.1).
Measures of δ13C of the saturated and aromatic hydrocarbon fractions from extracts from 12 rock samples are listed in table 3. δ13Csat for extracts from five Kansas City Group shales and two Chattanooga Shale samples are more negative (range = -28.3 to -29.4‰) than δ13Csat of extracts for the Marmaton Group shale and three Simpson Group samples (range = -25.6 to -26.6‰). Measures of δ13Carom show similar distributions with a δ13Carom range of -27.9 to -29.2‰ for extracts of the Kansas City Group shales and Chattanooga Shale samples, and a δ13Carom range of -25.6 to -26.6‰ for extracts of the Marmaton Group shale and three Simpson Group samples.
The relative amounts of tricyclic (peaks 2-5, 7-8), C24 tetracyclic (peak 6), and pentacyclic (peaks 9-13) terpanes from rock extracts are shown in figs. 5D-G. The terpane distribution in fig. 5D is typical of shales from the Simpson Group and is characterized by minimal amounts of the tricyclic terpanes compared to the pentacyclic terpanes, and C24 tetracyclic terpane greater than tricyclic terpanes. The terpane distributions from the Chattanooga Shale (fig. 5E) is characterized by equivalent amounts of tricyclic and pentacyclic terpanes, with hopane (C30, peak 10) the most abundant pentacyclic terpane, C23 (peak 3) the most abundant tricyclic terpane, relatively abundant extended tricyclic compounds (C28 and C29 doublets, peaks 5 and 7), and relatively low amounts of C24 tetracyclic terpane. The terpane distribution from the Kansas City Group offshore shale (fig. 5F) is similar to that of the Chattanooga Shale except that the pentacyclic terpanes are relatively more abundant than tricyclic terpanes. The terpane distribution from the extract of the Marmaton Group coal (fig. 5G) is similar to those of the Simpson Group shales.
For a rock interval to be an effective source of hydrocarbons, a minimum amount of organic matter must be present, and this organic matter must be thermally mature with respect to petroleum generation. The amounts and compositions (oil and/or gas) of generated hydrocarbons are determined by the composition and thermal maturity of the organic matter.
Ronov (1958) investigated some 26,000 samples of different ages and environments from oil and nonoil provinces. This work demonstrated that average organic carbon content was 1.4% for nonreservoir shale-type sediments in petroliferous areas, compared to an average of 0.4% for areas that were nonpetroliferous. Based on this study, Ronov (1958) estimated a critical minimum organic-carbon content of 0.5% for a shale to be an effective hydrocarbon source rock. Based on this 0.5% organic carbon minimum, the organic-carbon contents listed in appendices 3 and 4 show that most sampled intervals of the Middle and Upper Pennsylvanian offshore shales, Middle Pennsylvanian coals, Chattanooga Shale, Maquoketa Shale, and Simpson Group shales and limestones qualify as potential hydrocarbon source rocks.
Jones (1987) defines a series of organic facies (A-D) for rocks worldwide based on microscopic characteristics, hydrogen and oxygen indices, and HlC ratios of organic matter that is marginally mature with respect to petroleum generation (Ro ~ 0.50%). Stacked bar histograms of hydrogen indices and organic facies (A-D) for samples from the Forest City basin are shown in fig. 7. In the Jones (1987) classification, organic matter in organic facies A is characterized by HI > 850 mg/g; facies AB, ≅ 850 to 650 mg/g; facies B, ≅ 650 to 400 mg/g; facies BC, ≅ 400 to 250 mg/g; facies C, ≅ 250 to 125 mg/g; facies CD, ≅ 125 to 50 mg/g; and facies D, ≤ 50 mg/g. Organic matter in organic facies A is either almost entirely recognizable algal remains, often of a single genus or amorphous clumps of a probable combined algal and bacterial origin. Recognizable terrestrial organic matter is negligible. Organic facies AB is usually dominated by highly fluorescent amorphous kerogen of mixed algal and bacterial origin. Terrestrially derived organic matter may be present in detectable amounts. The primary precursor biomass for organic facies B is marine/nonmarine algae and associated bacteria in various stages of decomposition. Terrestrial organic input can be quite variable. Organic facies BC usually is composed of a mixture of partially degraded terrestrial and algal material. Alternatively, this facies can be created by insertion of substantial amounts of terrestrially derived organic matter into an anoxic water column. Organic facies C is usually dominated by terrestrial debris in various stages of oxidation; facies CD is moderate to well-oxidized organic matter, whereas, organic matter in organic facies D is either highly oxidized or redeposited residual organic matter (Jones, 1987).
The volume and type of generated hydrocarbons vary widely with organic facies. Organic facies A is the most oil-generative facies, but is rare in marine shales. Facies AB rocks are prolific sources of oil. Organic facies B is the source of most of the world's oil. Organic facies BC has capacity to generate both oil and gas. Hydrocarbons generated from organic facies C are nearly always condensate and gas; organic facies C coals can generate prodigious amounts of gas. Organic facies CD has a moderate capacity for dry-gas generation, whereas, organic facies D is essentially nongenerative (Jones, 1987).
As summarized in table 5 and shown in fig. 6, organic matter compositions in the Middle and Upper Pennsylvanian shales from the Forest City basin primarily represent organic facies BC, and C, with compositions ranging from facies B through facies D. Organic matter in the Kansas City Group marine shales are more hydrogen rich (median HI = 295 mg/g, organic facies BC), compared to organic matter in the other Pennsylvanian groups (median HI from 220 to 130 mg/g, organic facies C and CD). Where thermally mature, organic matter in the Kansas City Group rocks should generate both oil and gas, whereas, organic matter in the other Pennsylvanian groups should primarily generate gas with some oil. Organic matter in the Chattanooga Shale primarily represents organic facies BC (median HI = 350 mg/g) with the range in compositions from organic facies B to D. Where thermally mature, this organic matter should generate both oil and gas. Organic matter in the Maquoketa Shale falls into organic facies CD and should have little hydrocarbon-generation potential. The Simpson Group shales and limestones have the widest range in organic-matter compositions, from organic facies A to D. Where thermally mature, the intervals containing organic matter with facies A, AB, and B compositions should primarily be source rocks for oil. One additional note: terrestrial organic matter cannot possibly be a component in any sample of the Maquoketa Shale and Simpson Group, as these units predate the evolution of land plants (Tissot and Welte, 1978, p. 18).
Genetic potential (S1 + S2, mg HC/g sample) is a summary measure of the relative potential of the rock to generate hydrocarbons and is dependent on the amount, type, and thermal maturity of organic matter. Tissot and Welte (1978, p. 447) suggest the following classification of genetic potential:
<2 mg/g: little or no source-rock potential,
≥2 mg/g and ≤6 mg/g: moderate source-rock potential,
>6 mg/g: good source-rock potential.
Median values and ranges of genetic potential listed in table 4 are illustrated in fig. 7. Based on the classification scheme of Tissot and Welte (1978, p. 447), intervals within the Shawnee, Lansing, Kansas City, and Pleasanton Groups, the Cherokee and Marmaton Groups, the Chattanooga Shale, and the Simpson Group all have median genetic potentials of >6 mg/g to »6 mg/g, indicating good to excellent potential to generate hydrocarbons. The good to excellent hydrocarbon source-rock potential shown for these stratigraphic intervals in the Forest City basin are consistent with results reported for these same intervals in other areas in the midcontinent region (e.g., Anadarko basin, Burruss and Hatch, 1989; Cherokee platform, Hatch et al., 1989; Iowa shelf, Hatch et al., 1987, and Jacobson et al., 1988) and in the Illinois basin (Hatch et al., 1991).
Median genetic potential for the Maquoketa Shale in the Forest City basin indicates generally poor potential to generate hydrocarbons. This generally poor potential for the Maquoketa Shale is similar to that for most samples of the laterally equivalent Upper Ordovician Sylvan Shale in the Anadarko basin (Burruss and Hatch, 1989, their fig. 3).
The main zone of oil generation occurs over an R, range of about 0.5-0.7% to 1.3%, which corresponds to a Tmax of 435° to 460°C (Tissot and Welte, 1978, p. 450- 455). Tmax values of 411° to 433°C for shales from the Kansas City, Lansing, and Shawnee Groups from southwestern Iowa, northwestern Missouri, and Nemaha and Doniphan counties, Kansas, show that organic matter in these shales is immature with respect to petroleum generation. Tmax values of 423° to 439°C for Upper Pennsylvanian shales in Wabaunsee and Bourbon counties, Kansas, indicate immature to marginally mature organic matter. In southwestern Wabaunsee County, Kansas, Tmax values of 434° to 444°C indicate marginally mature to thermally mature organic matter. Tmax values of 421° to 436°C in shale samples from the Cherokee and Marmaton Groups in Clarke County, Iowa, and in Nemaha and Doniphan counties, Kansas, suggest immature to marginally mature organic matter. Tmax values range of 436° to 460°C for samples in southwestern Wabaunsee County, Kansas; Bates County, Missouri; and Greenwood County, Kansas, indicate marginally mature to mature organic matter. This general north-to-south increase (from immature to mature) in organic-matter thermal maturity in the Upper and Middle Pennsylvanian shales is shown in fig. 8C where mean Tmax values are plotted.
This general north-to-south increase (from immature to mature) in thermal maturity is also true for organic matter in the Chattanooga Shale (fig. 8B) and the Simpson Group (fig. 8A). Tmax measures of 431° to 438°C for the Chattanooga Shale in Richardson County, Nebraska, and Nemaha and Wabaunsee counties, Kansas, suggest immature to marginally mature organic matter, whereas, Tmax of 440° to 445°C for the Chattanooga Shale in southwestern Wabaunsee, Lyons, and Greenwood counties, Kansas, suggest thermally mature organic matter. Tmax measures of 436° to 444°C for the Simpson Group shales and limestones in Nemaha and Doniphan counties, Kansas, Tmax of 441° to 446°C in Atchison County, Missouri, and 433° to 447°C in Wabaunsee County, Kansas, all suggest marginally mature to thermally mature organic matter.
Production indices ≥0.10 are interpreted to mean that significant hydrocarbon generation has occurred (Espitalie et al., 1977; Tissot and Welte, 1978, p. 445-447). PI is < 0.10 for 63 of 72 samples from the Middle and Upper Pennsylvanian shales, indicating that significant generation of hydrocarbons has not occurred. This conclusion supports previously interpreted Tmax values above, where we concluded that most organic matter in the Middle Upper Pennsylvanian shales is thermally immature to marginally mature with respect to petroleum generation. For eight of the nine Middle and Upper Pennsylvanian shale samples with PI ≥ 0.10, organic carbon contents are low, ranging from 0.9 to 2.6%. This relationship suggests that these high relative PI values may represent migrated hydrocarbons. PI ratios ≥ 0.10 for 13 of 17 Chattanooga Shale samples suggest that hydrocarbon generation has occurred in these rocks. PI ratios < 0.10 for 15 of 16 Simpson Group shale and limestone samples also indicate that significant generation of hydrocarbons has not occurred. The six Simpson Group samples with ≤ 2% TOC, and PI ≥ 0.17 may also indicate migrated hydrocarbons.
Oil-source rock correlations are based on comparisons of oil geochemistry with the geochemistry of bitumens extracted from potential source rocks. Bitumens and oils are most easily correlated by comparison of saturated hydrocarbon and terpane (m/z = 191) distributions, and carbon-isotope compositions of the saturated and aromatic hydrocarbon fractions. For oils (migrated bitumens) these parameters are affected by biodegradation in the reservoir and, possibly, by migration distance. Detailed discussions of the geologic/geochemical controls of bitumen and oil chemistries are beyond the scope of this paper. For an extensive introduction to these topics, refer to texts by Tissot and Welte (1978,1984), and Hunt (1979); for indepth reviews of biomarkers, refer to Mackenzie (1984) and Peters and Moldowan (1993).
Comparison of the compositions of the Group 1 oils in the Forest City basin with the compositions of extracts of the Simpson Group shales in the basin show similar saturated hydrocarbon and terpane distributions (figs. 3A and SA; 3D and 5D, respectively) and pristane/nC17 versus nC12-nC20 CPI (figs. 4A and 4B). These similarities suggest that the Simpson Group shales are the source rocks for these oils.
δ13Csat of the Group 1 oils ranges from -26.8‰ to -31.3‰; δ13Carom, from -26.2‰ to -31.1 ‰ (table 2). δ13 compositions of the three extracts of the Simpson Group rocks from Wabaunsee County (δ13Csat range from -25.6‰ to -26.4‰, δ13Carom from -25.4 to -26.7‰, table 3) are similar to the positive end of this range. A better match in the observed ranges of δ13Csat and δ13Carom for the Group 1 oils is with the range of composition observed (δ13Csat from -24.5 to -31.1‰, δ13Carom from -23.7 to -31.3‰) in extracts of Simpson Group-equivalent rocks in Washington and Jackson counties, in east-central and eastern Iowa (Hatch et al., 1991, their table 24-2). Because of the similar range of carbon isotope compositions of Forest City basin oils and rocks extract from Washington and Jackson counties, Iowa, we assume that our samples of the Simpson Group rocks in the Forest City basin show only a limited part of the range of organicmatter carbon-isotope compositions that are actually present.
The fact that these oils were generated from Middle Ordovician source rocks, but are now produced from stratigraphically higher units (e.g., Viola Limestone, Maquoketa Shale, and "Hunton Group" along the axis of the basin and from Pennsylvanian- and Mississippian-age horizons at the Easton and Vassar fields, respectively) indicates that vertical migration of these oils has occurred at many localities. Faults and fractures associated with development of the oil-bearing structures are the likely conduits for this migration.
The Group 1 oils are geochemically similar to Ordovician oils that are produced from other areas in the midcontinent region including the Iowa shelf (Hatch et al., 1991, their Group 1 oil), Salina-Sedgwick basin (Longman and Palmer, 1987; Hatch et al., 1987), and Anadarko basin (Burruss and Hatch, 1989, their Type 1 oil). Additionally, the Group 1 oils are geochemically similar to oils produced from the Ordovician Galena Group in the Illinois basin (Hatch et al., 1991, their Group 1 oils).
Group 2 oils and extracts of the Chattanooga Shale have similar saturated hydrocarbon and terpane distributions (figs. 3B and 3E; 5B and 5E), pristane/ phytane (table 3), pristane/nC17 versus nC12-nC20 CPI (figs. 4A and 4B), and δ13Csat and δ13Carom measures, which indicate that the Chattanooga Shale is the most likely source for these oils. Although the Chattanooga Shale is thermally mature with respect to petroleum generation in the southern part of the Forest City basin, the ultimate origin of the Group 2 oils in the eastern production trend is subject to speculation. Some researchers (Rich, 1933; Price, 1980) favor a scenario in which these hydrocarbons were generated in the Anadarko and/or Arkoma basins in Oklahoma and underwent long-distance migration into Kansas.
Oils geochemically similar to the Group 2 oils are produced from: I) the Cherokee Group, in the Cherokee basin to the south of the Forest City basin (Hatch et al., 1989); 2) Silurian, Devonian, and Mississippian rocks in the Anadarko basin in western Oklahoma and south-central and southwestern Kansas (Burruss and Hatch, 1989, their Type 2 oil); and 3) Silurian, Devonian, Mississippian, and Pennsylvanian rocks in the Illinois basin (Hatch et al., 1991, their Group 3 oils). Identified source rock for the Group 2 equivalent oils on the Cherokee platform is the Chattanooga Shale (Hatch et al., 1989), in the Anadarko basin, the Woodford Shale (Burruss and Hatch, 1989), and in the Illinois basin, the New Albany Group (Hatch et al., 1991). The Chattanooga Shale, Woodford Shale, and the New Albany Group all are of Late Devonian-Early Mississippian age.
The Group 3 oil and extracts from the thin widespread Middle and Upper Pennsylvanian shales (offshore shales of Heckel, 1977) have similar saturated hydrocarbon and terpane distributions (figs. 3C and 3F; 5C and SF, respectively) and similar δ13Csat and δ13Carom compositions which suggest that these shales are the most likely source rocks for this oil. The Group 3 oil is differentiated from the Group 2 oils by a lower pristane/phytane ratio (Group 3 oil, 0.9; Group 2 oil median, 1.6; table 3) and a higher pristane/nC17 ratio (Group 3 oil, 3.1; Group 2 oil median, 0.56; table 3 and fig. 4A). This differentiation between Oil Groups 2 and 3 may become less clear, however, when additional Group 3 oils in the Forest City basin are identified, because extracts of Middle and Upper Pennsylvanian shales show significant ranges of pristane/phytane 0.0 to 2.0, table 3) and pristane/nC17 (0.6-3.2, table 3, fig. 4B). It is unlikely, however, that Group 3 oils will be widespread in the Forest City basin, because the Pennsylvanian shales are thermally mature only in the southwestern corner of the basin.
The immature conditions generally found within the Pennsylvanian System in the Forest City basin indicate that Group 3 oils will be uncommon. However, local hot spots and a migration system where the source rock is located very near the potential reservoir may lead to commercial accumulations of Group 3 oils. Attention to formation evaluations of Pennsylvanian strata in existing oil fields may lead to overlooked pay zones containing this type of oil.
Oils geochemically similar to the Group 3 oils from the Forest City basin are produced from Pennsylvanian-age reservoir rocks in the Anadarko basin in western Oklahoma and south-central and southwestern Kansas (Burruss and Hatch, 1989, their Type 3 oil). Burruss and Hatch (1989) identify the Middle and Upper Pennsylvanian marine black shales as the primary source rocks for the Type 3 oils in the Anadarko basin.
The saturated hydrocarbon and terpane distributions, and pristane/phytane, pristane/nC17, from the Marmaton Group coal are dissimilar to those of any of the 26 oils studied, which suggests that the Pennsylvanian coals in the Forest City basin are not effective source rocks for liquid hydrocarbons.
We appreciate the following organizations for their active support in the acquisition of core and surface-mine samples: Iowa Department of Natural Resources, Geological Survey Bureau, Iowa City, Iowa; Missouri Department of Natural Resources, Division of Geology and Land Survey, Rolla, Missouri; Kansas Geological Survey, Lawrence, Kansas; and Marathon Oil Company, Littleton, Colorado. Some of the analytical data were supplied by Ted A. Daws, Paul H. Briggs, J. David King, Cliff D. Taylor, Charles N. Threlkeld, Robert B. Vaughn, April K. Vuletich, and Augusta Warden. This manuscript has benefited from reviews by Ronald Charpentier, Robert Burruss, and two anonymous reviewers. William J. Betterton and Lisa Bader helped draft the illustrations. Trade and company names are for descriptive purposes only and do not imply endorsement by the U.S. Geological Surveyor the Kansas Geological Survey.
Anders, D. E., Magoon, L. B., and Lubeck, Sister C., 1987, Geochemistry of surface oil shows and potential source rocks; in, Petroleum Geology of the Northern Part of the Arctic National Wildlife Refuge, Northeastern Alaska, K. J. Bird and L. B. Magoon, eds.: U.S. Geological Survey, Bulletin 1778, p. 181-198.
Anderson, K. H., and Wells, J. S., 1968, Forest City basin of Kansas, Nebraska, and Missouri: American Association of Petroleum Geologists, Bulletin, v. 52, p. 264-281.
Baker, D. R., 1962, Organic geochemistry of the Cherokee Group in southeastern Kansas and northeastern Oklahoma: American Association of Petroleum Geologists, Bulletin, v. 46, p. 1,621-1,642.
Bray, E. E., and Evans, E. D., 1961, Distribution of n-paraffins as a clue to recognition of source beds: Geochimica et Cosmochimica Acta, v. 22, p. 2-15.
Burchett, R. R., Paul, S. E., Deason, K. L., Netzler, B. W., and Anderson, R. R., 1983a, Deep well and oil-gas field location map of the Forest City basin and adjacent regions of Iowa, Kansas, Missouri, and Nebraska: Kansas Geological Survey, 1 sheet, 1:500,000 map.
Burchett, R. R., Wilson, F. w., Anderson, R. R., and Kisvarsanyi, E. B., 1983b, Precambrian configuration map of the Forest City basin and adjacent regions of Iowa, Kansas, Missouri, and Nebraska: Kansas Geological Survey, 1 sheet, 1:500,000 map.
Burruss, R. C., and Hatch, J. R., 1989, Geochemistry of oils and hydrocarbon source rocks, greater Anadarko basin--Evidence for multiple sources of oils and long distance oil migration: Oklahoma Geological Survey, Circular 90, p. 53-64.
Carlson, M. P., 1971, Eastern Nebraska and north-central Kansas; in, Future Petroleum Provinces of the United States--Their Geology and Potential, J. H. Cram, ed.: American Association of Petroleum Geologists, Memoir 15, p. 1,103- 1,107.
Ebanks, W. J., Jr., and Weber, J. F., 1987, Shallow heavy-oil deposit in a Pennsylvanian fluvial sandstone reservoir, Eastburn field, Missouri; in, Exploration for Heavy Crude Oil and Natural Bitumen, R. F. Meyer, ed.: American Association of Petroleum Geologists, Studies in Geology 25, p. 327-339.
Ebanks, W. J., Jr., Brady, L. L., Heckel, P. H., O'Connor, H. G., Sanderson, G. A., West, R. R., and Wilson, F. W., 1979, The Mississippian and Pennsylvanian (Carboniferous) systems in the United States--Kansas: U.S. Geological Survey, Professional Paper 1110-Q, p. QI-Q30.
Ece, O. E., 1989, Organic maturation and paleoceanographicl paleogeographic implications of the Desmoinesian cyclothemic Excello black shale of the midcontinent, USA: Shale Shaker, March/April, p. 90-104.
Espitalié, J., Laporte, J. L., Madec, M., Marquis, F., Leplat, P., Paulet, J., and Boutefeu, A., 1977, Methodé rapide de caractérisation des roches méres, et de leur potentiel pétrolier et de leur degré d'évolution: Revue de l'Institut Francais de Pétrole, v. 32, p. 23-42.
Förster, A., and Merriam, D. F., 1994, Some aspects of geothermics in basin analysis: Papers and extended abstracts, International Association for Mathematical Geology Annual Conference, Mont Treblant, Quebec, Canada, p. 130-140.
Gautier, D. L., Dolton, G. L., Takahashi, K. I., and Varnes, K. L., eds., 1996, 1995 National assessment of United States oil and gas resources--Results, methodology, and supporting data: U.S. Geological Survey, Digital Data Series 30, (Release 2) one CD-ROM.
Hatch, J. R., and Leventhal, J. S., 1992, Relationship between inferred redox potential of the depositional environment and geochemistry of the Upper Pennsylvanian (Missourian) Stark Shale Member of the Dennis Limestone, Wabaunsee County, Kansas, USA: Chemical Geology, v. 99, p. 65-82.
Hatch, J. R., and Leventhal, J. S., 1997, Early diagenetic partial oxidation of organic matter and sulfides in the Middle Pennsylvanian (Desmoinesian) Excello Shale Member of the Fort Scott Limestone and equivalents, northern midcontinent region, USA: Chemical Geology, v. 134, p. 215-235.
Hatch, J. R., Daws, T. A., Lubeck, Sister C. M., Pawlewicz, M. J., Threlkeld, C. N., and Vuletich, A. K., 1984, Organic geochemical analyses for 247 organic-rich rocks and 11 oil samples from the Middle Pennsylvanian Cherokee and Marmaton Groups, southeastern Iowa, Missouri, southeastern Kansas, and northeastern Oklahoma: U.S. Geological Survey, Open-file Report 84-160,39 p.
Hatch, J. R., Jacobson, S. R., Witzke, B. J., Risatti, J. B., Anders, D. E., Watney, W. L., Newell, K. D., and Vuletich, A. K., 1987, Possible late Middle Ordovician organic carbon isotope excursion--Evidence from Ordovician oils and hydrocarbon source rocks, midcontinent and east-central United States: American Association of Petroleum Geologists, Bulletin, v. 71, p. 1,342-1,354.
Hatch, J. R., King, J. D., and Daws, T. A., 1989, Geochemistry of Cherokee Group oils of southeastern Kansas and northeastern Oklahoma: Kansas Geological Survey, Subsurface Geology Series 11, 20 p. [available online]
Hatch, J. R., Risatti, J. B., and King, J. D., 1991, Geochemistry of Illinois basin oils and hydrocarbon source rocks; in, Interior Cratonic Basins, M. W. Leighton, D. R. Kolata, D. F. Oltz, and J. J. Eidel, eds.: American Association of Petroleum Geologists, Memoir 51, p. 403-423.
Heckel, P. H., 1977, Origin of phosphatic black shale facies in Pennsylvanian cyclothems of midcontinent North America: American Association of Petroleum Geologists, Bulletin, v. 61, p. 1,045-1,068.
Heckel, P. H., , 1991, Thin, widespread Pennsylvanian black shales of midcontinent North America, a record of a cyclic succession of widespread pycnoclines in a fluctuating epeiric sea; in, Modern and Ancient Continental Shelf Anoxia, R. V. Tyson and T. H. Pearson, eds.: Geological Society (London), Special Publication, v. 58, p. 259-273.
Hunt, J. M., 1979, Petroleum geochemistry and geology: W. H. Freeman, San Francisco, 615 p.
James, G. W., 1970, Stratigraphic geochemistry of a Pennsylvanian black shale (Excello) in the midcontinent and Illinois basin: Ph.D. dissertation, Rice University, 102 p.
Jacobson, S. R., Hatch, J. R., Teerman, S. C., and Askin, R. A., 1988, Middle Ordovician organic matter assemblages and their effect on Ordovician-derived oils: American Association of Petroleum Geologists, Bulletin, v. 72, p. 1,090-1,100.
Jewett, J. M., 1954, Oil and gas in eastern Kansas: Kansas Geological Survey, Bulletin 104, 397 p.
Jones, R. W., 1987, Organic facies; in, Advances in Petroleum Geochemistry, Volume 2, J. Brooks and D. Welte, eds.: Academic Press, London, p. 1-90.
Longman, M. W., and Palmer, S. E., 1987, Organic geochemistry of midcontinent Middle and Late Ordovician oils: American Association of Petroleum Geologists, Bulletin, v. 71, p. 938-950.
Mackenzie, A. S., 1984, Applications of biological markers in petroleum geochemistry; in, Advances in Petroleum Geochemistry, Volume 1,1. Brooks and D. Welte, eds.: Academic Press, London, p. 115-214.
Newell, K. D., Watney, W. L., Stephens, B. P., and Hatch, J. R., 1987, Hydrocarbon potential in Forest City basin: Oil and Gas Journal, v. 85, no. 42, p. 58-62.
Orr, W. L., 1983, Comments on pyrolytic hydrocarbon yields in source-rock evaluation; in, Advances in Organic Geochemistry 1981, M. Bjorøy, P. Albrecht, C. Cornford, K. deGroot, G. Eglinton, E. Galimov, D. Leythaeuser, R. Pelet, J. Rullkotter, and G. Speers, eds.: John Wiley, Chichester, p. 775-787.
Paul, S. E., Ross, 1. A., Wong, M. K.-W, Wong, R. K.-W, Ross, C. G., Beene, D. L., 1988, Oil and gas fields in Kansas: Kansas Geological Survey, Map M-18, 1:500,000 map.
Peters, K. E., 1986, Guidelines for evaluating petroleum source rock using programmed pyrolysis: American Association of Petroleum Geologists, Bulletin, v. 70, p. 318-329.
Peters, K. E., and Moldowan, J. M., 1993, The Biomarker Guide--Interpreting Molecular Fossils in Petroleum and Ancient Sediments: Prentice Hall, Englewood Cliffs, New Jersey, 363 p.
Price, L. C., 1980, Shelf and shallow basin oil as related to hotdeep origin of petroleum: Journal of Petroleum Geology, v. 3, p. 91-96.
Reed, J. D., Illich, H. A., and Horsfield, B., 1986, Biochemical evolutionary significance of Ordovician oils and their sources: Organic Geochemistry, v. 10, p. 347-358.
Rich, J. L., 1933, Distribution of oil pools in Kansas in relation to Mississippian structure and areal geology: American Association of Petroleum Geologists, Bulletin, v. 17, p. 793-815.
Ronov, A. B., 1958, Organic carbon in sedimentary rocks (in relation to presence of petroleum): Translation in Geochemistry, v. 5, p. 510-536.
Tissot, B. P., and Welte D. H., 1978, Petroleum formation and occurrence--A new approach to oil and gas exploration: Springer-Verlag, New York, 538 p.
Tissot, B. P., and Welte D. H., 1984, Petroleum formation and occurrence, 2nd revised and enlarged edition: Springer-Verlag, New York, 699 p.
U.S. Geological Survey, 1995, 1995 national assessment of United States oil and gas resources: U.S. Geological Survey, Circular 1118, 20 p.
Wang, H. D., and Philp, R. P., 1997, Geochemical study of potential source rocks and crude oils in the Anadarko basin, Oklahoma: American Association of Petroleum Geologists, Bulletin, v. 81, p. 249-275.
Waples, D. W., 1980, Time and temperature in petroleum generation and application of Lopatin's technique to petroleum exploration: American Association of Petroleum Geologists, Bulletin, v. 64, p. 916-926.
Wells, J. S., 1971, Forest City basin; in, Future Petroleum Provinces of the United States-Their Geology and Potential, J. H. Cram, ed.: American Association of Petroleum Geologists, Memoir 15, p. 1,098-1,103.
Wells, J. S., 1979, Inventory of heavy oil in western MissouriFinal report: U.S. Department of Energy, BETC-1808-1, 191 p.
Wells, J, S., and Anderson, K. H., 1968, Heavy oil in western Missouri: American Association of Petroleum Geologists, Bulletin, v. 52, p. 1,720-1,731.
Wenger, L. M., Baker, D. R., Chung, H. M., and McCulloh, T. H., 1988, Environmental control of carbon isotope variations in Pennsylvanian black-shale sequences, midcontinent, U.S.A.; in, Advances in Organic Geochemistry 1987, L. Mattavelli and L. Novelli, eds.: Organic Geochemistry, v. 13, p. 765- 771.
Kansas Geological Survey, Energy Research Section
Placed on web Aug. 7, 2014; originally published in 1999.
Comments to webadmin@kgs.ku.edu
The URL for this page is http://www.kgs.ku.edu/Publications/Bulletins/TS13/index.html