Kansas Geological Survey, Irrigation Series 5, originally published in 1979
Next Page--Supplemental Data
Originally published in 1979 as Kansas Geological Survey Irrigation Series 5. This publication is also available as an Acrobat PDF file (1.3 MB).
The agricultural economy of western Kansas is becoming increasingly dependent on irrigation from ground water. In Hodgeman and northern Ford Counties, most irrigation supplies are obtained from wells in the Dakota Formation. Therefore, a study of the availability and chemical quality of water in the formation is of great importance to continued irrigation development in the area.
Water in the Dakota generally occurs in sandstone beds that are quite variable in thickness, areal extent, and degree of cementation. Consequently, irrigation development may be restricted to those areas where adequate quantities of water are obtainable. Yields from existing wells range widely from about 100 to as much as 2,200 gallons per minute.
Results from several aquifer tests and data from well drillers indicate that much of the water in the sandstones is confined under artesian head. For this reason, water-level declines during pumping will be great, and mutual interference between wells could be significant.
The quality of water from the sandstones also is variable at different depths and from one area to another. Dissolved solids range from about 300 to 1,420 milligrams per liter. When used for irrigation, the water has a medium to very high salinity hazard and a low to very high sodium hazard. Thus, amendments commonly are needed for continued crop productivity.
Continued development of irrigation wells in the Dakota Formation is likely, and water levels are expected to decline significantly in the confined aquifers. Additional study will be needed in the future to assess the effects of increased irrigation development on the quantity and quality of ground water in storage.
Acre-foot--The amount of water needed to cover 1 acre to a depth of 1 foot, equals 325,851 gallons.
Alluvium--Unconsolidated deposits of clay, silt, sand, and gravel laid down by streams during comparatively recent geologic time.
Anhydrite--A widely distributed mineral consisting of anhydrous calcium sulfate; CaSO3.
Aquifer--Formation, group of formations, or part of a formation that contains sufficient saturated permeable material to yield significant quantities of water to wells and springs.
Base flow--Discharge entering stream channels from ground water or other delayed sources.
Confining bed--a bed that retards but does not necessarily prevent the flow of water from or to an adjacent aquifer.
Cubic foot per second--A volume flow of 1 cubic foot per second, which equals approximately 449 gallons per minute.
Dip--The angle that a formation or planar surface is inclined from the horizontal.
Formation--Basic rock unit in local classification of rocks, consists of an identifiable body of rock generally characterized by some distinctive lithologic features.
Geophysical log--A continuous graphic record of the response to physical or chemical properties of the rock material as a geophysical instrument is lowered into the borehole or well.
Gypsum--A widely distributed mineral consisting of hydrous calcium sulfate; CaSO4·2H2O.
Hydraulic conductivity--The volume of water at the existing kinematic viscosity that will move in a unit of time under a unit hydraulic gradient through a unit area measured at right angles to the direction of flow. In this report, the hydraulic conductivity is the volume of water that would move each day through a 1-square-foot area of porous sandstone under a gradient of 1 foot per foot.
Hydrograph--A graph showing some property of water with respect to time, such as the water level or hydraulic head measured in a well.
Lenticular--Describes deposits shaped like lenses when viewed in cross section.
Lignite--A brownish-black coal that is intermediate between peat and subbituminous coal.
Lithology--The description of rock or of the general physical character of a rock.
Loess--A homogeneous, unstratified, commonly calcareous deposit consisting predominantly of wind-laid silt.
Mortar bed--A deposit consisting of a mixture of clay, silt, sand, and gravel cemented by porous calcium carbonate and resembling hardened mortar or cement. Used interchangeably with caliche.
Percolation--Laminar flow of water, usually downward, by the force of gravity, through small openings within a porous material.
Permeability--The property or capacity of a porous rock, sediment, or soil for transmitting a fluid.
Potentiometric surface--A surface that represents the hydrostatic head. In a confined (artesian) aquifer, the surface is defined by the levels to which water in wells rises above the producing zone; in an unconfined aquifer, the surface coincides with the water table.
Sandstone--A sedimentary rock composed of abundant rounded or angular fragments, generally of sand-size quartz, more or less firmly cemented by some material such as iron oxide or calcium carbonate.
Sedimentary rocks--Layers of rock resulting from the consolidation of loose sediment, consisting of mechanically transported fragments, chemically precipitated minerals, or organically secreted material.
Shale--A fine-grained rock of consolidated clay, silt, or mud characterized by finely stratified structure.
Siltstone--A massive sedimentary rock composed of mostly silt-sized material.
Specific capacity--The rate of discharge from a well divided by draw down of water level within the well. If the specific capacity is constant except for the time variation, it is roughly proportional to the transmissivity of the aquifer. It can vary with well construction and development, type of screen or casing, discharge of well, and length of pumping period.
Storage coefficient--The volume of water an aquifer releases from or takes into storage per unit surface area of the aquifer per unit change in head.
Transmissivity--The rate at which water of the prevailing kinematic viscosity is transmitted through a unit width of the aquifer under a unit hydraulic gradient. It is equal to an integration of the hydraulic conductivities across the saturated part of the aquifer perpendicular to the flow paths. In this report, it is given in units of feet squared per day.
Water table--That surface in an unconfined water body at which the water pressure is atmospheric. It is defined by the levels at which water stands in wells that penetrate the water body just enough to hold standing water. The water table is a particular potentiometric surface.
For readers familiar with or interested in the metric system, U.S. customary units of measurement given in this report are listed in equivalent metric units using the following abbreviations and conversion factors:
| U.S. customary unit | Multiply by | Metric unit |
|---|---|---|
| Length | ||
| inch (in) | 2.54 | centimeter (cm) |
| foot (ft) | .3048 | meter (m) |
| mile (mi) | 1.609 | kilometer (km) |
| Area | ||
| acre | .4047 | square hectometer (hm2) |
| square mile (mi2) | 2.590 | square kilometer (km2) |
| Volume | ||
| gallon (gal) | 3.785 | liter (L) |
| cubic foot (ft3) | .02832 | cubic meter (m3) |
| acre-foot (acre-ft) | 1.233 x 10⁻³ | cubic hectometer (hm3) |
| Flow | ||
| gallon per minute (gal/min) |
.06309 | liter per second (L/s ) |
| cubic foot per second (ft3/s) |
.02832 | cubic meter per second (m3/s) |
| Hydraulic conductivity | ||
| foot per day (ft/ day) | .3048 | meter per day (m/ day) |
| Transmissivity | ||
| foot squared per day (ft2/day) |
.0929 | meter squared per day (m2/day) |
| Specific capacity | ||
| gallon per minute per foot [(gal/min)/ft] |
.207 | liter per second per meter [(L/ s)/m] |
| Gradient | ||
| foot per mile (ft/mi) |
.1894 | meter per kilometer (m/km) |
Wells developed in sandstone of the Dakota Formation in Hodgeman and northern Ford Counties produce between 7,700 and 15,000 acre-feet of water per year, which is used primarily to irrigate approximately 7,700 acres of cropland. The major irrigated localities are near Jetmore, Spearville, and Ford. Both confined and unconfined conditions occur in the aquifer. Most irrigation wells are pumping from the confined part of the aquifer. Yields range from about 100 to 2,200 gallons per minute.
Development of the formation is restricted because the thickness, extent, and cementation of the sandstone are so variable that productive units are difficult to locate.
Results of two aquifer tests provide transmissivity values of 2,000 and 7,100 feet squared per day and storage coefficients of 0.0005 and 0.07, respectively. The lower coefficient indicates a confined aquifer, and the higher coefficient indicates an unconfined aquifer.
Recharge from overlying unconsolidated formations occurs chiefly in the southeast corner of the area. Additional water enters the area by subsurface flow within the aquifer from the south and west.
Water from the Dakota Formation in northern Ford County generally has a medium salinity hazard and a low sodium hazard when used for irrigation. In Hodgeman County, the water generally has a high to very high salinity hazard, and the sodium hazard ranges from low to very high. Dissolved solids range from 296 to 1,420 milligrams per liter; specific conductance ranges from 450 to 2,450 micromhos per centimeter at 25° C; and the sodium-adsorption ratio ranges from 0.5 to 40.
Continued development of irrigation, using water from wells in the Dakota Formation, is likely even though the sandstone units are of limited extent. Water-level declines are expected to continue slowly in the unconfined areas, especially where recharge offsets some of the withdrawal, and more rapidly in confined areas where recharge generally is limited to lateral subsurface inflow.
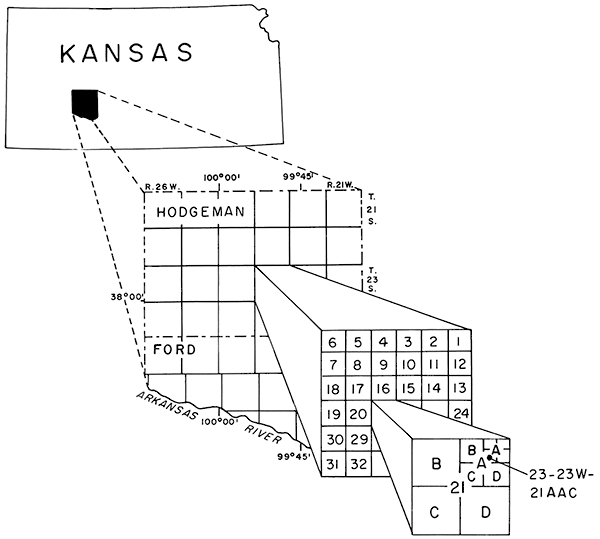
The report area is located in southwestern Kansas. It includes all of Hodgeman County and that part of Ford County north of the Arkansas River, as shown in figure 1.
Figure l--Location of report area and diagram showing well-numbering system.
The purposes of the study are (1) to determine the extent and hydraulic characteristics of the water-yielding sandstones of the Dakota Formation, (2) to determine the degree and effects of irrigation-well development, and (3) to assess the potential for future development. [Note: The classification and nomenclature of rock units in this report are those of the Kansas Geological Survey and differ somewhat from those of the U.S. Geological Survey.]
Ground-water use for irrigation has steadily increased in parts of Hodgeman and northern Ford Counties. In the valley of the Arkansas River and in the southwestern part of the area, shallow unconsolidated sand and gravel deposits generally yield adequate supplies of water for domestic, stock, and irrigation use. Elsewhere, sandstone lenses in the Dakota Formation are the principal source of water. Figure 2 is a generalized geologic map of Hodgeman and northern Ford Counties that shows where the different formations crop out at the surface. Geologic formations that are significant to the water resources of the area are summarized in table 1.
Figure 2--Generalized geologic map.
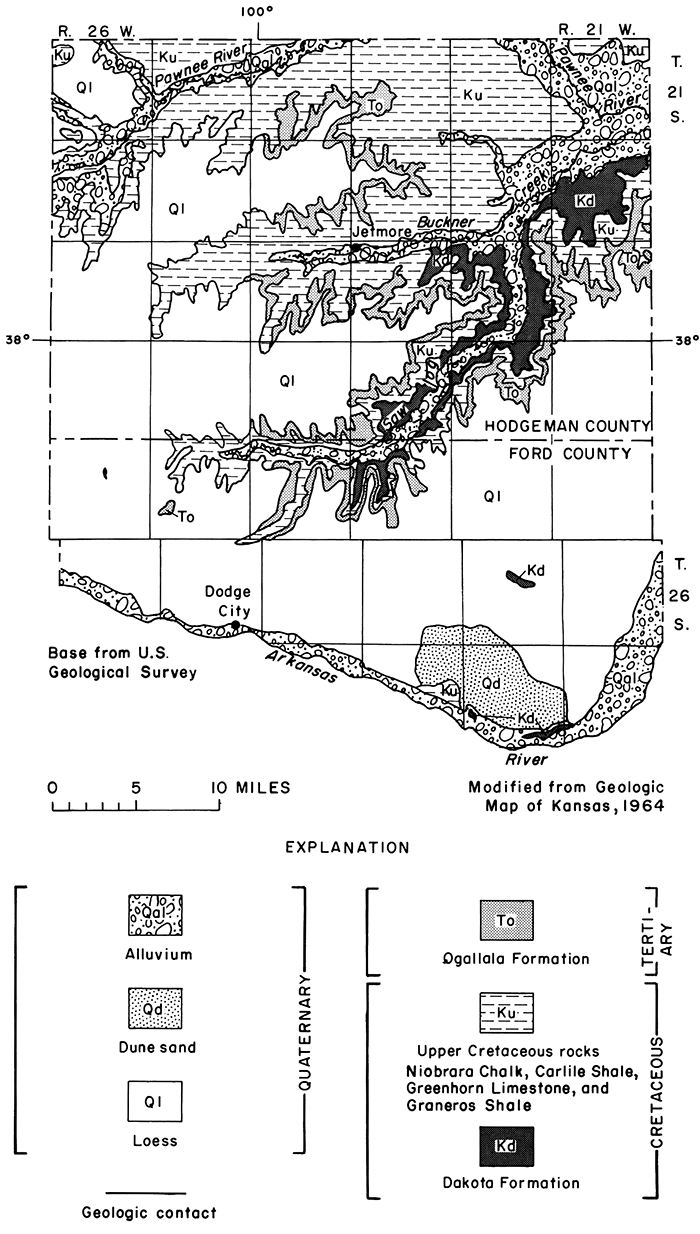
Table 1--Generalized section of geologic formations and their hydrologic characteristics.
| System | Series | Geologic unit | Thickness (feet) |
Physical characteristics | Hydrologic characteristics |
|---|---|---|---|---|---|
| Quaternary | Pleistocene | Alluvium and undifferentiated Pleistocene deposits | 0-150 | Clay, silt, sand, and gravel. Deposited by streams along the principal stream valleys and in older stream valleys. | Sand and gravel may yield as much as 2,000 gal/min to wells. |
| Dune sand | 0-10 | Sand, fine to medium, mostly windblown. Covers small area north of the Arkansas River valley. | Generally above the water table. Not known to yield water to wells. | ||
| Loess | 0-10 | Silt, windblown, locally reworked and deposited by streams. Covers upland. | Most of deposits above the water table. Not known to yield Significant quantities of water to wells; yields are less than 10 gal/min. | ||
| Tertiary | Pliocene | Ogallala Formation |
0-150 | Silt, clay, caliche, sand, and gravel. Mostly unconsolidated, but cemented locally into mortar beds by calcium carbonate (lime). | Principal aquifer in the southwestern part of the area. Yields to irrigation wells range from 100 to 1,500 gal/min. |
| Cretaceous | Upper Cretaceous |
Niobrara Chalk | 0-30 | Limestone, massive, chalky, tan-white to light-gray. | Not known to yield significant quantities of water to wells. |
| Carlile Shale | 0-260 | Clay, weathered, yellow-orange to gray, overlying a gray-brown to bJacky chalky shale with orange and light-gray to white lenses of bentonite and thin layers of chalky limestone. | |||
| Greenhorn Limestone |
0-125 | Shale, thin-bedded, chalky, light- to dark-gray and chalky limestone beds; contains thin lenses of bentonite. | May yield small quantities of water from solution cavities or joints. | ||
| Graneros Shale | 0-50 | Shale, black to dark-gray; contains gypsum, bentonite, thin limestone beds, and fine-grained silty sandstone layers. | Not known to yield significant quantities of water to wells. | ||
| Lower Cretaceous |
Dakota Formation |
100-450 | Shale, gray to yellow-brown or black, with interbedded sandstone lenses commonly cemented with iron oxide or calcium carbonate. The sandstone is commonly light yellow-brown to white, varying in hardness with the amount of cement. Also contains thin discontinuous layers of clay, siltstone, ironstone, and lignite. The lignite layers are most common near the top and the bottom of the formation. | Yields as much as 2,200 gal/min to wells in loose (poorly cemented) sandstone beds. Constitutes an important aquifer in the two counties, but locally may not yield any water to wells. | |
| Kiowa Formation |
160-250 | Shale, gray to black, clayey, with thin discontinuous lenses of sandstone and limestone. Locally contains gypsum. Also contains thin fossil shell beds, some of which may be continuous throughout the area. | Not known to yield significant quantities of water to wells. | ||
| Cheyenne Sandstone |
20-300 | Sandstone, light-gray to yellow, fine- to coarse-grained. Commonly cemented with iron sulfide or calcium carbonate. Interbedded shales vary from white to green or dark gray. | Water highly mineralized and unsuitable for irrigation. | ||
| Permian | Undifferentiated Permian |
Undifferentiated red beds |
1,000 | Shale, sandstone, and siltstone, red; contains beds of gypsum, anhydrite, and dolomite. Underlain by about 2,000 feet of older Permian limestone and shale. | May yield saline water to wells that flow at the surface in the Pawnee River and Buckner Creek valleys in northeastern Hodgeman County. |
The well and test-hole numbers in this report give locations according to the Bureau of Land Management's system of land subdivision. The first number indicates the township; the second number indicates the range west of the sixth principal meridian; and the third number indicates the section, followed by letters that indicate the subdivision of the section in which the well or test hole is located. The first letter denotes the quarter section or 160-acre tract; the second letter, the quarter-quarter section or 40-acre tract; and the third letter, when used, the quarter-quarter-quarter section or 10-acre tract. The 160-acre, 40- acre, and lO-acre tracts are designated A, B, C, and D in a counterclockwise direction beginning in the northeastern quadrant. As an example, well 23-23W-21AAC is in the SW NE NE sec. 21, T. 23 S., R. 23 W. (fig. 1). When two or more wells are located in a 10-acre tract, consecutive numbers beginning with 2 are added to the letters in the order in which the wells or test holes are inventoried.
This report was prepared by the U.S. Geological Survey and the Kansas Geological Survey, with data and support from the Division of Water Resources of the Kansas State Board of Agriculture and the Division of Environment of the Kansas Department of Health and Environment. The authors are grateful to the irrigators who assisted in making discharge measurements and to the many landowners for their interest and cooperation.
Appreciation is expressed to the drilling contractors (Henkle Drilling and Supply Company, Inc., High Plains Drilling and Supply, Johnson Drilling Company, Layne-Western Company, and Minter-Wilson Drilling Company, Inc.), who furnished data on wells and test holes in the area, and to personnel of the Soil Conservation Service, U.S. Department of Agriculture, who furnished valuable information.
The Dakota Formation in Hodgeman and northern Ford Counties consists of mostly continental deposits. The clay, siltstone, shale, and sandstone were deposited near or slightly above sea level. The black marine shales and gray sandstones of the underlying Kiowa Formation grade upward into lower beds of the Dakota containing traces of lignite, which indicate a swampy environment. These beds are overlain by middle beds of the Dakota containing predominantly gray to red clay with tan to white sandstone lenses. The middle beds of the Dakota grade upward into upper beds of the Dakota of dark-gray clay and sandstone containing lignite layers, indicating a return to a swampy condition. The upper part of the formation grades upward into the black marine 'shale of the Graneros Shale.
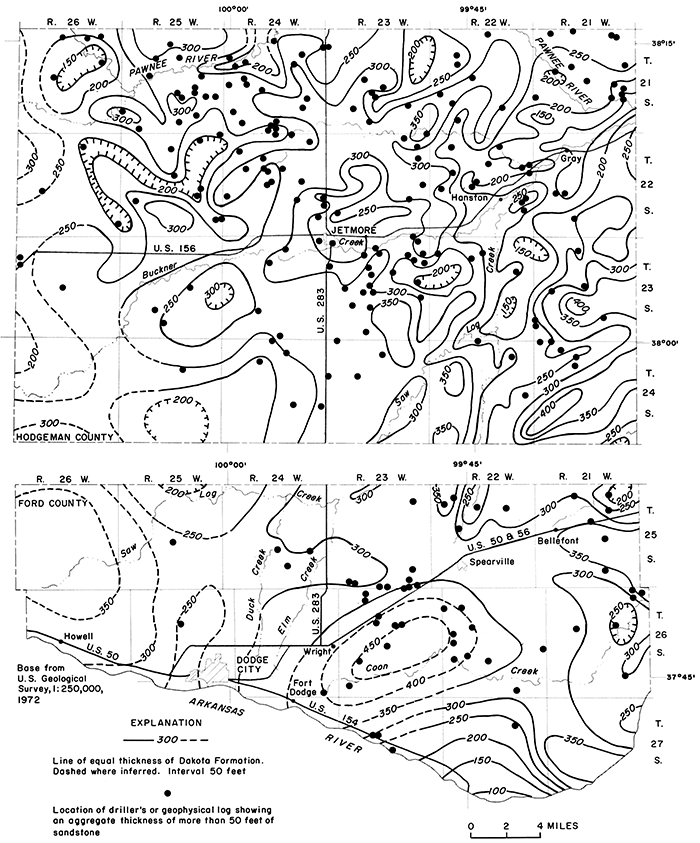
Studies in central Kansas (Bayne and others, 1971; Franks, 1976) indicate that the Dakota Formation was deposited by westward flowing streams of low gradient. The sandstone lenses probably were deposited in thin layers by meandering streams. Location of drillers' and geophysical logs that show an aggregate thickness of more than 50 feet of sandstone are shown in figure 3. However, other areas have not been thoroughly tested by drilling. Conversely, two closely spaced logs showing more than 50 feet of sandstone do not necessarily indicate that a test hole drilled between them will penetrate more than 50 feet of sandstone.
The approximate thickness of the Dakota Formation is shown in figure 3. Thickness ranges from about 100 feet in T. 27 S., R. 22 W. to 450 feet in T. 26 S., R. 23 W. (both areas are in northern Ford County), but most commonly ranges from 200 to 250 feet. Those areas showing a thickness of more than 300 feet also may include some hard gray sandstone of the Kiowa Formation. Because the Dakota Formation has been extensively eroded in the northeastern and southeastern parts of the area, the lesser thicknesses may not represent less deposition.
Figure 3--Approximate thickness of Dakota Formation and location of logs showing more than 50 feet of included sandstone.
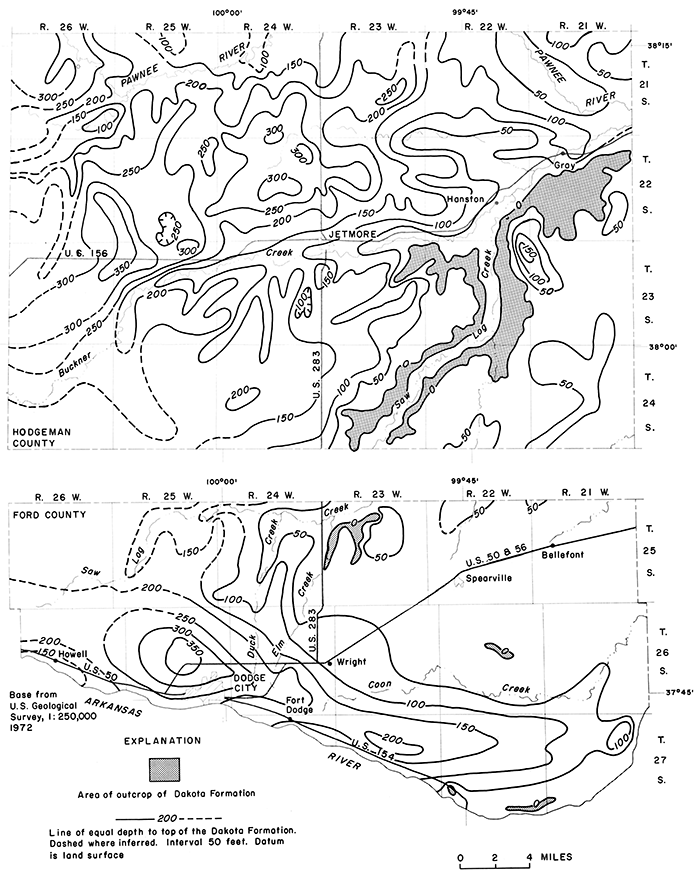
The depth to the top of the Dakota Formation, as shown in figure 4, indicates the thickness of sediments above the Dakota. These data combined with the formation thickness (fig. 3) indicate the approximate total well depth for projected Dakota tests and depths needed to drill a well.
In much of the eastern one-third of the study area, the Dakota Formation is exposed or is overlain by less than 50 feet of deposits. In the remainder of the area, the thickness of overlying deposits ranges from about 50 to 350 feet, but most commonly ranges from about 100 to 200 feet.
Figure 4--Approximate depth to top of the Dakota Formation.
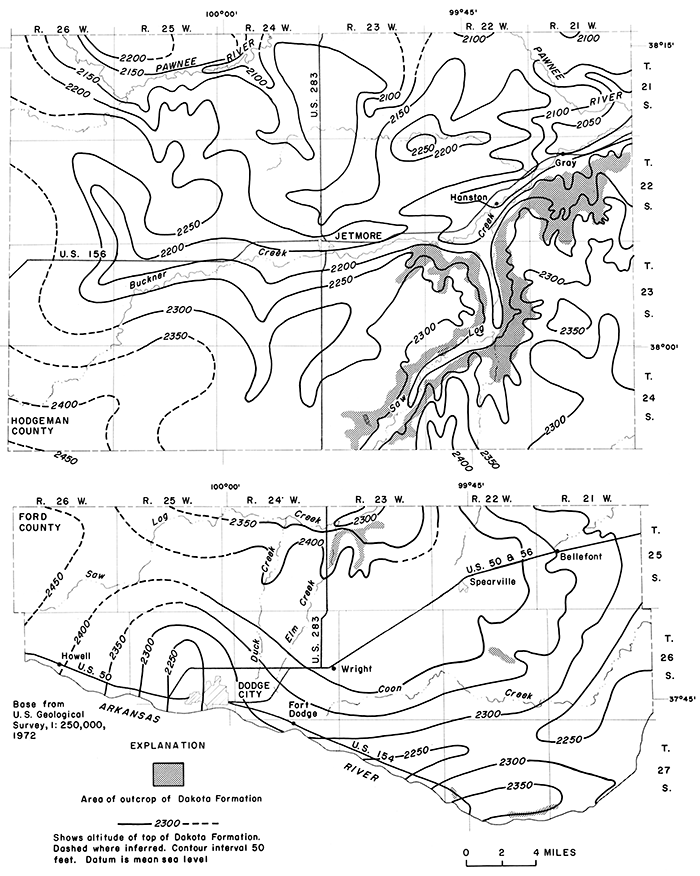
The general configuration of the top of the Dakota Formation, as shown in figure 5, represents the contact between the Dakota and the overlying deposits, except in the outcrop areas. Along Coon Creek, Saw Log Creek, and Buckner Creek, the detailed contours represent areas of outcrop or very thin overburden where extensive erosion of the Dakota Formation has taken place. Erosion also has occurred in other small areas along the Pawnee River and its tributaries in northeastern Hodgeman County.
The regional dip of the Dakota averages 8 feet per mile to the northeast. Gentle upwarping of the Dakota Formation probably has occurred along an east-west line in the southern part of T. 25 S.
Figure 5--General configuration of the top of the Dakota Formation.
The ability of sandstone in the Dakota Formation to contain or transmit water is related to the uniformity of size and shape of the sand grains, the percentage of clay or cementing material contained, and the interconnection and thickness of sandstone lenses. The sand ranges from poorly sorted to well sorted and generally ranges in size from very fine to fine. The amount of silt, clay, and cementing material contained in the sandstone may differ greatly within short distances. Also, the interconnection of sandstone lenses is highly erratic owing to the mode of deposition.
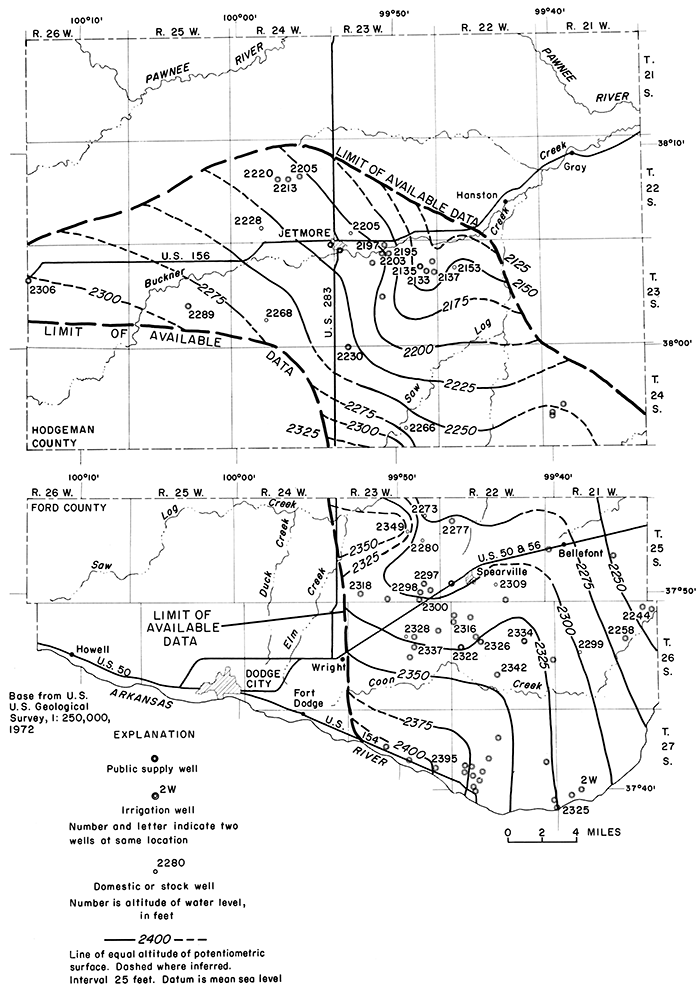
The configuration of the potentiometric surface of the Dakota Formation is shown in figure 6. The surface slopes generally northeast at about 9 feet per mile, indicating that the movement of water in the Dakota is in that direction.
The potentiometric surface is irregularly shaped as a result of the widely differing geohydrologic conditions within the Dakota. The widely spaced contours in the Spearville area generally reflect a good interconnection between sand layers and a relatively high hydraulic conductivity in those layers. Closely spaced contours, as in the northeast part of T. 25 S., R. 23 W., probably reflect a combination of (1) poor interconnection between sand layers, (2) a relatively low hydraulic conductivity in part or all of those layers, and (3) changes in head as a result of heavy pumping from an artesian system. Pumping also has altered the regional gradient. The potentiometric surface shown is based on measurements taken during the spring of 1973 before the start of the irrigation season. During the summer months, aquifer conditions are changed so that the potentiometric surface is more complex than the one shown in figure 6.
Figure 6--Configuration of the potentiometric surface of the Dakota Formation, spring 1973.
Generally, the Dakota Formation contains water under confined conditions throughout most of western Kansas. However, unconfined conditions prevail in parts of the report area where the overlying confining shales have been removed by erosion or where the water level is below the top of a water-bearing sandstone lens. Water levels in wells penetrating more than one sandstone may show a composite potentiometric head.
Water in the Dakota Formation in wells south of Jetmore is about 100 feet below the top of the shallowest water-bearing sandstone and is unconfined. However, water levels in wells screened in more than one layer also may be affected by the hydraulic head in a lower confined sandstone layer that is not hydraulically connected with the upper unconfined layer.
Water in wells west of Spearville is slightly below the top of the shallowest water-bearing sandstone and is unconfined. In the Spearville area, well logs indicate that the Dakota may consist almost entirely of sandstone with a few thin shale layers.
The height of the water level ranges from about 100 feet below the top of the Dakota Formation in wells south of Jetmore to more than 300 feet above the top in wells northwest of Jetmore.
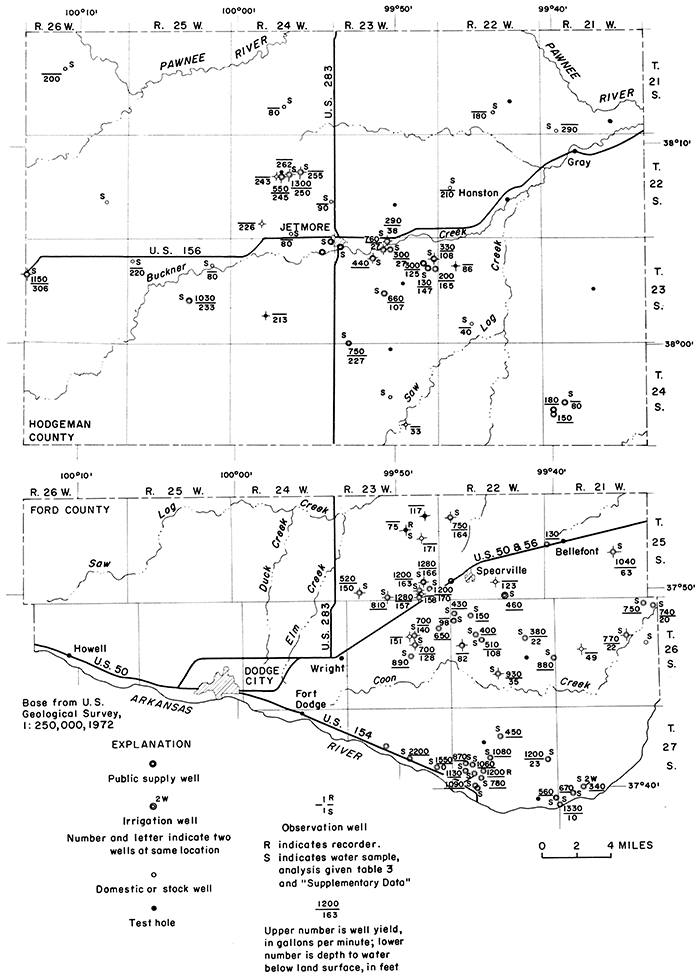
Discharge measurements were made on nearly all the large-yielding wells. The well-yield data, along with the depth to water, are shown on the well-location map (fig. 7). Well yields throughout the formation ranged from a few gallons per day to 2,200 gal/min.
Figure 7--Location of selected wells and yields, test holes, and sampling sites for water quality in Dakota Formation, spring 1973.
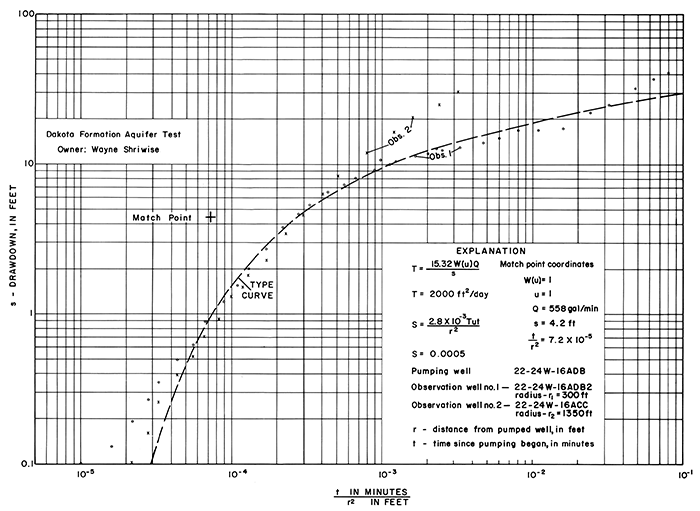
Aquifer tests were run in two areas to determine representative hydraulic characteristics in the area and to test the performance of wells at the two sites. The hydraulic properties of the aquifer are expressed in terms of transmissivity, storage coefficient, and hydraulic conductivity (Lohman, 1972). The specific capacity measured during the test relates to the hydraulic properties and to the well efficiency. Results of the tests are summarized in table 2.
Table 2--Summary of aquifer tests in Ford and Hodgeman Counties, Kansas.
| Well number | Transmissivity, T (ft2/day) |
Storage coefficient, S (dimensionless) |
Hydraulic conductivity (ft/day) |
Depth of well (feet) |
Depth to water (feet) |
Effective thickness1 | Average discharge (gal/min) |
Drawdown (feet) |
Specific capacity [(gal/min)/ft] |
Duration of test (minutes) |
Date | |
|---|---|---|---|---|---|---|---|---|---|---|---|---|
| (feet) | (percent) | |||||||||||
| 25-23W-35DDB2 | 7,100 | 0.07 | 41 | 320 | 142 | 175 | 99 | 950 | 44 | 22 | 12,960 | February 1969 |
| 22-24W-16ADB | 2,000 | 0.0005 | 16 | 565 | 261 | 125 | 41 | 558 | 91 | 6 | 7,200 | June 1973 |
| 1. Thickness of water-yielding sandstone as related to total thickness of Dakota Formation penetrated, expressed in feet and percent. 2. Test made and interpreted by H. L. Mackey, Division of Water Resources, Kansas State Board of Agriculture. |
||||||||||||
The test on well 25-23W-35DDB in Ford County, belonging to Melvin Stein, is representative of the results in the unconfined area; whereas the test on well 22-24W-16ADB in Hodgeman County, belonging to Wayne Shriwise, is representative of the results in the confined area. Departure from ideal conditions, as indicated by the results late in the second test (fig. 8), indicates that the hydraulic properties determined are valid only a short distance from the well. The same is true of the first test because of the heterogeneity of the Dakota Formation.
Figure 8--Aquifer-test data superimposed on type curves.
The development of wells in the Dakota Formation involves a higher risk than development in the unconsolidated deposits. Pumping large quantities of water from a formation in which the water is under confined conditions may cause large drawdown over several square miles. Also, the limited extent and lack of connection between many of the sandstone lenses may result in a large initial well yield that rapidly dewaters the surrounding area and greatly reduces the sustained yield.
A total of 62 large-capacity wells (yielding more than 100 gal/min) were completed in the Dakota Formation between 1967 and 1973. Fifty-nine of these are for irrigation, primarily for feed crops, and three are for feedlot water systems. The towns of Jetmore in Hodgeman County and Spearville in northern Ford County also obtain water from the Dakota Formation.
The locations of irrigation and public-supply wells completed in the Dakota Formation are shown in figure 7. The wells are in an area extending from west-central to southeast Hodgeman County and northeast Ford County. The areas of greatest development are near Jetmore, Spearville, and Ford.
Energy consumed in pumping an acre-foot of water was calculated for those wells where discharge was measured in order to estimate total pumpage for irrigation in the area. Four types of energy are used to power the irrigation systems: diesel fuel, electricity, natural gas, and LPG (Iiquified petroleum gas). Energy used for 33 of the systems is diesel fuel; 20 use electricity; 4 use natural gas; and 2 use LPG. An average of 27 gallons of diesel fuel, 350 kwh (kilowatt-hours) of electricity, or 12,000 cubic feet of natural gas is required to pump 1 acre-foot of water in the area. The ranges for energy consumption per acre-foot are: 14 to 34 gallons diesel fuel, 107 to 480 kwh of electricity, and 8,900 to 13,800 cubic feet of natural gas. No data were collected on LPG consumption; however, the amount of fuel, in gallons, required to power an LPG engine is about double that required for a diesel engine.
An average of 270 kwh is required to pump 1 acrefoot of water for flood irrigation and 410 kwh for sprinkler irrigation. The sprinkler system operates under a greater discharge head, which accounts for the increased amount of energy consumed. Power requirements vary with efficiency of the pumping plant, pumping lift, and the pressure head at the pump.
Computations based on electrical power records of 15 wells (25 percent of the total of 59 irrigation wells) show that annual withdrawal for 1973 was about 1,210 acre-feet to irrigate 1,210 acres. The average annual pumpage of water per acre for sprinkler systems was about 0.8 acre-foot, and for flood systems, 1.1 acrefeet. Although the land irrigated by the 15 sampled wells is more sandy than other lands under irrigation, the results were used to estimate withdrawal from the Dakota aquifer.
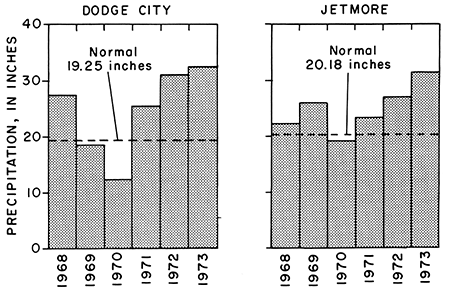
Assuming 1 acre-foot per acre pumped in 1973 for the 15 wells sampled, then pumpage by all 59 wells to irrigate 7,700 acres would be about 7,700 acre-feet. Irrigation normally requires a seasonal application of about 1.5 to 2 feet. The requirement of 1 foot for 1973 was less because of above-normal precipitation. According to records of the National Weather Service (National Oceanic and Atmospheric Administration, U.S. Department of Commerce), annual precipitation for 1973 at Dodge City and Jetmore was 32 inches as compared to the normal 20 inches for 1968-73, as shown in figure 9. Precipitation at Dodge City and Jetmore during 1972 and 1973 growing seasons, April through September, averaged 22 inches, which was 7 inches above normal.
Figure 9--Annual precipitation at Dodge City and Jetmore (1968-73). [From records of the National Oceanic and Atmospheric Administration, U.S. Department of Commerce]
About 7,700 acres were irrigated in 1973 by water pumped from the Dakota Formation. Assuming that irrigation requirements range from 1 to 2 acre-feet per year, withdrawals would range from about 7,700 to 15,000 acre-feet per year at a rate inversely proportional to annual precipitation.
Water-level changes in wells in the Dakota Formation of Hodgeman and northern Ford Counties mainly indicate the effects of ground-water withdrawals for irrigation. Highest water levels generally occur in the winter or early spring when the effects of pumping for irrigation are at a minimum. The year-to-year differences in these highest water levels indicate the amount of long-term decline in the aquifer.
Nearly all wells in the Dakota Formation have shown long-term declines in water levels. Measurements in wells from December 1967 to the spring of 1973 showed declines ranged from 0 to 40 feet, and most commonly were about 20 feet. As shown by the hydrographs in figure 13 (see Supplemental Data), the greatest long-term decline was 40 feet in irrigation well 23-23W-12ABD in Hodgeman County. Nearby irrigation well 23-23W-4AAD showed virtually no long-term decline but showed seasonal fluctuations as great as 125 feet. Water levels in this well probably are influenced by recharge of water from the alluvium of Buckner Creek. Water levels in most domestic and stock wells in the Dakota Formation declined in a manner similar to those in the irrigation wells, although the seasonal changes were generally less.
Fluctuations caused by pumping for irrigation mask any seasonal variations caused by natural recharge and discharge. Only a small part of the Dakota aquifer in the study area is in contact with the overlying sand and gravel and is recharged by percolation of precipitation or by water from overlying unconsolidated deposits. Most of the water enters the Dakota aquifer in areas of Kansas southwest of Hodgeman and northern Ford Counties.
Natural discharge from the Dakota Formation in the study area occurs as springs and seeps along Buckner, Saw Log, and Coon Creeks and as ground water discharged into the alluvium along streams. It is estimated that the contribution of ground water to the three streams total about 1.5 cubic feet per second or about 1,100 acre-feet per year. Additional discharge by other means (domestic and stock wells, evapotranspiration, etc.) is estimated to be 1,200 acre-feet per year. Discharge to streams of 1,100 acrefeet combined with the estimated 7,700 acre-feet of pumpage for irrigation and 1,200 acre-feet by other means, gives a total of about 10,000 acre-feet discharged from the Dakota Formation in 1973.
Quality of water in the Dakota Formation in Hodgeman and northern Ford Counties varies widely, as shown by the 67 analyses of water samples included in table 6 (see Supplemental Data). The various water types discussed in this section are classified according to the predominant ions. Well 27-22W-20BBD in northern Ford County, near the area where the Dakota is being recharged from the Ogallala Formation, yields water of a calcium-bicarbonate type. As a calcium-bicarbonate water moves through the Dakota Formation, it changes by the process of ion exchange to a sodium-bicarbonate type water such as that from well 23-25W-22DBB. Well 27-21W-30DDD yields water of a mixed calcium-sodium-bicarbonatesulfate type similar to that of water in the nearby Arkansas River alluvium, which probably is the source of recharge.
The sodium-chloride-nitrate water from well 23- 23W-4AAD probably indicates pollution from animal wastes from an unidentified source. Another analysis, showing a sodium-chloride water from well 21-21W- 31DDA, probably indicates the upward movement of a highly mineralized water from Permian beds.
The great variation in water quality in the Dakota Formation in Hodgeman and northern Ford Counties probably is caused by the movement of water from underlying and overlying formations. Some of the variation may be caused by differences in quality with depth, as the wells generally do not tap the entire thickness of the formation.
Many complex factors influence the suitability of water for inigation. Two of these are the salinity hazard, as indicated by the conductivity, and the sodium (alkali) hazard, which is based on a relationship between the sodium content and the other cations in the water. These relationships are used to indicate, in a general manner, the suitability of water for irrigation, as shown in figure 10. The method of classification is that of the U.S. Salinity Laboratory (U.S. Department of Agriculture Handbook 60, 1954).
Figure 10--Suitability of water from the Dakota Formation for irrigation. (Chemical analyses of water for well number indicated given in table 6.)
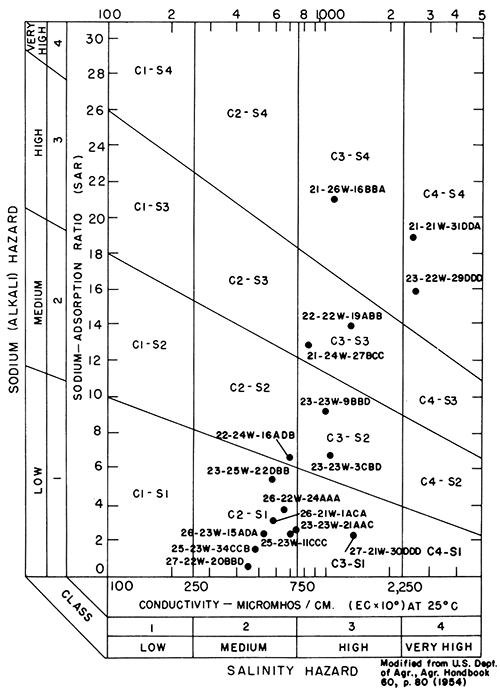
In general, water having a high to very high salinity and high sodium hazard should not be used for irrigation. However, some well-drained soils may tolerate less suitable water, and proper irrigation practices may reduce the hazards. Deterioration of the soil caused by application of unsuitable water is slow, so that several years may pass before the results become evident.
Water from the Dakota Formation commonly contains concentrations of some mineral constituents that exceed the limits for domestic and public supplies recommended by the Kansas Department of Health and Environment, as shown in table 3. Special note should be taken of the high fluoride content, which commonly causes mottling of teeth in children who drink the water during the time that their permanent teeth are being formed. Another common problem is the high iron concentration in water from the Dakota Formation. Although some softening may occur naturally, a method of iron removal commonly is necessary before the water is suitable for household use. Generally the water presents no natural health hazard, except for persons who must reduce their sodium intake. A high nitrate concentration, such as the 42 mg/L (milligrams per liter) from well 27-21W-31CCB and the 230 mg/L from well 23-23W-4AAD, commonly indicates local pollution. The latter sample also contains enough nitrate to cause fatalities in very young children or young animals.
Table 3--Recommended concentrations of constituents in water for domestic and public supplies.
| Constituent | Recommended limits, in milligrams per liter |
|---|---|
| Dissolved solids | 500 |
| Iron (Fe) | .3 |
| Manganese (Mn) | .05 |
| Sulfate (SO4) | 250 |
| Chloride (Cl) | 250 |
| Fluoride (F) | 1.5 |
| Nitrate (NO3) | 45 |
Water-quality requirements for industry are extremely varied. For some uses where quality is not critical, much of the water in the Dakota Formation could be used with only moderate treatment to remove excessive iron or reduce excessive hardness. Other uses may require treatment too extensive to be practical.
No quantitative analysis was made during this study of the chemical quality of water in the strata below the Dakota Formation. Resistivity logs of oil and gas tests compared to analyses of water in adjacent areas indicate that the Cheyenne Sandstone and the Permian red beds in this area contain water unsuitable for irrigation. Figure 11 shows the depth to sandstone units containing highly mineralized water (more than 2,000 mg/L). This depth generally coincides with the top of the Cheyenne Sandstone. Geophysical logs commonly indicate more than 100 feet of shale in the Kiowa Formation between the Dakota Formation and the water-bearing sandstone in the Cheyenne. This confining shale zone probably should not be penetrated when test drilling for irrigation supplies.
Figure 11--Depth to sandstone containing highly mineralized water.
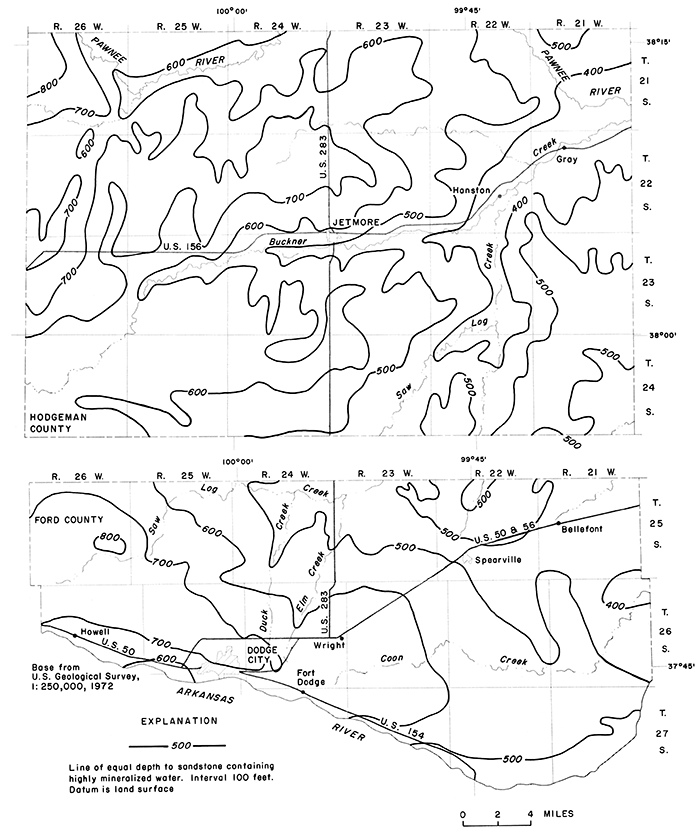
The maximum depth to sandstone containing mineralized water is slightly more than 800 feet in the extreme northwest corner of the area. The minimum depth is in the Pawnee River valley in northeastern Hodgeman County where the depth is nearly 400 feet. Most commonly the depths range from about 500 to 700 feet.
The increasing demand for farm products may encourage the irrigation of more land, but increasing energy costs and decreasing crop prices could reduce the rate of development. At many locations, the thickness and permeability of water-yielding sandstone is insufficient to supply ground water for irrigation wells, and the chemical quality of water in most of Hodgeman County also may inhibit future development.
Development of new wells is expected to continue in the sandhill area north of Ford and, to a lesser extent, in the area southeast of Spearville. Elsewhere, development probably will be extremely limited. In some areas, water from the Dakota Formation could be developed in combination with water from the Ogallala Formation to provide additional irrigation yields in n manner similar to that used in some other areas of southwestern Kansas.
Additional investigation of the hydrologic system in the area is needed because water levels and water quality are closely related to ground-water conditions in the overlying unconsolidated aquifer and to streamflow.
A regional study of the geohydrology of the Lower Cretaceous formations was made by Keene and Bayne (1977) to determine the amount and quality of water available for a future supply, including water that might be used if appropriate desalinization is utilized, and to determine what formations might need protection from pollution. Additional detailed studies are needed in localized areas as the demand for usable water increases.
The lignite in the upper and lower parts of the Dakota Formation may have sufficient thickness for mining in some parts of the area, and water-quality and environmental problems associated with the mining of these beds would need to be studied before any appreciable development occurs.
Bayne, C. K., Franks, P. C., and Ives, W., Jr., 1971, Geology and ground-water resources of Ellsworth County, central Kansas: Kansas Geol. Survey, Bull. 201, 84 p. [available online]
Bennett, G. D., and Patten, E. P., Jr., 1962, Constant-head pumping test of a multi aquifer well to determine characteristics of individual aquifers: U.S. Geol. Survey, Water-Supply Paper 1536-G, p. 181-203. [available online]
Dean, H. T., 1936, Chronic endemic dental fluorosis: Am. Med. Assoc. Jour., v. 107, p. 1269-1272.
Ferris, J. G., Knowles, D. B., Brown, R. H., and Stallman, R. W., 1962, Theory of aquifer tests: U.S. Geol. Survey, Water-Supply Paper 1536-E, p. 69-174. [available online]
Fishel, V. C., 1952, Ground-water resources of Pawnee Valley, Kansas: Kansas Geol. Survey, Bull. 94, 144 p. [available online]
Franks, P. C., 1976, The transgressive-regressive sequence of the Cretaceous Cheyenne, Kiowa, and Dakota Formations of Kansas: Geol. Assoc. Canada Spec. Paper No. 13, p. 469-521.
Frye, J. C., 1942, Geology and ground-water resources of Meade County, Kansas: Kansas Geol. Survey, Bull. 45, 152 p. [available online]
Green, J. H., 1964, The effect of artesian-pressure decline on confined aquifer systems and its relation to land subsidence: U.S. Geol. Survey, Water-Supply Paper 1779- T, 11 p. [available online]
Gutentag, E. D., Lobmeyer, D. H., McGovern, H. E., and Long, W. A., 1972, Ground water in Finney County, southwestern Kansas: U.S. Geol. Survey, Hydrol. Inv. Atlas HA-442. [available online]
Hay, D. R., and Pope, D. L., Groundwater management districts in Kansas: Kansas State Univ. C-495, 11 p.
Hem, J. D., 1970, Study and interpretation of the chemical characteristics of natural water: U.S. Geol. Survey, Water-Supply Paper 1473, 2nd ed., 363 p. [available online]
Keene, K. M., and Bayne, C. K., 1977, Ground water from Lower Cretaceous rocks in Kansas: Kansas Geol. Survey, Chem. Quality Ser. 5, 18 p. [available online]
Lang, S. M., 1961, Methods for determining the proper spacing of wells in artesian aquifers: U.S. Geol. Survey, Water-Supply Paper 1445-B, 16 p. [available online]
Latta, B. F., 1946, Cretaceous stratigraphy of the Belvidere area, Kiowa County, Kansas: Kansas Geol. Survey, Bull. 64, pt. 6, p. 217-260. [available online]
Latta, B. F., 1948, Geology and ground-water resources of Kiowa County, Kansas: Kansas Geol. Survey, Bull. 65, 151 p. [available online]
Lohman, S. W., 1972, Ground-water hydraulics: U.S. Geol. Survey., Prof. Paper 708, 70 p. [available online]
Lohman, S. W. and others, 1972, Definitions of selected ground-water terms--Revisions and conceptual refinements: U.S. Geol. Survey, Water-Supply Paper 1988, 21 p. [available online]
McGovern, H. E., and Long, W. A., 1974, Ground water in Gray County, southwestern Kansas: U.S. Geol. Survey Hydrol, Inv. Atlas HA-517. [available online]
McLaughlin, T. G., 1949, Geology and ground-water resources of Pawnee and Edwards Counties, Kansas: Kansas Geol. Survey, Bull. 80, 189 p. [available online]
McNellis, J. M., 1973, Geology and ground-water resources of Rush County, central Kansas: Kansas Geol. Survey, Bull. 207, 45 p. [available online]
Merriam, D. F., 1957, Preliminary regional structural contour map on top of the Dakota Formation (Cretaceous) in Kansas: Kansas Geol. Survey, Oil and Gas Inv. Map No. 15.
Merriam, D. F., 1963, The geologic history of Kansas: Kansas Geol. Survey, Bull. 162, 317 p. [available online]
Meyer, W. R., Gutentag, E. D., and Lobmeyer, D. H., 1970, Geohydrology of Finney County, southwestern Kansas: U.S. Geol. Survey, Water-Supply Paper 1891, 117 p. [available online]
Moss, R. G., 1932, The geology of Ness and Hodgeman Counties, Kansas: Kansas Geol. Survey, Bull. 19, 48 p. [available online]
Schoewe, W. H., 1949, The geography of Kansas--Part 2, Physical geography: Kansas Acad. Sci. Trans., v. 52, no. 3, p. 261-333.
Stallman, R. W., 1971, Aquifer-test design, observation and data analysis: U.S. Geol. Survey, Techniques of Water-Resources Inv., book 3, ch. B-1, 26 p. [available online]
Swineford, Ada, 1947, Cemented sandstones of the Dakota and Kiowa Formations in Kansas: Kansas Geol. Survey, Bull. 70, pt. 4, p. 53-104. [available online]
Swineford, Ada, and Williams, H. L., 1945, The Cheyenne Sandstone and adjacent formations of a part of Russell County, Kansas: Kansas Geol. Survey, Bull. 60, pt. 4, p. 101-168. [available online]
U.S. Department of Commerce, 1972, Climatological data for Kansas-annual summary: v. 86, no. 13.
U.S. Public Health Service, 1962, Drinking water standards: U.S. Public Health Service Pub. 956, 61 p.
U.S. Salinity Laboratory Staff, 1954, Diagnosis and improvement of saline and alkali soils: U.S. Dept. of Agriculture, Agriculture Handb. 60, 160 p.
Ver Wiebe, W. A., 1937, Cretaceous deformation in Kansas: Am. Assoc. Petroleum Geologists, Bull., v. 21, p. 954- 958.
Voegeli, P. T., Sr., and Hershey, L. A., 1965, Geology and ground-water resources of Prowers County, Colorado: U.S. Geol. Survey, Water-Supply Paper 1772, 101 p. [available online]
Waite, H. A., 1942, Geology and ground-water resources of Ford County, Kansas: Kansas Geol. Survey, Bull. 43, 250 p. [available online]
Walton, W. C., 1962, Selected analytical methods for well and aquifer evaluation: Illinois Water Survey, Bull. 49, 81 p.
Wyrick, G. G., and Floyd, E. O., 1961, Microtime measurements in aquifer tests on open-hole artesian wells: U.S. Geol. Survey, Water-Supply Paper 1545-A, 11 p. [available online]
Zeller, D. E., ed., 1968, The stratigraphie succession in Kansas: Kansas Geol. Survey, Bull. 189, 81 p. [available online]
Kansas Geological Survey
Placed on web June 18, 2013; originally published in 1979.
Comments to webadmin@kgs.ku.edu
The URL for this page is http://www.kgs.ku.edu/Publications/Bulletins/IRR5/index.html