Kansas Geological Survey, Computer Contributions 48, originally published in 1970
University of Illinois at Chicago
Originally published in 1970 as Kansas Geological Survey Computer Contributions 48.
The dendrograph has been developed as a two-dimensional diagram for depicting the mutual relationships among a group of objects whose pairwise similarities are given. The construction of the dendrograph is based on results of clustering using the unweighted pair-group method. The resultant hierarchical arrangement reflects both the within-group and the between-group similarity. In order to accentuate the hierarchical group structure, a rule of ordering is used to impart a pyramid shape to the dendrograph. To allow greater flexibility in the computer program for constructing dendrographs, an option is provided for the user to enter either correlation coefficients or distance functions as the measure of pairwise similarity between objects. Two examples are given to illustrate the usefulness of dendrographs in extracting meaning from multivariate data arrays.
The search for pattern characterizes much of what geologists do at present. For the most part, the search is concentrated on the elucidation of multivariate data arrays. In many instances, this has been facilitated through the use of graphic forms of data display. One notable graphic form which has found application in a number of geological problems is the dendrogram. Although devised originally by systematic zoologists to illustrate the hierarchical relationships among organisms based on observed similarities (Mayr, Linsley, and Usinger, 1953, p. 58), the dendrogram is used increasingly by the geologist to depict the mutual relationships for (1) different samples with multiple attributes, and (2) different variables measured for a set of samples. In either situation, what is desired and usually obtained is data compression without significant loss of information. Because the dendrogram has consistently had this effect on the expression of multidimensional data, it has been used widely in geology (Purdy, 1963; Behrens, 1965; Bonham-Carter, 1965; Parks, 1966; Merriam and Sneath, 1966; Valentine and Peddicord, 1967; Rowell, 1967; McCammon, 19680).
Recently, the unidimensionality of the dendrogram has been extended to two dimensions and the new graphic form has been termed the dendrograph (McCammon, 1968b). The dendrograph has the advantage of displaying similarities within-groups as well as between-groups of ordered objects. This tends to lessen the distortional effect inherent in any portrayal of data in fewer than the original number of dimensions.
The purpose here is to describe a computer program that produces dendrographs. A program is provided which makes it possible for anyone having access to a computer and plotter system to produce his own dendrographs. If a user does not have access to a plotter, it is possible to modify the plotting portion of the program so that the dendrograph can be produced on a printer. The user also can construct dendrographs manually using a straightedge and ruler with results computed by the program. The reason for offering the program with plotter is that with the time-sharing concept coming into vogue with computers, it is likely that most computer centers will soon have plotter capabilities.
To make the program as usable as possible, the assumption was made that the user previously would have calculated or somehow estimated the pairwise similarities of the items which he wished to arrange in hierarchical order. The reason, as numerical taxonomists have found (Sokal and Sneath, 1963, p. 166), is that the problem of deciding the best generalized measure of pairwise similarity for a given set of objects having multiple attributes is unresolved. Furthermore, if the items to be ordered represent different variables measured for a set of samples, a problem as to which measure to choose arises whenever continuous variables are to be correlated with discrete variables. Also, there is a problem if measurements for certain samples are missing. The attitude here is that the user of the program must treat problems as unique to his particular set of data, and the necessary steps are taken beforehand so that the input is a set of pairwise similarity coefficients.
One main option, however, exists in the program. In general, there are two broad classes of measures of pairwise similarity. On one hand, there are values that increase as the two objects compared more resemble one another. The notable example is the correlation coefficient defined for paired observations for two continuous variables. On the other hand, there are values that decrease the more the two objects resemble one another. The notable example here is the Euclidean distance measure defined for two objects located as points in some coordinate space. Other measures which are analogous to the Euclidean measure but do not possess necessarily full metric properties may be used. Most of these, however, satisfy all but the triangular inequality and are called semimetrics. Both measures are accepted by the program.
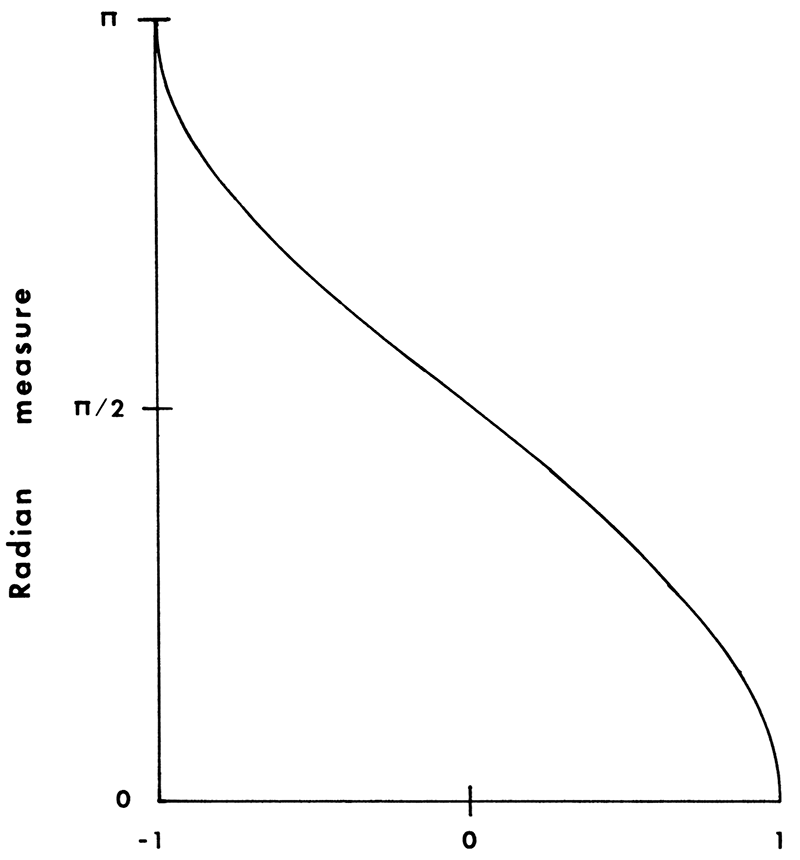
During execution, the program operates on the similarity measures as if they were either metric or semimetric quantities. This requires that if correlation-type measures are entered as input, it is necessary to transform them into metric quantities. The transformation used is the arc cosine transformation.
In the situation of the correlation coefficient, it transforms the correlation measure into one possessed with all properties of a metric (Blumenthal, 1953, p. 16). The transformation has a similar effect on Jaccard's coefficient. The transformation is diagrammed in Figure 1. In instances where correlation-type coefficients are used, the arc cosine transformation will have the desired effect of converting coefficients to distance-type measures. To ease the subsequent interpretation of the resultant dendrographs generated by correlation type measures, the within-group similarity measures are transformed by taking the cosine and scaling the within-group similarity axis in correlation units.
Figure 1—Arc cosine transformation of correlation coefficient.
The method used for ordering the objects to form the dendrograph has been described previously (McCammon, 1968b). Essentially, the method is the unweighted pair-group method of clustering (UWPGM) modified to provide, in addition, intergroup similarity. The literature on cluster analysis has grown enormously over the past few years and it would be impossible here to review its critical aspects. Also it is not possible to justify the preference of UWPGM over the dozens of other algorithms that have been proposed. Perhaps because it is one of the simplest to implement and because it treats objects equally, UWPGM has gained favor among cluster analysts. The assumptions underlying the various clustering schemes now in circulation however need a closer examination. An important step in this direction has been made recently by Gower (1967). For the present, UWPGM appears as versatile as any of the other methods.
The algorithm used to cluster objects an the computer program for constructing dendrographs on a plotter were developed originally at Gulf Research & Development Company. Special thanks go to Robert O'Hearn and Alexandra Tavlarides for assistance in development of the plotter program. Since that time the program has been rewritten for general use by the junior author. Special thanks go to Michael Goldman, David Rappaport, and Dennis Bartley of the Computer Center staff at the University of Illinois at Chicago Circle for making available the plotting subroutines for the 1627 Calcomp plotter.
Read the PDF version (4.5 MB)
Kansas Geological Survey
Placed on web Sept. 11, 2019; originally published 1970.
Comments to webadmin@kgs.ku.edu
The URL for this page is http://www.kgs.ku.edu/Publications/Bulletins/CC/48/index.html