![]()
Prev Page--Geology || Next Page--Well Records
Ground Water
The following discussion covers a number of aspects of groundwater hydrology as applied to northeastern Kansas. For a more extended discussion of the principles of ground-water hydrology, the reader is referred to a discussion of ground-water occurrence in the United States by O. E. Meinzer (1923) or to a summary of ground-water conditions in Kansas by R. C. Moore (1940).
Source, Occurrence, and Movement
During most periods of heavy precipitation part of the moisture enters the ground and part runs off in streams or evaporates. Much of the moisture entering the soil zone is utilized by plants and is returned to the atmosphere by transpiration, and a small amount continues to migrate downward until a zone of saturation is reached in which the available openings in the consolidated or unconsolidated rocks are filled with water. The upper surface of the zone of saturation is the water table, except where that surface is formed by an impermeable layer of rock. When water reaches the zone of saturation it commences to move towards a point of discharge which may be a spring, well, stream, pond, or an area in which plants send roots to the saturated zone and discharge the water to, the air by transpiration. The ground-water movement is in the down-slope direction of the water table which is generally the same direction as the slope of the land surface. Thus the major areas of natural ground-water discharge are in the lowest topographic positions which are along Kansas River and its tributaries.
There is no regional circulation of ground water in the Pennsylvanian rocks near Topeka. Owing to the highly dissected nature of the upland topography it is doubtful if much ground water travels a lateral distance of more than 10 miles. Therefore, waterlevel fluctuations in upland wells are a direct result of only local additions or withdrawals of ground water. Water-level fluctuations in wells in the valley alluvium are somewhat more complex owing to the influence of flood stages in Kansas River and its tributaries which tend to reverse normal ground-water gradients.
No water-table contours were drawn in older alluvium and in Pennsylvanian rocks because a simple water table, such as is found in Recent to Wisconsinan alluvial fills, often does not exist. Water-table contours were drawn in the alluvium along Kansas River (Pl. 2), and the contours indicate that the general water motion is diagonally downstream and toward the river. This general direction of ground-water movement is modified near Lawrence owing to the effect of the dam across Kansas River which raises the level of the river water above that of the water table in the surrounding alluvium thus reversing the gradient and hence the direction of flow. Soldier Creek also affects the shape of the water table between Menoken and Topeka. The water table in this area is unusually flat owing to ground-water discharge into both Kansas River and Soldier Creek. Soldier Creek also intercepts the water normally moving into the valley from the north.
The water table was contoured on information gathered after an unusually wet summer, so, in any subsequent drilling the water table may be lower than the elevation indicated on the map (Pl. 2). The normal water-table fluctuation at a distance of over 3,000 feet from the river is not greater than 5 feet a year unless it is affected by pumping or water flooding the entire valley. During the flood of 1951 water levels rose from 10 to 15 feet in many of the wells,. Sufficient information was not gathered to contour the, effect of small tributary streams which cross the valley alluvium. From measurements on five streams it is inferred that all the streams normally gain through ground-water discharge while crossing the valley alluvium.
As is shown in Figure 5 the water level in wells near the river fluctuates with the stage of the river; water levels in wells at a greater distance from the river seem to respond to. a slow infiltration of rain water (Figs. 6 and 7); however, as the periods of high river stage correspond to the periods of heavy rainfall, it is difficult to separate the effects of the two at some distance from the river.
Figure 5--Hydrographs of two observation wells and Kansas River near Topeka showing influence of river stage on wells close to the river.
Figure 6--Hydrographs of two observation wells near Lawrence and monthly precipitation for 1950 at Lawrence. (Precipitation data from U. S. Weather Bureau.)
Figure 7--Hydrograph of an observation well near Topeka for the period July through December 1950 and cumulative precipitation. Well owned and operated by the Division of Water Resources, Kansas State Board of Agriculture; precipitation data from the U. S. Weather Bureau.
Recharge
The information collected was not sufficient to attempt an accurate quantitative measure of ground-water recharge. In eastern Kansas the annual recharge is estimated at about one-half inch of the total precipitation of more than 30 inches (Knapp and others, 1940, p. 18). Calculations from the November base flow in Soldier Creek indicate a minimum possible recharge of one-fifth inch per year in the Soldier Creek drainage basin. Using the minimum flow for each month during the year of 1946, the recharge was calculated to be 1 inch. The true amount of annual ground-water recharge in the Soldier Creek basin is probably somewhere between these two quantities. In considering a small area, such as in this report, it must be remembered that calculations of recharge on a regional basis will have little significance, as infiltration may be 100 times as great in an area underlain by limestone or sandy alluvium as an area underlain by shale.
In the Kansas River Valley the rate at which precipitation infiltrates, to the zone of saturation is largely dependent on the clay content of the surficial material. During the spring of 1950 many ponds with surfaces well above the water table persisted through a three-month period of little, rainfall. Most of these ponds occupy old meander scars which have silty clay fillings and through which very little water can pass. In contrast to this condition, some sandy areas only contain puddles of rain water f or a few hours after heavy rainfall, indicating very favorable recharge conditions. An annual recharge of 2 inches of precipitation would maintain the existing ground-water mound between Kansas River and Soldier Creek. This estimate was based on permeability of 1,700 (Meinzer units) which was obtained from an average of 25 test wells in the vicinity of Lawrence (Lohman, 1941, pp. 34-37), water-table conditions obtained from observation wells, and the saturated thickness from test holes to the east. The principal area of recharge by precipitation is believed to, be the flood plain with very little recharge occurring in old channel scars and on the "backswamp" deposits of the Newman terrace.
During as many as 30 days in the year, high stages in Kansas River and its tributaries will cause a reversal of the normal groundwater flow and the river will feed water to the alluvium. The effect of the river stage on ground-water levels is shown in Figures 5 and 8. Much of this water will be temporary bank storage which drains into the river again without becoming effective as recharge. However, it is possible that as much as 20 percent of the recharge in the valley between Menoken and Topeka is from the river. In the vicinity of the, towns of Grantville, Perry, Newman, and Lakeview the normal recharge from the river should be much less. At Lawrence the dam across Kansas River causes water to flow into the alluvium during most of the year (Lohman, 1941).
Figure 8--Water-table profiles near Topeka showing the influence of Kansas River and Soldier Creek stages on ground-water recharge and discharge.
Yields of Wells
Some of the more important factors affecting the yield of a well are: (1) permeability of the water-bearing material; (2) thickness of the water-bearing material penetrated by the well; (3) construction of the well; and (4) diameter of the well.
Lohman (1941) concluded that the permeability of the material penetrated by 25 test holes in the vicinity of Lawrence was about 1,700 (Meinzer units). It is considered likely that similar high permeabilities are to be found everywhere in the deeper parts of the Kansas River alluvium. During the investigation made for this report the permeability of several samples of sand and gravel recovered from test holes was determined. The permeability of the material tested was found to range from 186 to 10,753 (Meinzer units). Owing to fluviatile deposition there is no great degree of uniformity in the sediments. Discontinuous lenses of gravel, sand, and boulders which grade into one another characterize the lower part of the Kansas River alluvial fill. In general, however, the deeper the fill the coarser and more permeable the sediments.
In seeking to obtain the maximum yield for a well it is highly important that the greatest possible thickness of the water-bearing material is penetrated by the well. The saturated thickness of alluvium in the Kansas River Valley ranges from about 20 to about 65 feet. The maximum thickness of alluvium is confined to a relatively narrow bedrock channel which can be located only by test drilling as it has no surface expression or relation to the present river channel.
Well construction varies greatly with the quantity of water desired, geologic conditions, and individual well driller's practices. A general discussion of well construction is beyond the scope of this report, but the following are a number of the more important points which should be considered carefully: (1) size of slot opening used in the casing or screen; (2) size and type of gravel used if the well is gravel packed; (3) total open space in the casing which allows water to enter the well; (4) the method with which the well is developed; and (5) the distance of the constructed well from other wells.
The diameter of a well is not as important a factor in obtaining large yields as was once thought. A well having a 4-inch diameter would have to be enlarged to a well having a diameter in excess of 80 inches in order to double the yield, providing all other factors affecting yield remain constant. There are, however, some advantages in increasing well diameters. The greatest advantage in heavily pumped wells is that the velocity with which water enters the well is greatly reduced, which in turn reduces sand pumpage and incrustation and corrosion of well screens or casings. The advantage of large diameter wells in formations which yield small quantities of water is that the well serves as a reservoir and stores the slowly accumulating water during times when the well is not pumped.
Representative yields of industrial and irrigation wells in Kansas River, alluvium are given in Table 4. The specific yields of these wells range from 10.8 to 133 gallons per foot of drawdown. The average specific yield of the wells is 53 gallons per foot of drawdown.
Utilization
Domestic
Of the domestic wells in the alluvium about 95 percent are driven wells. The, wells are usually constructed by augering to the first layer of sand in the zone of saturation, then driving the well point and pipe a desired distance into the sand or gravel. The wells are either started in basements or in small pits so the pump cylinders can be placed as near as possible to the water table. Driven wells are cheap and are usually satisfactory for small domestic supplies; however, if wells are to supply water for garden irrigation, air conditioning, or small dairies, larger and more expensive wells are usually necessary. In recent years most of the larger wells have been drilled by rotary or percussion methods and open-end, gravel-packed, or screened wells have been installed.
The older wells in Pennsylvanian rocks are mostly dug wells which range in diameter from 3 to 15 feet and in depth from 5 to 75 feet. Curbing is either brick or native limestone, and the upper part is often cemented to prevent entrance of polluted surface water. During the periods of drought from 1933 to 1939 many upland wells failed and several 15-foot diameter wells were dug under the supervision of the Kansas Emergency Relief Committee and by the Works Progress Administration. These wells were mostly located in alluvium along small streams.
Table 4--Pumping tests on wells in Kansas River alluvium; data as reported by well drillers, industrial engineers, and private individuals
| Location of well | Owner | Local well number |
Depth of well, feet |
Pumping rate, gals. per min. |
Drawdown, feet |
Hours pumped |
|---|---|---|---|---|---|---|
| NW NE sec. 26, T. 11 S., R. 15 E. | State Hospital | 3 | 49 | 220 | 7.6 | 2 |
| NW NE sec. 26, T. 11 S., R. 15 E. | State Hospital | 3 | 49 | 400 | 14.6 | 3 |
| NW NE sec. 26, T. 11 S., R. 15 E. | State Hospital | 1 | 60 | 500 | 5.5 | 9 |
| NW NE sec. 26, T. 11 S., R. 15 E. | State Hospital | 1 | 60 | 748 | 8.4 | 1 |
| NE NE sec. 14, T. 11 S., R. 15 E. | Howard Jackson | - | 60 | 480 | 11.0 | - |
| SE NE sec. 13, T. 11 S., R. 15 E. | Goodyear Tire and Rubber Company |
3 | 75.7 | 602 | 5.7 | 1.2 |
| SE NE sec. 13, T. 11 S., R. 15 E. | Goodyear Tire and Rubber Company |
3 | 75.7 | 350 | 3.5 | 6 |
| SE NE sec. 13, T. 11 S., R. 15 E. | Goodyear Tire and Rubber Company |
4 | 71 | 510 | 6.7 | 6 |
| SW NE sec. 13, T. 11 S., R. 15 E. | Goodyear Tire and Rubber Company |
1 | 79.3 | 720 | 7.7 | 8 |
| SW NE sec. 13, T. 11 S., R. 15 E. | Goodyear Tire and Rubber Company |
2 | 89 | 776 | 6.7 | 8 |
| SW NE sec. 13, T. 11 S., R. 15 E. | Goodyear Tire and Rubber Company |
2 | 89 | 1,400 | 11.1 | few minutes |
| NE SW sec. 30, T. 11 S., R. 16 E. | Beatrice Foods Inc. | 1 | 70 | 430 | 13 | 14 |
| NE SW sec. 30, T. 11 S., R. 16 E. | Beatrice Foods Inc. | 2 | 70 | 425 | 19 | - |
| SE SW sec. 29, T. 11 S., R. 16 E. | Hill Packing Co. | 1 | 68.5 | 1,000 | 7.5 | - |
| SE SW sec. 29, T. 11 S., R. 16 E. | Hill Packing Co. | 2 | 70 | 900 | 9.6 | 4 |
| SW NE sec. 29, T. 12 S., R. 20 E. | Westvaco Co. | 1 | 54 | 260 | 8.0 | 8 |
| SW NE sec. 29, T. 12 S., R. 20 E. | Westvaco Co. | 2 | 51 | 290 | 11.0 | 8 |
| SW NE sec. 29, T. 12 S., R. 20 E. | Westvaco Co. | 3 | 75.5 | 260 | 15.0 | 8 |
| SE NE sec. 29, T. 12 S., R. 20 E. | Westvaco Co. | 4 | 74 | 205 | 19.0 | 8 |
| SE NE sec. 29, T. 12 S., R. 20 E. | Westvaco Co. | 5 | 64 | 370 | 15.0 | 8 |
Agricultural
There are at least 10 wells in the area which are used entirely or in part for irrigation. The yield of these wells ranges from 20 to 500 gallons a minute; however, owing to small pumps the potential yield is often not attained. No estimate of daily pumpage of these wells was made, as the pumpage depends upon the distribution and quantity of rainfall during the growing season. Judging from the reported capacities of the wells it is estimated that the total daily pumpage is about 2,500,000 gallons during the exceptionally dry years, and that there is virtually no pumpage during exceptionally wet years.
An irrigation well that is typical of the type which could be installed in this section of the Kansas River Valley is the well owned by Howard T. Jackson. This well was drilled in 1933 under the sponsorship of the Topeka Chamber of Commerce. The well is 60 feet deep., has 24-inch perforated casing opposite coarse sand, and is capable of yielding 50a gallons a minute with a 12-foot drawdown. The plant irrigates 35 acres and in 1936 a total of 44.5 acre-feet of water was pumped at a cost of $3.17 per acre-foot. The total power consumed for 1936 was 4,096 kilowatt hours.
Industrial
Use of ground water by industry exceeds 9,000,000 gallons a day (Table 5). Most ground water is used in industry for cooling, condensing, and cleaning. The daily pumpage reaches a maximum during, summer months which greatly exceeds the yearly average given in Table 5.
Table 5--Ground water use in the Kansas River Valley area between Topeka and Lawrence, Kansas, based on 1950 inventory
| Use | Consumption, gallons per day |
|---|---|
| Industrial | 9,500,000 |
| Municipal | 2,500,000 |
| State Hospital (Topeka) | 500,000 |
| Rural use, domestic and stock (estimated) | 350,000 |
| Irrigation (seasonal and highly variable) | 2,500,000 |
| Air conditioning in churches, homes, and stores (seasonal) | 100,000 |
| Total daily consumption, maximum | 12,850,000 |
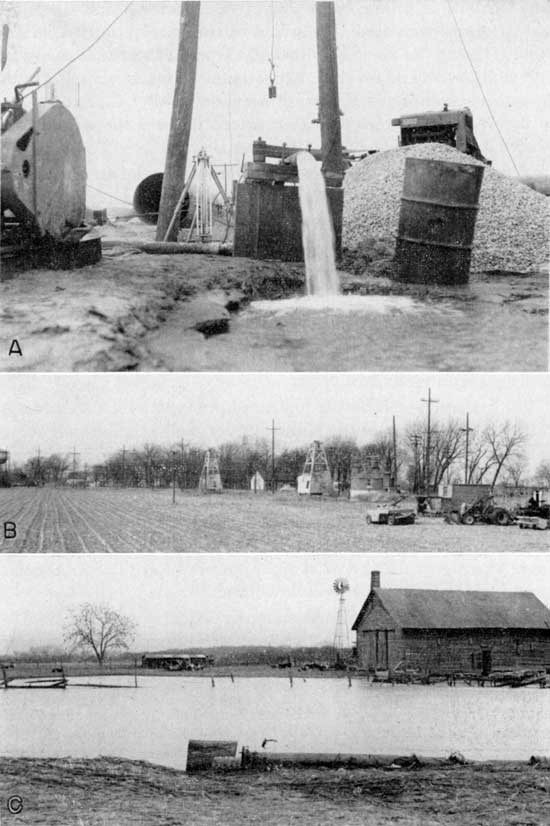
Plate 7--A, Pumping test at Westvaco Chemical Co. near Lawrence, Douglas County. B, Water wells of the State Hospital at Topeka, NE sec. 26, T. 11 S., R. 15 E. C, Pond on flood plain south of Kiro, Shawnee County, with water surface more than 3 feet above water table. Picture taken after three months of little rainfall.
Nearly 50 percent of the total quantity of ground water used for all purposes is pumped by industry from a small area near the south bank of Kansas River in Topeka. The only large industrial users of ground water not in this area are the Goodyear Tire and Rubber Company north of Topeka and the Westvaco Chemical Company northeast of Lawrence (Pl. 7A). Many of the wells in Topeka are so close to the river that water filters directly to the wells from the river and the temperature of water pumped from the wells varies directly with the temperature of the river water. Water from heavily pumped wells close to the river may have a temperature difference of as much as 20° F. during the year. Wells at a greater distance from the river will have a water temperature that remains between 56° F. and 58° F. throughout the year.
Perforated concrete casings, well screens, and perforated metal casings with gravel packing are all used in local well construction. Some perforated concrete casings have been used successfully for 18 years. These wells have been pumped only moderately.
Public supplies
The State Hospital at Topeka obtains all water from wells adjacent to Kansas River (Pl. 7B). At the present time two wells are being pumped and a third well is drilled but not pumped as yet. Both the Topeka and the Lawrence municipal water supplies are regularly supplemented by water from wells on the south side of Kansas River. The Topeka water plant has two, large-diameter dug wells and two gravel-packed wells which have a total capacity of 4,000,000 gallons of water a day and the Lawrence plant has three wells with a total capacity of 1,500,000 gallons of water a day. Both plants pump the well water at rates well below the total capacities of the systems. A fourth well to supplement the three existing wells will soon be constructed at Lawrence. In case of an emergency the entire municipal supply can be obtained from the four wells. The town of Perry obtains all municipal water from a well near the center of town.
Potential Development
No shortage of ground water was found to exist at the present time in the Kansas River Valley, and no shortage seems likely in the near future. There is, however, danger in spacing wells too close together. If it were not for rapid recharge by Kansas River, many industrial wells would experience serious mutual pumping interference at the present time.
Wells in upland areas are much less dependable than the wells in the major valleys. Many wells fail during exceptionally dry periods and water must be hauled for domestic and stock use. Conditions would be improved in many cases by a general deepening of the shallower wells and the location of new wells in more advantageous bedrock areas.
Considering the results of the pumping tests given in Table 4 it is quite certain that yields of as much as 1,000 gallons a minute can be obtained from the deeper alluvial fills in the Kansas River Valley and that yields of more than 200 gallons a minute can be obtained at most localities in the valley. In many places a general lowering of the water table from 3 to 8 feet would cause the river to recharge the alluvium continuously, thus greatly increasing the potential ground-water yield of the area as a whole.
Quality
The chemical character of the ground water in the Kansas River Valley and the adjacent uplands is shown by analyses of 24 samples of water collected from water wells and test holes. The analyses' (Table 6) were made by Howard A. Stoltenberg in the Water and Sewage Laboratory of the Kansas State Board of Health and by the Kansas City Testing Laboratory, Inc. The analyses show only the dissolved mineral content of the water.
The following discussion of the chemical constituents of ground water has been adapted from publications of the U. S. Geological Survey and the State Geological Survey of Kansas.
Dissolved solids
The evaporation of natural water leaves a residue that consists essentially of mineral matter which may include some organic material and a small amount, of water of crystallization. Water containing more, than 1,000 parts per million of dissolved solids is sometimes used successfully for domestic or irrigation purposes; however, it is in most cases likely to contain certain constituents in quantities sufficient to make its use unsatisfactory. Water containing less than 500 parts per million of dissolved solids is generally suitable for most purposes unless containing excessive quantities of iron, fluoride, nitrate, or other less common constituents which are not subsequently discussed and are not regularly present in well water of eastern Kansas.Table 6--Analyses of water from typical wells, test holes, and spring in Kansas River Valley in the Lawrence Topeka area (Dissolved constituents given in parts per million‡)
| Location | Depth, feet |
Geologic source | Date of collection |
Temp., °F |
Dissolved solids |
Silica (SiO2) |
Iron (Fe) |
Calcium (Ca) |
Magnesium (Mg) |
Sodium and potassium (Na + K) |
Bicarbonate (HCO3) |
Sulfate (SO4) |
Chloride (Cl) |
Fluoride (Fl) |
Nitrate (NO3) |
Hardness as CaCO3 |
||
|---|---|---|---|---|---|---|---|---|---|---|---|---|---|---|---|---|---|---|
| Total | Carbonate | Non- carbonate |
||||||||||||||||
| 10-14-36dd | 56 | Soldier Creek alluvium |
1-24-1950 | 57 | 828 | 6.8 | 13 | 113 | 27 | 174 | 587 | 48 | 169 | 0.1 | 1.2 | 393 | 393 | 0 |
| 11-15-18bc | 34 | Kansas River alluvium |
1-24-1950 | 58 | 449 | 26 | 0.06 | 118 | 15 | 17 | 354 | 54 | 16 | 0.4 | 29 | 356 | 290 | 66 |
| 11-15-21aa | 35 | Kansas River alluvium |
1-24-1950 | 57.5 | 412 | 2.4 | 3.9 | 113 | 8.4 | 23 | 344 | 57 | 16 | 0.3 | 1.3 | 316 | 282 | 34 |
| 11-15-26ab | 51 | Kansas River alluvium |
6-13-45 | - | 508 | 15 | 0.94 | 94 | 17 | 50 | 266 | 98 | 60 | 0.3 | 9.7 | 304 | 218 | 86 |
| 11-16-20bc | 46 | Kansas River alluvium |
1-24-1950 | 56.5 | 641 | 25 | 1.7 | 156 | 28 | 32 | 429 | 81 | 93 | 0.2 | 13 | 509 | 352 | 157 |
| 11-16-13bc | 33 | Meade fm. | 1-24-1950 | 57 | 850 | 24 | 0.13 | 183 | 21 | 33 | 200 | 28 | 81 | 0.1 | 381 | 543 | 164 | 379 |
| 11-16-18bc | 70 | Kansas River alluvium |
6-29-46 | - | 640 | 20 | 0.25 | 146 | 19 | 37 | 390 | 106 | 63 | 0.3 | 1.8 | 442 | 320 | 122 |
| 11-17-20bb | 29 | Kansas River alluvium |
1-24-1950 | 54 | 403 | 27 | 0.05 | 110 | 7.6 | 16 | 298 | 65 | 7.0 | 0.2 | 23 | 306 | 244 | 62 |
| 11-18-19bc | 26 | Kansas River alluvium |
12-2-1950 | 56.5 | 346 | 24 | 0.18 | 90 | 11 | 19 | 315 | 35 | 9 | 0.6 | 2 | 270 | 258 | 12 |
| 11-19-27bc | 33 | Sanborn fm. | 12-2-1950 | 57 | 230 | 12 | 0.35 | 61 | 5.4 | 11 | 181 | 12 | 9 | 0.1 | 30 | 174 | 148 | 26 |
| 11-19-31bc | 27 | Kansas River alluvium |
12-2-1950 | 57.5 | 456 | 25 | 1.8 | 131 | 15 | 16 | 442 | 34 | 16 | 0.3 | 1.1 | 388 | 362 | 26 |
| *12-17-4db | - | Deer Creek ls. | 1-24-1950 | 58.5 | 358 | 14 | 0.05 | 108 | 8.6 | 13 | 348 | 30 | 8.0 | 0.1 | 4.9 | 305 | 286 | 19 |
| 12-19-5dd | 24 | Kansas River alluvium |
12-2-1950 | 56 | 424 | 27 | 4 | 113 | 19 | 17 | 425 | 14 | 22 | 0.5 | 2 | 360 | 348 | 12 |
| 12-19-14cd | 216 | Tonganoxie ss. | 12-2-1950 | 57.1 | 545 | 16 | 1.9 | 75 | 16 | 78 | 244 | 11 | 43 | 0.2 | 186 | 253 | 200 | 53 |
| 12-19-15ba | 22 | Kansas River alluvium |
12-2-1950 | 57.5 | 416 | 25 | 12 | 117 | 16 | 17 | 455 | 4.5 | 11 | 0.2 | 1.7 | 358 | 358 | 0 |
| 12-19-23ba | 142 | Tonganoxie ss. | 12-2-1950 | 55.7 | 309 | 22 | 1.1 | 61 | 8.2 | 44 | 309 | 2.9 | 14 | 0.2 | 4.9 | 186 | 186 | 0 |
| 12-19-23dc | 170 | Tonganoxie ss. | 3-11-1950 | - | 369 | 16 | 1.9 | 95 | 11 | 24 | 334 | 30 | 10 | 0.2 | 18 | 282 | 274 | 8 |
| 12-19-24db | 39 | Lawrence sh. | 12-2-1950 | 56.1 | 1,695 | 19 | 0.5 | 350 | 89 | 85 | 627 | 587 | 154 | 0.2 | 102 | 1,239 | 514 | 725 |
| 12-19-26ab | 190 | Tonganoxie ss. | 3-16-1950 | - | 21,430 | 15 | 20 | 615 | 257 | 7,338 | 237 | 279 | 12,800 | 0.9 | 8.8 | 2,590 | 194 | 2,396 |
| †12-20-29ac1 | 55 | Kansas River alluvium |
6-27-1950 | - | 583 | 27.9 | 2.0 | 97.6 | 9.5 | 37 | 311.1 | 65.4 | 285 | - | 0 | 283 | 255 | 28 |
| †12-20-29ac2 | 55 | Kansas River alluvium |
6-27-1950 | - | 729 | 38.0 | 7.4 | 116.9 | 12.3 | 48.3 | 382 | 44 | 73 | - | 0 | 357 | 313 | 44 |
|
‡One part per million is equivalent to one pound of substance per million pounds of water or 8.33 pounds per million gallons of water. *Spring. †Test hole. |
||||||||||||||||||
The dissolved solids in water derived from alluvium and terrace deposits ranged from 230 to 850 parts per million. With the exception of two wells, the dissolved solid content was under 650 parts per million. Water from wells tapping bedrock supplies showed generally a higher dissolved solid content, and water from one well in bedrock contained as high as 21,430 parts per million dissolved solids.
Hardness
The hardness of water is generally the property that receives the most attention and is most commonly recognized by its effects when soap is used with the water. These constituents are also the active agents in the formation of the greater part of all the scale found in steam boilers and in other vessels in which water is heated or evaporated.
In addition to total hardness, the analyses indicate the carbonate hardness and the noncarbonate hardness. The carbonate hardness is that due to the presence of calcium and magnesium bicarbonate, and it is largely removed by boiling. In some reports this type of hardness has been called temporary hardness. The noncarbonate hardness is due to the presence of sulfates or chlorides of calcium and magnesium which cannot be removed by boiling, and has sometimes been called permanent hardness. With reference to use with soap, there is no difference between carbonate and noncarbonate hardness. In general the noncarbonate hardness forms a harder adhering scale in steam boilers.
Water having a hardness of less than 50 parts per million is generally rated as soft, and its treatment for removal of hardness under ordinary circumstances is not necessary. Hardness between 50 and 150 parts per million does not seriously interfere with the use of water f or most purposes, but it does slightly increase the consumption of soap, and its removal by a softening process is profitable for laundries or other industries using large quantities of soap. Water in the upper part of this range will cause considerable scale in steam boilers. Hardness above 150 parts per million can be noticed by anyone, and if the hardness is above 200 or 300 parts per million it is common practice to soften water for household use or to install cisterns to collect sof t rain water.
Water samples collected from the alluvium of the Kansas River Valley ranged in hardness from 174 to 509 parts per million and averaged 357 parts per million. Water from bedrock sources ranged in hardness from 186 to 259 parts per million.
Iron
Next to hardness, iron is the constituent of natural waters that receives the most attention. The quantity of iron in ground water may differ greatly from place to place, even though the water is from the same formation. If a water contains much more than 0.3 part per million of iron, the excess may separate out as a reddish sediment. Iron, which may be present in sufficient quantity to, give a disagreeable taste and to stain clothing, porcelain ware, and cooking utensils, may be removed from most waters by simple aeration and filtration, but a few waters require the addition of lime or some other substance.
The iron content of the ground water in the area under investigation ranged from 0.05 to 20.0 parts per million (Table 6). The average iron content of the waters tested was 3.3 parts per million.
Chloride
Water containing less than 150 parts per million of chloride is not objectionable for most uses but that containing more than 350 parts per million is often objectionable for irrigation or industrial use. Water containing more than about 500 parts per million becomes objectionable to the taste.
The chloride content of water in the alluvium of Kansas River Valley is generally less than 100 parts per million and is commonly less than 25 parts per million. The water from one well in the alluvium contained 169 parts per million chloride. Water from one well in bedrock had a chloride content of 12,800 parts per million.
Fluoride
Although quantities of fluoride are relatively small as compared with other common constituents of natural water, it is desirable to know the amount of fluoride present in water that is likely to be used by children. Fluoride in water has been associated with the dental defect known as mottled enamel, which may appear on the teeth of children who drink water containing excessive quantities of fluoride during the period of formation of their permanent teeth. Water containing much more than 1.5 parts per million of fluoride is likely to produce mottled enamel. If the water contains as much as 4 parts per million of fluoride, 90 percent of the children exposed are likely to have mottled tooth enamel, and 35 percent or more of the cases will be classed as moderate or worse (Dean, 1936). Small quantities of fluo,ride, not sufficient to cause mottled enamel, are likely to be beneficial by decreasing dental cavities (Dean and others, 1941).
All the samples of water collected from this area contained less than 1.0 part per million fluoride. The average fluoride content of all the samples analyzed for this, report is 0.28 part per million.
Nitrate
An unusually large amount of nitrate in well water may cause cyanosis when the water is used in preparation of a baby's formula. The nitrate content for waters analyzed from each formation in the area covered by this report is shown in Table 6. The difference in nitrate content for the water is considerable and seemingly is not related to any geologic formation. A high nitrate content is, probably due to the inflow of surface water around the well or to the movement of water through soil that contains more than a normal amount of nitrate. Wells near fields of alfalfa or other legumes might receive some of the nitrate which these, plants, have added to the soil. Shallow and poorly sealed wells allow more infiltration of surface seepage (Pl. 7C) than do deeper, more tightly eased wells. Thus shallow wells in alluvium or terrace deposits and dug wells that are not cemented in the top portion are more, likely to have water of high nitrate content.
Water that contains more than 90 parts per million of nitrate is considered by the Kansas State Board of Health likely to cause inf ant cyanosis. Water containing less than 10 parts of nitrogen, or 45 parts of nitrate, is generally considered safe.
All the water samples analyzed with the exception of two contained some nitrate. Three samples exceeded the critical amount of 90 parts per million, ranging from 102 to 381 parts per million. The remainder of the samples had less than 30 parts, per million.
Prev Page--Geology || Next Page--Well Records
Kansas Geological Survey, Geology
Placed on web April 10, 2012; originally published June 1, 1952.
Comments to webadmin@kgs.ku.edu
The URL for this page is http://www.kgs.ku.edu/Publications/Bulletins/96_5/06_water.html