![]()
Prev Page--Stratigraphy || Next Page--Utilization
Analyses
Location of Outcrops Sampled
Table 1 gives the locations of outcrops sampled and the abbreviation used for each locality.
The following abbreviations designate the height in the section at which the sample was taken. The numbers ending the abbreviation increase from the base to the top of the section, with 1 being the bed above the lower contact of the Fort Hays.
Sm-2-1a--sample taken at lower part of first, or lowest, bed.
Sm-2-1b--sample taken at upper part of first, or lowest, bed.
Sm-2-1/4--sample taken one-fourth distance up the measured section.
Sm-2-1/2, Sm-2-3/4 sample taken one-half, three-fourths distance up the measured section.
Thee letter "I" at the end of an abbreviation means that the sample analyzed consisted only of the coarser portion of the insoluble residue.
Table 1--Location of outcrops sampled
| Locality | County | Sec | T. South |
R. West |
Remarks |
|---|---|---|---|---|---|
| El-1 | Ellis | 11 | 13 | 20 | 6 miles west of Yocemento |
| El-2 | Ellis | 13 | 11 | 19 | |
| El-3 | Ellis | 27 | 11 | 18 | 5 miles south of Rooks-Ellis border on route 183. |
| El-4 | Ellis | 36 | 11 | 19 | |
| El-6 | Ellis | 3 | 13 | 18 | |
| Fn-1 | Finney | SW NW 22 | 22 | 30 | |
| Ha-1 | Hamilton | 25 | 22 | 43 | |
| Ha-2 | Hamilton | 3 | 22 | 43 | |
| Jw-1 | Jewell | NW SW 10 | 2 | 8 | |
| Jw-2 | Jewell | NW 9 | 2 | 7 | |
| Jw-3 | Jewell | 27 | 4 | 8 | |
| Ln-1 | Lane | 28 | 20 | 27 | |
| Ns-1 | Ness | 33 | 18 | 26 | |
| Ob-1 | Osborne | NW 13 | 7 | 15 | |
| Ob-2 | Osborne | 19, 20, 29, 30 | 10 | 15 | |
| Ob-3 | Osborne | 31 | 9 | 12 | |
| Ob-4 | Osborne | 19, 30 | 9 | 12 | |
| Ph-1 | Phillips | SE SW 36 | 4 | 18 | |
| Ro-1 | Rooks | 35 | 10 | 17 | just south of Ro-3 |
| Ro-2 | Rooks | SW 15 | 7 | 18 | |
| Ro-3 | Rooks | 26 | 10 | 17 | |
| Ro-4A and B |
Rooks | SW 34 | 7 | 19 | within 200 feet of one another |
| Sm-1 | Smith | NE 32 | 5 | 13 | |
| Sm-2 | Smith | SW 36 | 4 | 15 | Cedar quarry |
| Tr-1 | Trego | NE SE 1 | 15 | 23 | |
| Tr-2 | Trego | 4,9,5,8 | 15 | 23 |
Sample Preparation
Roughly one-fifth of the field sample was set aside for thin sections; the remainder was crushed in a jaw crusher to pass an 8-mesh screen. The crushed sample was divided, using a standard sample splitter, until two 100-gram samples were obtained. One was reserved for insoluble residues and heavy mineral separation; the other was reduced by further splitting to approximately 20 grams for making a chemical analysis.
Petrography
Insoluble Residues
A weighed portion of each sample of chalk was digested in cold dilute hydrochloric acid (1:20) in order to determine the relative percentage of acid-insoluble material present. The results are summarized in Table 2, which also shows the percentage of insoluble grains larger and smaller than 0.002 mm, and the percentage of "heavy" and "light" grains in the large fraction. In general, the largest percentage of insoluble residue occurs at the base of the lowest chalk bed of the Fort Hays, and decreases rapidly to the top of the first bed. Higher in the section the average percentage of insoluble material is still less, but there is a gradual constant increase from the minimum near the center to the top of the section.
Table 2--Insoluble residue of chalk samples, percent
| Sample no.1 |
Total | Total grains <.002mm |
Total grains >.002mm |
"Heavy"2 grains >.002mm |
"Light"3 grains >.002mm |
|---|---|---|---|---|---|
| El-1-1a | 17.40 | 12.53 | 4.87 | 0.22 | 4.65 |
| El-1-1b | 10.21 | 9.71 | 0.50 | 0.04 | 0.46 |
| El-1-3 | |||||
| El-1-1/4 | 6.55 | 6.26 | 0.29 | 0.08 | 0.21 |
| El-1-5 | |||||
| El-1-1/2 | 4.38 | 4.29 | 0.09 | 0.02 | 0.07 |
| El-1-7 | 3.60 | 3.53 | 0.07 | 0.01 | 0.06 |
| El-1-3/4 | |||||
| El-1-11 | |||||
| El-1-T | 3.79 | 3.74 | 0.05 | 0.01 | 0.04 |
| El-2-1a | 15.3 | 12.9 | 2.4 | 0.07 | 2.33 |
| El-2-1b | 7.40 | 3.85 | 0.55 | 0.06 | 0.49 |
| El-3-1a | 32.1 | 20.00 | 12.1 | 0.3 | 11.8 |
| El-3-1b | 8.02 | 7.17 | 0.85 | 0.05 | 0.80 |
| Jw-3-1a | 38.03 | 16.44 | 21.59 | 0.13 | 21.46 |
| Jw-3-1b | 7.88 | 7.70 | 0.18 | 0.01 | 0.17 |
| Jw-2-1a | 29.33 | 14.65 | 14.68 | 0.31 | 14.37 |
| Jw-2-1b | 7.73 | 7.59 | 0.14 | 0.01 | 0.13 |
| Jw-1-4a | 4.09 | 4.05 | 0.04 | 0.02 | 0.02 |
| Jw-1-1/4 | |||||
| Jw-1-6 | 2.92 | 2.79 | 0.13 | 0.03 | 0.10 |
| Jw-1-1/2 | |||||
| Jw-1-9 | 7.05 | 6.92 | 0.13 | 0.01 | 0.12 |
| Jw-1-3/4 | |||||
| Jw-1-10 | 8.65 | 8.54 | 0.11 | 0.01 | 0.10 |
| Jw-1-T | |||||
| Ns-1-1a | 9.06 | 6.35 | 2.71 | 1.04 | 2.67 |
| Ns-1-1b | 85.74 | 5.31 | 0.43 | 0.03 | 0.40 |
| Ln-1-1a | 8.69 | 5.94 | 2.75 | 0.06 | 2.69 |
| Ln-1-1b | 6.67 | 5.64 | 1.03 | 0.05 | 0.98 |
| Ha-1-1a | 28.31 | 14.08 | 14.23 | 0.12 | 14.11 |
| Ha-1-1b | 11.56 | 9.82 | 1.74 | 0.06 | 1.68 |
| Tr-1-1a | 8.16 | 7.98 | 0.18 | 0.02 | 0.16 |
| Tr-1-1b | 2.95 | 2.85 | 0.10 | 0.01 | 0.09 |
| Ob-2-1a | 14.76 | 12.16 | 2.60 | 0.09 | 2.51 |
| Ob-2-1b | 6.77 | 6.59 | 0.18 | 0.06 | 0.12 |
| Ob-3-1a | 71.08 | 13.34 | 57.74 | 0.23 | 57.51 |
| Ob-3-1b | 9.03 | 8.51 | 0.52 | 0.07 | 0.45 |
| Ob-4-7 | 2.62 | 2.53 | 0.09 | 0.02 | 0.07 |
| Ob-4-1/2 | |||||
| Ob-4-10 | 7.10 | 7.04 | 0.06 | 0.003 | 0.057 |
| Ob-4-3/4 | |||||
| Ob-4-14 | 4.40 | 4.35 | 0.05 | 0.005 | 0.045 |
| Ob-4-T | |||||
| Ro-3-1a | 25.57 | 14.88 | 10.69 | 0.09 | 10.60 |
| Ro-3-1b | 12.55 | 9.16 | 3.39 | 0.06 | 3.33 |
| Ro-3-A4 | 3.89 | 3.80 | 0.09 | 0.0003 | 0.0897 |
| Ro-3-B4 | 5.16 | 5.04 | 0.12 | 0.03 | 0.09 |
| Ro-3-5 | 3.49 | 3.44 | 0.05 | 0.003 | 0.047 |
| Ro-3-1/4 | |||||
| Ro-3-6 | 3.95 | 3.87 | 0.08 | 0.01 | 0.07 |
| Ro-3-8 | 4.05 | 4.00 | 0.05 | 0.005 | 0.040 |
| Ro-3-11 | 4.96 | 4.63 | 0.33 | 0.002 | 0.328 |
| Ro-3-1/2 | |||||
| Ro-3-(16-19)4 | 3.63 | 3.59 | 0.04 | 0.02 | 0.02 |
| Ro-3-3/4 | |||||
| Ro-3-22 | 7.50 | 7.48 | 0.02 | 0.007 | 0.014 |
| Ro-3-24 | 6.54 | 6.52 | 0.02 | 0.01 | 0.01 |
| Ro-3-T | |||||
| Ro-3-25 | 6.65 | 6.60 | 0.05 | 0.003 | 0.047 |
| Ro-3-26 | 7.46 | 7.44 | 0.02 | 0.002 | 0.018 |
| Ro-4-B1a | 69.62 | 12.63 | 56.99 | 0.16 | 56.83 |
| Ro-4-B1b | 5.78 | 5.67 | 0.11 | 0.006 | 0.105 |
| Ro-4-A1a | 51.46 | 16.10 | 35.36 | 0.70 | 34.66 |
| Ro-4-A1b | 28.4 | 10.9 | 17.5 | 0.5 | 17.0 |
| Ph-1-1a | 22.9 | 14.9 | 8.0 | 0.9 | 7.1 |
| Ph-1-1b | 6.79 | 6.48 | 0.31 | 0.06 | 0.25 |
| Sm-1-1a | 62.16 | 13.68 | 48.48 | 0.39 | 61.77 |
| Sm-1-1b | 7.27 | 6.96 | 0.31 | 0.03 | 0.28 |
| Sm-1-2 | 4.17 | 4.06 | 0.11 | 0.02 | 0.09 |
| Sm-1-1/4 | |||||
| Sm-1-6 | 2.36 | 2.32 | 0.04 | 0.005 | 0.035 |
| Sm-1-1/2 | |||||
| Sm-1-9 | 2.91 | 2.84 | 0.07 | 0.01 | 0.06 |
| Sm-1-3/4 | |||||
| Sm-1-12 | 4.17 | 4.09 | 0.08 | 0.01 | 0.07 |
| Sm-1-T | |||||
| Sm-2-1a | 72.45 | 16.87 | 55.58 | 0.63 | 54.95 |
| Sm-2-1b | 7.88 | 7.12 | 0.76 | 0.02 | 0.74 |
| Sm-2-4 | 10.12 | 9.92 | 0.20 | 0.02 | 0.18 |
| Sm-2-1/4 | |||||
| Sm-2-9 | 4.59 | 4.50 | 0.09 | 0.05 | 0.04 |
| Sm-2-1/2 | |||||
| Sm-2-14 | 1.96 | 1.94 | 0.02 | 0.005 | 0.015 |
| Sm-2-3/4 | |||||
| Sm-2-15 | 3.79 | 3.66 | 0.13 | 0.055 | 0.075 |
| Sm-2-T | |||||
| 1Complete location given in Table 1. 2Specific gravity greater than 2.85. 3Specific gravity less than 2.85. 4Composite. |
|||||
The geographical variation at two horizons in the lower part of the Fort Hays is shown in Figure 2. The data suggest that the purest chalk is in the southwest part of the outcrop area. However, samples from other levels show that the chalk of highest purity is present in the sections studied in Smith County. The purest chalk analyzed contains 98.04 percent acid-soluble material and occurs in bed 14 of the Sm-2 section.
Figure 2--Geographical variation of insoluble residues at two horizons in the lower part of the Fort Hays.
Mineralogy of insoluble residue
"Heavy" and "light" fractions of the residues were separated by means of bromoform, and the minerals were identified. The heavy mineral suite is a restricted one, and consists predominantly of ilmenite, leucoxene, magnetite, tourmaline, zircon, muscovite, and biotite. Pyrite and limonite occur as authigenic or secondary minerals. Limonite is observed in scattered concretions as large as 2 inches in long diameter.
The light minerals consist chiefly of quartz, with minor quantities of feldspar and chalcedony or chert. Minerals lost in acid digestion include calcite and collophane. The calcite occurs as cement, as minute grains, and as fossils and fossil fragments. An electron micrograph of the grains indicates a roughly rectangular shape suggesting minute rhombohedrons. The diameters range from 0.2 to 0.55 microns.
Thin Sections
All thin sections of the Fort Hays chalk are composed essentially of fine-grained calcite and of coarser calcite in foraminiferal tests and in fragments of larger shells. The matrix, or very fine material, comprises from 60 to 80 percent of the chalk. Embedded in the matrix are microfossils (which make up the next largest constituent), a few mineral grains, and grains of calcite which are either secondary or have been derived from Inoceramus shells.
Of the many types of microfossils present, Gumbelina, Globerotalia, Globigerina, and Textularia (Lalicker, 1947, oral communication) were identified. Most of the microfossils are made of calcite, and limonite is present in some. Microfossils comprise 17 to 34 percent of the chalk above the lowest bed.
Limonite occurs as the massive form and as a fossil replacement ranging from 0.5 to 8 percent of the thin section, the average being about 2 percent. One thin section showed some cubic pseudomorphs of limonite. The limonite is opaque and is yellow-brown in reflected light.
Most of the quartz is too small to be distinguished from feldspar. The largest amount of quartz and feldspar occurs in thin sections of the chalk just above the lower contact of the Fort Hays. In beds higher in the section the percentage of quartz and feldspar ranges from less than 0.05 to about 1.7 percent. The grains are anhedral.
Microcline was observed in each of the three thin sections made of chalk collected just above the lower Fort Hays contact. The grains are anhedral and the amount was less than 0.1 percent. More microcline may be present, but does not show quadrille structure. In all the thin sections of chalk collected above the first bed, only 3 grains show the quadrille structure of microcline.
In 20 thin sections, three plagioclase grains showing polysynthetic twinning were seen. In only one grain could the extinction angle be measured. The extinction angle is 15 degrees, indicating that the plagioclase is albite or andesine. Most of the feldspar was unaltered, but a few grains were partially altered to sericite and kaolin.
Biotite is present in 85 percent of the thin sections in small amounts. Quantities range from 0.01 to 0.1 percent. Collophane is present in 80 percent of the samples in quantities ranging from about 0.1 to 0.5 percent. The grains are either isotropic or slightly anisotropic with extremely low birefringence. The color is a faint tan and the grains are irregular.
Chalcedony is present in 50 percent of the thin sections in amounts of 0.2 percent or less. It is colorless.
Plate 1A is a photomicrograph of typical chalk from Smith County, showing the matrix of fine-grained calcite and the scattered microfossils. Petrographic analyses from thin sections are given in Table 3.
Plate 1--A, Photomicrograph of chalk thin section Sm-2-3/4 (Smith County, Kansas). Plane polarized light, X45. Most of the thin section consists of fine-grained calcite. Microfossils and coarse grains of calcite compose essentially the coarser portion of the thin section. A grain of either quartz or feldspar, a grain of limonite, and a grain of magnetite or ilmenite are also present. B, Exposure of Fort Hays chalk in the SW sec. 36, T. 4 S., R. 15 W., Smith County, Kansas. Circle shows stratigraphic position of photomicrograph above.
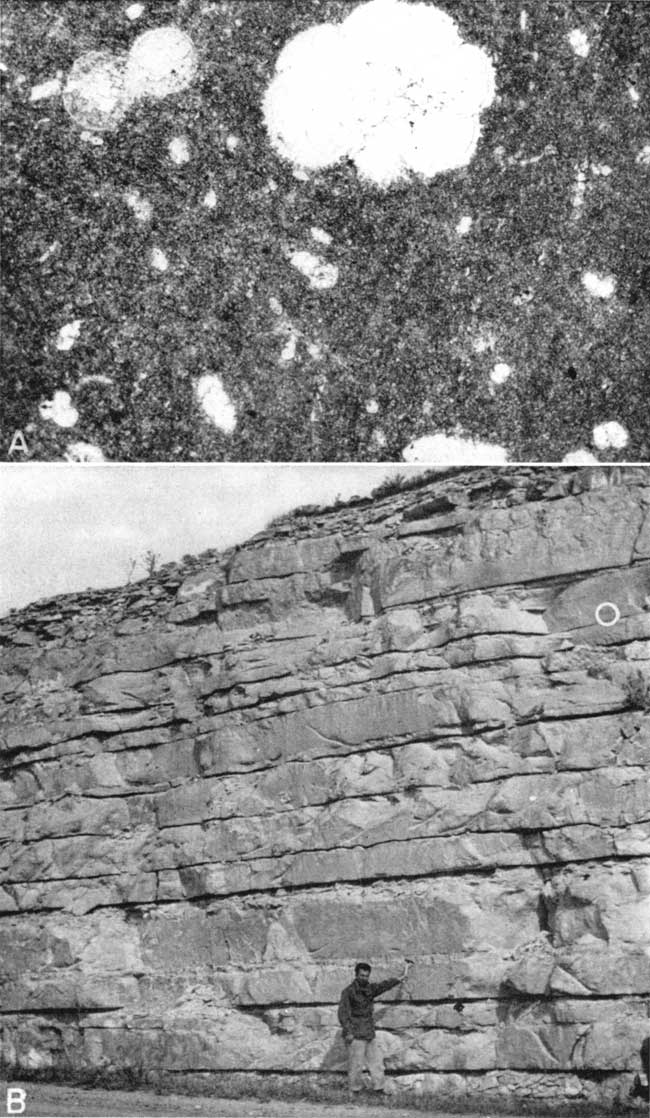
Table 3--Petrographic analyses of chalk samples from thin sections. (Figures are percentages.)
| Sample no. |
Quartz feldspar |
Limonite | Coarse calcite |
Fossils | Calcite matrix |
Biotite | Collophane | Chalcedony | Pyrite | Limonite or magnetite |
Leucoxene |
|---|---|---|---|---|---|---|---|---|---|---|---|
| Sm-2-1/4 | Tr | 2 | 4 | 34 | 60 | Tr | Tr | Tr | Tr | Tr | |
| Sm-2-1/2 | Tr | 1 | 3 | 30 | 66 | Tr | Tr | Tr | Tr | ||
| Sm-2-3/4 | Tr | 1 | 1 | 17 | 81 | Tr | Tr | Tr | |||
| Sm-2-T | Tr | 2 | 2 | 17 | 79 | Tr | Tr | Tr | |||
| Ro-3-A8 | 1 | 1 | 2 | 18 | 78 | Tr | 1 | ||||
| Ro-3-(16-19) | Tr | 1 | 1 | 30 | 68 | Tr | Tr | ||||
| Ro-3-24 | Tr | 1 | 1 | 24 | 74 | Tr | |||||
| Ro-3-26 | Tr | 1 | Tr | 16 | 83 | 1 | 1 | 1 | |||
| El-1-1a | 8 | 4 | 1 | 13 | 73 | Tr | Tr' | Tr | Tr | ||
| Ln-1-1a | 4 | 2 | 4 | 19 | 71 | Tr | Tr | Tr | Tr | ||
| Jw-2-1b | Tr | 3 | 2 | 24 | 70 | Tr | Tr | ||||
| Sm-2-1b | 1 | 4 | 3 | 31 | 60 | Tr | Tr | Tr | Tr | ||
| Ph-1-1b | 1 | 3 | 3 | 31 | 61 | Tr | |||||
| El-1-1b | 1 | 3 | 3 | 17 | 76 | Tr | Tr | Tr | Tr | ||
| Ro-3-1b | 2 | 3 | 1 | 18 | 76 | Tr | Tr | ||||
| Ha-1-1b | 2 | 2 | 3 | 30 | 63 | Tr | Tr | ||||
| Ln-1-1b | 1 | 8 | 4 | 28 | 59 | Tr | Tr | Tr | |||
| Tr-1-1b | Tr | 3 | 3 | 27 | 67 | Tr | |||||
| Ro-4-B1b | 1 | 2 | 2 | 30 | 65 | Tr | Tr |
Geochemistry
Procedure
The fractions set aside for chemical analysis were ground with a porcelain mortar and pestle until they passed an 80-mesh screen. The analyses were made in sets of six samples on an oven dry basis. Loss on ignition, total sulfur, P2O5, SiO2, Al2O3, Fe2O3, TiO2, CaO, and MgO were determined by standard methods (Hillebrand and Lundell, 1946; Kolthoff and Sandel, 1946; Scott, 1939) with the exception of TiO2, which was determined gravimetrically by a method worked out in the Survey laboratory by Runnels.
Determination of TiO2
Our method of determining TiO2 utilizes cupferron (ammonium salt of beta nitrosophenylhydroxylamine) (Thornton, 1927, p. 90; Scott, 1939, p. 6, 466-469, 1035, 1099) to precipitate iron and titanium in the presence of aluminum. Any vanadium or zirconium present is included with the precipitate. (This method is used for material which contains appreciable titanium such as insoluble residues, clays, and shales.) The procedure is as follows. The weighed R2O3 precipitate is fused with KHSO4 with care taken that all the precipitate is fused. (If the precipitate is large, it should be crushed in an agate mortar.) The fusion is cooled and dissolved in about 300 cc of HCl (or H2SO4). Cool in an ice bath until the temperature is 5° to 10° C. Then with stirring, slowly add a 4 to 6 percent water solution of cupferron until a white precipitate forms. (The precipitate soon vanishes.) Then add 10 percent excess. Allow the precipitate to settle and filter through medium ashless paper. Wash well with cool 1:9 HCl and permit drainage. The precipitate is then placed in tared crucibles, dried, and carefully ignited, allowing about 20 minutes at full heat after charring. Cool, weigh as Fe2O3 and TiO2. (This form was used for the bulk of the chalk analyses.) Fuse this precipitate with KHSO4. Dissolve with about 50 cc water and 10 to 15 cc HCl. Determine the iron with standard dichromate solution as given. Then subtract the weight of Fe2O3 from the total giving TiO2 (+vanadium and zirconium if present) by difference.
Determination of sodium and potassium
The J. Lawrence Smith method of determining sodium and potassium (Hillebrand and Lundell, 1946, p. 788) was used in the analysis of insoluble residues of chalk. Potassium was separated by chloroplatinic acid (Hillebrand and Lundell, 1946, pp. 519-520) with sodium being determined by difference.
Spectrographic Analysis
A 1.5 meter Applied Research Laboratory spectrograph was used and the spectrograms visually inspected with an Applied Research Laboratory Comparitor. Selected samples were mixed with an amalgam consisting of equal parts of graphite powder and chemically pure sodium fluoride to aid in volatilization. In each set of samples a blank of the reagents and the Bureau of Standards sample no. 1a of argillaceous limestone were included for comparison. The results of all spectrographic analyses are given in Table 4.
Table 4--Spectrographic analyses of selected chalk samples
| Sample no.* | Si | Fe | Al | Ti | P | Mn | Ca | Sr | Mg | Na | K | Ba | Li | Zr |
|---|---|---|---|---|---|---|---|---|---|---|---|---|---|---|
| BS-1a | vst | vst | st | st | ** | ** | vst | *** | st | *** | *** | *** | *** | *** |
| Sm-2-1b | st | st | st | ** | ** | ** | vst | *** | ** | *** | *** | *** | *** | *** |
| Sm-2-9 | st | st | st | ** | tr | ** | vst | *** | ** | *** | *** | *** | *** | *** |
| Sm-2-14 | ** | ** | ** | tr | *** | ** | vst | *** | ** | *** | *** | *** | *** | *** |
| Sm-2-15 | st | st | st | ** | ** | ** | vst | *** | ** | *** | *** | *** | *** | *** |
| Sm-1-13 | st | ** | ** | tr | *** | ** | vst | *** | ** | *** | *** | *** | *** | *** |
| El-1-5 | ** | ** | ** | tr | *** | ** | vst | *** | ** | *** | *** | *** | *** | *** |
| El-4-9 | st | st | st | ** | tr | tr | vst | *** | ** | *** | *** | *** | *** | *** |
| Tr-1-11 | st | st | st | tr | tr | ** | vst | *** | ** | *** | *** | *** | *** | *** |
| Tr-1-15 | st | st | st | tr | tr | ** | vst | *** | ** | *** | *** | *** | *** | *** |
| Ob-1-4 | st | st | st | ** | tr | ** | vst | *** | ** | *** | *** | *** | *** | *** |
| Ob-1-5 | st | st | st | tr | tr | ** | vst | *** | ** | *** | *** | *** | *** | *** |
| J-2-1aI | vst | vst | st | vst | ** | tr | ** | *** | ** | *** | *** | *** | *** | *** |
| Ha-1-1aI | vst | vst | st | vst | ** | tr | ** | *** | ** | *** | *** | *** | *** | *** |
| *Complete location given in Table 1. **Small but positive. ***May be present but not shown on spectograph. vst Very strong. st strong. tr Very faint. |
||||||||||||||
Discussion of Data
The great extent of the Fort Hays made it impracticable to sample and analyze each bed. The petrographic and chemical data obtained, however, are judged sufficient to establish that the Fort Hays chalk is essentially the same throughout the area studied. For example, the calcium carbonate content of the chalk ranges from 88 to 98.2 percent (excluding basal samples). The 88-percent calcium carbonate chalk, however, has the same grain size and contains the same minerals and fossils as the purest chalk. This is true for all counties studied.
All samples studied show that the composition of the chalk is comparable to European chalk and suitable as a source of whiting. Deposits that do not meet the specifications for whiting can be beneficiated by standard methods. Examination of thin sections and one photomicrograph show that 60 to 80 percent of the chalk is very fine grained. The actual grain size, as estimated from the magnification of the photomicrograph, is 0.3 microns by 0.3 microns to 0.3 microns by 0.55 microns. This size compares favorably with chemically precipitated chalk and would meet the specifications for whiting.
The tables of analyses do not lend themselves to interpretations of any stratigraphic or geographic variation of chalk constituents. This, coupled with a range of calcium carbonate content in all the samples of only 10 percent, sharply reduced the possibilities for stratigraphic correlation within the Fort Hays member. This is illustrated by graphs of the stratigraphic and geographic variation of the calcium carbonate content plotted from the chemical and petrographic analyses for measured sections (Fig. 6) that represent almost the total height of the Fort Hays. These graphs are shown in Figures 3 and 4.
Figure 3--Geographical variation of calcium carbonate content at specific levels.
Figure 4--Stratigraphic variation of calcium carbonate content.
In the El-1 and Sm-1 sections the calcium carbonate content increased from the base to the "c" level, then decreased at the "d" and "e" levels and increased at the "f" level, or top, with the greatest amount at this level. At Jw-1 the calcium carbonate increased to a maximum at the "c" level, at Ob-4 at the "d" level, and at Sm-2 at the "e" level. In the latter three sections there was a decrease in amount of calcium carbonate from the specified levels to the top of the section.
There is an increase in the calcium carbonate content in the 1 "b" and "c" levels toward the south. The "d", "e", and "f" levels show purer chalk in the central to north-central part of the area studied. The chalks of highest purity also are similar in composition. Thus, CaCO3 ranges from 95.6 percent at El-1 to 98.2 percent at Sm-2. The SiO2 ranges from 1.09 percent at Sm-2 to 1.53 percent at Ro-3, a difference of only 0.44 percent. The R2O3 shows the lowest percentage at Sm-2, 0.60 percent, and the highest at Ro-3, 1.97 percent, a difference of 1.37 percent. MgO, however, is highest at Sm-2 (1.08 percent) while only 0.17 percent at El-1. This is shown graphically in Figure 5.
Figure 5--Geographical variation of impurities in highest CaCO3 samples.
Figure 6--Stratigraphic sections of Fort Hays chalk. A larger version of this figure is available.
The remaining constituents--R2O3 (Fe2O3, Al2)3, TiO2), MgO, and SiO2--are in various mineral impurities and are discussed in detail in the section on petrography. For example, SiO2 occurs as quartz and as a constituent of various silicate minerals. The chemical analyses give only the total percentage of SiO2. Fe2O3 occurs mainly in limonite. The MgO in the chemical analyses is derived mainly from magnesium carbonate.
Chemical analyses of the Fort Hays chalk are given in Table 5. Two analyses of the Codell sandstone and four analyses of insoluble residues are included for comparison. A selected number of samples were analyzed spectrographically (Table 4). No elements which had not been found in chemical or petrographic analyses were found by this method.
Table 5--Chemical analyses of Fort Hays chalk.
| Sample no.8 |
SiO2 | Al2O3 | Fe2O3 | CaO | MgO | P2O5 | S | Igt. loss (140-1000° C) |
CaCo3 (calculated) |
MgCO3 (calculated) |
|---|---|---|---|---|---|---|---|---|---|---|
| El-4-9 | 3.79 | 1.47 | 1.971 | 52.04 | *** | 0.01 | 40.69 | 92.80 | ||
| El-6-0 | 2.30 | 0.47 | 1.48 | 53.43 | 0.17 | *** | *** | 41.23 | 95.27 | 0.36 |
| El-1-1a | 9.02 | 2.78 | 2.82 | 47.30 | 0.97 | tr | tr | 36.82 | 84.34 | 2.03 |
| El-1-1b | 6.59 | 1.14 | 1.77 | 49.84 | 0.52 | tr | tr | 39.78 | 88.87 | 1.09 |
| El-1-3 | 3.46 | 1.90 | 1.56 | 51.53 | 0.81 | tr | *** | 40.11 | 91.89 | 1.69 |
| El-1-5 | 3.47 | 1.291 | 1.12 | 52.88 | *** | *** | 40.43 | 94.29 | ||
| El-1-7 | 2.38 | 1.571 | 0.56 | 52.48 | 0.59 | *** | *** | 40.95 | 93.58 | 1.23 |
| El-1-11 | 1.87 | 0.791 | 1.00 | 53.56 | 0.17 | *** | *** | 41.59 | 95.51 | 0.36 |
| El-2-1a | 7.52 | 2.79 | 2.421 | 48.53 | 0.38 | 0.10 | *** | 38.07 | 86.54 | 0.79 |
| El-2-1b | 3.69 | 2.751 7 | 51.76 | 0.38 | 0.20 | *** | 40.70 | 92.30 | 0.79 | |
| El-3-1a | 18.76 | 5.321 | 4.18 | 39.02 | 0.29 | *** | *** | 30.95 | 69.58 | 0.51 |
| El-3-1b | 4.32 | 1.711 | 1.41 | 51.53 | 0.23 | *** | *** | 40.29 | 91.89 | 0.48 |
| El-4-02 | 1.09 | 0.481 | 0.43 | 54.63 | 0.13 | *** | 0.13 | 42.34 | 97.41 | 0.27 |
| El-4-5 | 2.12 | 0.621 | 1.17 | 53.21 | 0.12 | *** | *** | 41.81 | 94.88 | 0.25 |
| El-4-6 | 2.66 | 0.34 | 1.601 | 52.63 | 0.02 | *** | 41.79 | 93.86 | ||
| El-4-7 | 4.99 | 2.91 7 7 | 50.63 | *** | 0.01 | 40.47 | 90.28 | |||
| El-4-8 | 3.87 | 2.621 7 | 51.64 | *** | 0.10 | 40.70 | 92.08 | |||
| Ha-2-63 | 2.48 | 1.371 7 | 53.56 | 0.43 | *** | *** | 41.73 | 95.51 | 0.90 | |
| Ha-2-73 | 2.28 | 1.101 7 | 54.00 | 0.32 | *** | *** | 42.04 | 96.29 | 0.67 | |
| Jw-1-1 | 5.14 | 2.14 | 2.721 | 49.36 | 0.32 | tr | 0.22 | 38.65 | 88.02 | 0.67 |
| Jw-1-4a | 1.73 | 0.74 | 1.201 | 53.23 | 0.65 | tr | 0.23 | 41.38 | 94.92 | 1.36 |
| Jw-1-6 | 1.51 | 0.75 | 0.551 | 54.54 | 0.20 | *** | 0.01 | 41.56 | 97.25 | 0.42 |
| Jw-1-9 | 3.63 | 1.28 | 1.341 | 52.73 | 0.26 | *** | tr | 40.64 | 94.03 | 0.47 |
| Jw-1-10 | 4.62 | 1.00 | 2.511 | 51.65 | 0.06 | *** | 0.01 | 39.64 | 92.10 | 0.13 |
| Jw-2-1a | 18.84 | 6.481 7 | 40.61 | *** | 0.01 | 31.92 | 72.41 | |||
| Jw-2-1b | 3.70 | 3.601 7 | 51.45 | *** | *** | 40.48 | 91.74 | |||
| Jw-3-1a | 25.04 | 6.481 | 2.05 | 38.00 | 1.40 | *** | *** | 28.53 | 67.76 | |
| Jw-3-1a | 3.35 | 1.441 | 1.12 | 51.52 | *** | 0.04 | *** | 40.26 | 91.87 | |
| Sm-1-1a | 47.95 | 6.53 | 2.601 | 22.73 | 0.62 | *** | *** | 16.87 | 40.53 | 1.30 |
| Ns-1-23 | 2.90 | 1.50 | 0.701 | 51.21 | 1.47 | *** | *** | 41.85 | 91.32 | 3.08 |
| Ns-1-33 | 3.25 | 1.52 | 0.561 | 52.17 | 0.74 | *** | *** | 41.69 | 93.03 | 1.55 |
| Ln-1-1a | 5.27 | 0.67 | 1.541 | 51.01 | 0.30 | 0.14 | *** | 40.02 | 90.96 | 0.63 |
| Ln-1-1b | 3.55 | 0.97 | 1.821 | 51.78 | 0.11 | 0.13 | *** | 41.11 | 92.33 | 0.23 |
| Fn-1-01 3 | 3.48 | 0.92 | 0.431 | 52.34 | 0.07 | *** | 41.07 | 93.99 | ||
| Fn-1-13 4 | 3.38 | 1.17 | 0.511 | 53.31 | 0.34 | *** | *** | 41.76 | 95.06 | 0.71 |
| Fn-0-03 5 | 1.41 | 1.681 | 0.40 | 54.27 | 42.43 | 96.77 | ||||
| Ha-1-1a | 20.18 | 6.571 | 2.05 | 38.93 | 1.16 | *** | *** | 31.85 | 69.42 | 2.43 |
| Ha-1-1b | 6.47 | 2.311 | 0.78 | 50.81 | 0.95 | *** | *** | 39.13 | 90.60 | 1.99 |
| Ob-3-1a | 50.54 | 7.661 | 6.02 | 18.13 | 0.22 | tr | *** | 14.35 | 32.33 | 0.46 |
| Ob-3-1b | 4.63 | 2.321 | 1.87 | 50.74 | 0.25 | tr | *** | 40.06 | 90.48 | 0.52 |
| Ob-4-7 | 1.00 | 0.491 | 0.79 | 54.26 | 0.22 | tr | *** | 42.67 | 96.75 | 0.46 |
| Ob-4-10 | 4.38 | 1.401 | 1.03 | 51.92 | 0.16 | *** | *** | 40.95 | 92.58 | 0.33 |
| Ro-3-A4 | 1.52 | 1.031 | 0.94 | 54.00 | 0.23 | *** | *** | 42.11 | 96.29 | 0.48 |
| Ro-3-1a | 16.71 | 4.641 | 1.60 | 41.84 | Lost | 0.10 | *** | 32.95 | 74.61 | |
| Ro-3-6 | 1.93 | 1.271 | 1.79 | 52.61 | 0.40 | *** | *** | 42.02 | 93.81 | 0.84 |
| Ro-3-11 | 2.13 | 0.791 | 1.03 | 53.41 | 0.13 | *** | *** | 41.55 | 95.24 | 0.27 |
| Ro-3-22 | 1.70 | 3.121 | 2.57 | 52.51 | 0.26 | *** | *** | 40.74 | 93.63 | 0.54 |
| Ro-3-26 | 4.08 | 2.881 | 1.21 | 51.07 | Lost | 0.07 | *** | 40.15 | 91.07 | |
| Ro-4-A1a | 46.36 | 4.80 | 3.171 | 23.45 | 0.45 | 0.56 | *** | 19.03 | 41.82 | 0.94 |
| Ro-1-1 | 3.14 | 1.781 | 51.85 | 0.68 | tr | *** | 41.64 | 92.46 | 1.42 | |
| Ro-1-2w | 2.53 | 1.76 | 1.321 | 50.98 | 0.07 | 0.10 | 0.10 | 41.24 | 90.87 | 1.41 |
| Ro-1-4w | 2.15 | 0.67 | 1.351 | 52.16 | 0.58 | 0.06 | tr | 41.89 | 93.02 | 1.21 |
| Ro-1-5w | 2.97 | 0.72 | 1.731 | 51.37 | 0.82 | 0.10 | tr | 41.46 | 91.60 | 1.72 |
| Ro-1-6w | 4.00 | 0.75 | 2.331 | 50.45 | 0.81 | 0.16 | 0.02 | 40.65 | 89.96 | 1.71 |
| Ro-4-a1b | 4.32 | 0.42 | 3.641 | 50.15 | 0.13 | 0.09 | *** | 39.39 | 89.43 | 0.27 |
| Tr-1-11 | 2.84 | 2.321 | 0.76 | 2.23 | *** | *** | 41.28 | |||
| Tr-1-15 | 1.66 | 0.291 | 0.64 | 53.45 | 0.19 | *** | tr | 41.61 | 95.31 | 0.40 |
| Tr-2-1 | 2.82 | 1.411 | 52.91 | 0.49 | *** | *** | 41.48 | 94.35 | 0.87 | |
| Sm-1-1b | 3.37 | 1.74 | 1.771 | 51.88 | 0.79 | *** | *** | 40.87 | 92.51 | 1.65 |
| Sm-1-2 | 1.68 | 0.82 | 1.141 | 53.25 | 0.03 | *** | *** | 42.49 | 94.95 | 0.06 |
| Sm-1-6 | 1.02 | 0.49 | 0.481 | 53.91 | 0.25 | *** | *** | 42.91 | 96.13 | 0.52 |
| Sm-1-9 | 1.38 | 0.57 | 1.091 | 53.58 | 0.30 | *** | *** | 42.62 | 95.54 | 0.62 |
| Sm-1-12 | 1.58 | 1.05 | 0.851 | 52.02 | 1.29 | *** | *** | 42.22 | 92.76 | 2.70 |
| Sm-1-13 | 1.78 | 0.63 | 0.651 | 54.62 | 0.10 | tr | tr | 41.30 | 97.39 | 0.21 |
| Sm-2-1a | 56.01 | 3.66 | 1.501 | 16.10 | 2.73 | tr | *** | 13.29 | 28.71 | 5.71 |
| Sm-2-1b | 4.10 | 1.71 | 0.661 | 50.39 | 2.63 | tr | *** | 40.52 | 89.85 | 5.50 |
| Sm-2-4 | 5.84 | 1.74 | 0.651 | 49.75 | 1.38 | tr | *** | 39.86 | 88.71 | 2.89 |
| Sm-2-9 | 2.51 | 0.64 | 0.531 | 52.65 | 1.05 | tr | *** | 41.75 | 93.38 | 2.20 |
| Sm-2-14 | 1.09 | 0.50 | 0.101 | 55.01 | 1.08 | tr | *** | 42.96 | 98.09 | 2.26 |
| Sm-2-15 | 2.43 | 1.20 | 0.461 | 53.64 | 1.11 | tr | *** | 42.01 | 95.65 | 2.32 |
| Ph-1-1a | 14.27 | 3.481 | 2.37 | 43.97 | 0.26 | *** | *** | 35.15 | 78.41 | 0.54 |
| Ph-1-1b | 3.05 | 0.851 | 1.80 | 52.60 | 0.36 | *** | *** | 41.08 | 93.79 | 0.75 |
| Ob-1-23 | 2.47 | 2.267 1 | 53.34 | 0.32 | *** | *** | 41.56 | 95.11 | 0.67 | |
| Ob-1-3 | 3.14 | 1.911 | 52.73 | 0.18 | *** | *** | 41.46 | 94.03 | 0.38 | |
| Ob-1-4 | 3.43 | 3.921 | 51.67 | 0.40 | *** | *** | 40.78 | 92.14 | 0.84 | |
| Ob-1-5 | 0.93 | 0.961 | 54.63 | 0.30 | *** | *** | 42.73 | 97.41 | 0.63 | |
| Ob-2-1a | 6.55 | 2.29 | 2.941 | 48.13 | 0.12 | *** | *** | 37.63 | 85.82 | 0.25 |
| Ob-2-1b | 2.53 | 0.83 | 1.901 | 52.59 | 0.14 | *** | *** | 40.72 | 93.78 | 0.29 |
| Sm-1-1aI10 | 90.20 | 3.76 | 1.87 | 0.45 | 0.40 | 0.46 | ||||
| Jw-2-1a11 | 87.68 | 4.06 | 1.16 | 0.30 | 0.39 | 0.60 | ||||
| Ro-4-A1aIl2 | 90.40 | 2.38 | 1.98 | 0.42 | 0.29 | 0.61 | ||||
| Ha-1-1a13 3 | 85.92 | 5.09 | 0.62 | 0.30 | 0.32 | 0.72 | ||||
| J-3-ss6 14 | 76.01 | 12.35 | 3.83 | 1.35 | 2.16 | 0.08 | 2.57 | |||
| Os-3-ss6 15 | 72.70 | 12.56 | 4.22 | 1.87 | 2.23 | 0.08 | 2.77 | |||
| 1 Includes TiO2. 2 Composite samples of beds 3 and 4. 3 Above lowest visible bed: Lower Fort Hays contact not seen. 4 Spot samples from upper part of quarry. 5 Composite of quarry analyzed by R. Thompson in 1943. 6 Codell sandstone. 7 And Fe2O3. 8 Complete location given in Table 1. 10 TiO2, 0.67; K2O, 1.91; Na2O, 0.58; determined by difference from 100 percent. 11 TiO2, 1.02; K2O, 2.73; Na2O, 2.06; determined by difference from 100 percent. 12 TiO2, 0.87; K2O, 3.05; Na2O, Nil; determined by difference from 100 percent. 13 TiO2, 2.79; K2O, 0.93; Na2O, 3.79; determined by difference from 100 percent. 14 TiO2, 1.02; SO3, 0.04. 15 TiO2, 1:55; SO3, 0.04. *** nil. |
||||||||||
In summary, the following general statements can be made. (1) The central to north-central parts of the area studied have greater thicknesses of purer chalk. (2) The content of other constituents (SiO2, R2O3, and MgO) generally is inversely proportional to the calcium carbonate content. (3) The decreasing calcium carbonate content at the top of the Fort Hays member might represent a qualitative method of identifying the transition between the Fort Hays and the Smoky Hill members of the Niobrara formation, although only a very limited number of analyses of the upper parts of the Fort Hays have been made.
Correlation Between Petrographic and Chemical Analyses
Chemical analyses show that the amount of insoluble residue is largest at the base of the Fort Hays. Petrographic analyses show that the purest chalk generally lies between the "d" and "e" levels. The purest chalk bed is Sm-2-14 which contained 98.20 percent calcium carbonate.
In order to compare more closely the quantitative results of the petrographic and chemical analyses, the coarser parts of the insoluble residues of four of the most impure samples were analyzed. A routine chemical examination was made for SiO2, Al2O3, Fe2O3, TiO2, CaO, MgO, K2O, and Na2O. The calcium present was considered to be residual calcium salts not removed during separation of insoluble residues. The percentage of each mineral present in the coarse part was determined by counting the grains. The chemical oxide content was then calculated from the mineral content. Table 6 lists the oxide content determined by both chemical and petrographic analyses.
Table 6--Correlation of petrographic and chemical analyses of the coarser portion of insoluble residues. Chem.=chemical analysis; 2 Petr.=petrographic analysis.
| SiO2 | Al2O3 | TiO2 | K2O | Na2O | CaO | |||||||
|---|---|---|---|---|---|---|---|---|---|---|---|---|
| Chem. | Petr. | Chem. | Petr. | Chem. | Petr. | Chem. | Petr. | Chem. | Petr. | Chem. | Petr. | |
| Jw-2-1a | 87.68 | 85.68 | 4.06 | 6.07 | 1.02 | 0.54 | 2.73 | 3.04 | 2.06 | 1.59 | 0.30 | |
| Sm-1-1a | 90.20 | 93.17 | 3.76 | 2.88 | 0.67 | 0.19 | 1.91 | 2.30 | 0.58 | 0.44 | 0.15 | |
| Ro-4-A1a | 90.40 | 91.11 | 2.38 | 3.63 | 0.87 | 0.07 | 3.05 | 3.00 | 0.00 | 0.00 | 0.42 | |
| Ha-1-1a | 85.92 | 84.90 | 5.09 | 8.08 | 2.79 | 0.00 | 0.93 | 1.41 | 3.79 | 3.73 | 0.30 | |
The silica content determined petrographically and chemically agrees closely. The amount of alumina is generally higher in the petrographic analyses. The amount of TiO2 is consistently higher in the chemical analyses. The amount of K2O is slightly higher on the average in the petrographic analyses, whereas the amount of Na2O is slightly higher on the average in the chemical analyses.
A possible cause for the larger amount of TiO2 determined chemically is that some of the ilmenite may have been called magnetite in the petrographic analysis.
An explanation which can be offered for the larger amount of alumina in the petrographic analyses is the assumption that the determination of the feldspars was too high. However, the fact that the K2O is only slightly higher and the Na2O slightly lower in the petrographic analyses casts doubt on the above assumption.
In general, however, there is good agreement between the chemical compositions determined by both methods of analyses.
Prev Page--Stratigraphy || Next Page--Utilization
Kansas Geological Survey, Geology
Placed on web Oct. 6, 2008; originally published Feb. 1949.
Comments to webadmin@kgs.ku.edu
The URL for this page is http://www.kgs.ku.edu/Publications/Bulletins/82_1/04_analy.html