Previous--Salt-dissolution Subsidence Feature in Stafford County, Kansas || Next--Northwestern Franklin, Southeastern Douglas, and Osage Counties in Kansas
1Geophex, Ltd., 2International Institute for Aerospace Surveys and Earth Sciences, 3Department of Geology and Geophysics, University of Missouri-Rolla, and 4Kansas Geological Survey
This article available as an Acrobat PDF file (6 Mb).
The Cheyenne Bottoms basin is an elliptical, natural land-sink feature totaling approximately 16,600 ha (41,000 acres). The basin is bounded on the north, south, and west by 35-m (115-ft)-high Cretaceous limestone and sandstone bluffs and on the east and southeast by Pleistocene sand dunes and alluvium. Cheyenne Bottoms is considered the most important ecosystem in Kansas and is one of the most important migration points for shorebirds in North America.
The origin of Cheyenne Bottoms is disputed. Understanding the subsurface structure and potential salt-related mechanisms responsible for the wetlands may help identify tectonic controls important for shallow oil/gas pools. A single, high-resolution CDP line was acquired at Cheyenne Bottoms to test the feasibility of using the seismic-reflection technique to resolve subsurface structures.
Seismic data and geologic well control suggest that the Cheyenne Bottoms area is a natural land-sink, the result of faulting, salt dissolution, and rock-salt creep. The authors' preferred interpretation is that regional faulting during the Pleistocene allowed for the vertical circulation of ground waters, thereby initiating the dissolution of the Hutchinson Salt Member. Salt dissolution, as envisioned, would have been most extensive in the immediate vicinity of the faults. In those areas peripheral to the sites of extensive leaching, rock-salt creep probably occurred. This process entails the creep of rock salt from zones of high pressure (no significant leaching) towards zones of lower pressure (sites of active dissolution or void space).
As a consequence of faulting, the pre-Hutchinson Salt horizons are structurally low in the Cheyenne Bottoms area. As a result of faulting, salt dissolution, and rock-salt creep, the top of the Hutchinson Salt Member and the post-Hutchinson Salt horizons (including the present surface) are also structurally low.
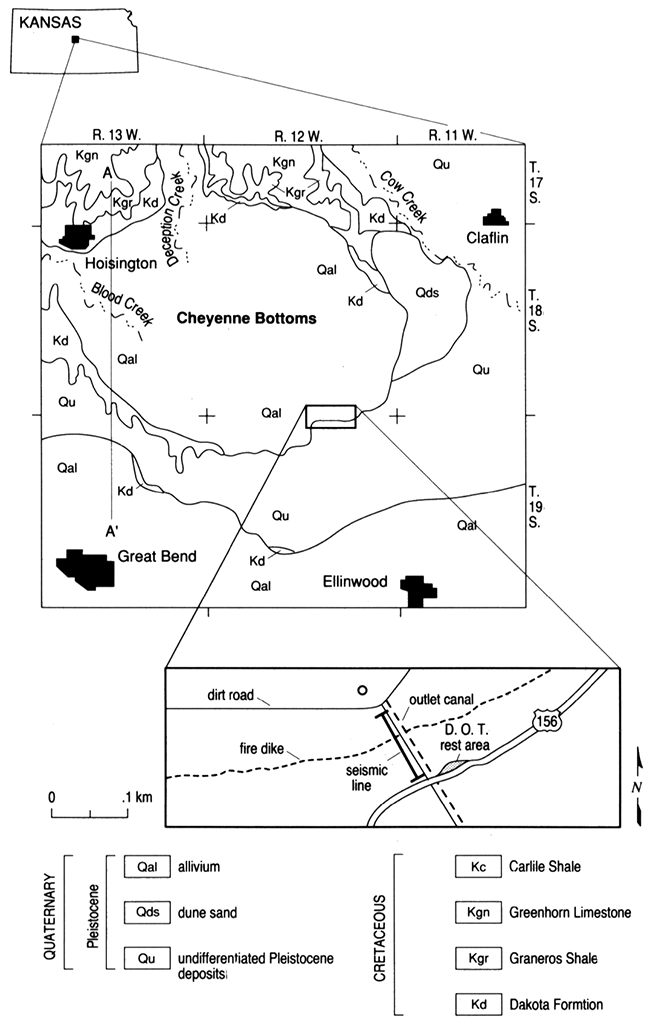
Cheyenne Bottoms, located in east-central Barton County, Kansas, is an elliptical, natural land-sink feature (fig. 1) totaling approximately 16,600 ha (41,000 acres). The basin is bounded on the north, south, and west by 35-m (115-ft)-high Cretaceous limestone and sandstone bluffs and on the east and southeast by Pleistocene sand dunes and alluvium (fig. 1). Within this basin, a 7,690-ha (19,000-acre) wetlands lies along the southeastern edge of the sink. The Kansas Department of Wildlife and Parks has maintained the marsh region since 1950, when a system of canals was constructed to divert surface drainage into five pools. Due in part to the rapidly declining marsh regions in the United States, Cheyenne Bottoms is the most important ecosystem in Kansas and among the most important migration points for shorebirds in North America (Wentz, 1990). Water depth in the pools fluctuates with the seasons but seldom exceeds 0.6 m (2 ft).
Figure 1--Surface geology of the Cheyenne Bottoms area (modified from Latta, 1950).
The origin of the Cheyenne Bottoms basin has been attributed to structural movement (Bayne, 1977) and salt dissolution/subsidence (Johnson, 1901; Bass, 1926; Latta, 1950). The seismic data incorporated into this paper were collected in an effort to verify the presence (or absence) of faults and associated salt-dissolution features.
Unconsolidated Pleistocene and Holocene alluvial sediments are anomalously thick in the Cheyenne Bottoms basin. In the immediate vicinity of the seismic line, the thickness of these strata are on the order of 35 m (115 ft). The Pleistocene sediments were deposited within the paleo-Chase Channel system (Bayne and Fent, 1963); the Holocene strata are Blood Creek and Deception Creek sediment.
Although deposition of the Ogallala Formation occurred in the Cheyenne Bottoms area during the Tertiary, erosional processes dominated, and no remnant Tertiary rock is preserved. The erosional activities during the Tertiary and regional faulting and associated salt dissolution processes have largely shaped the current bedrock topography.
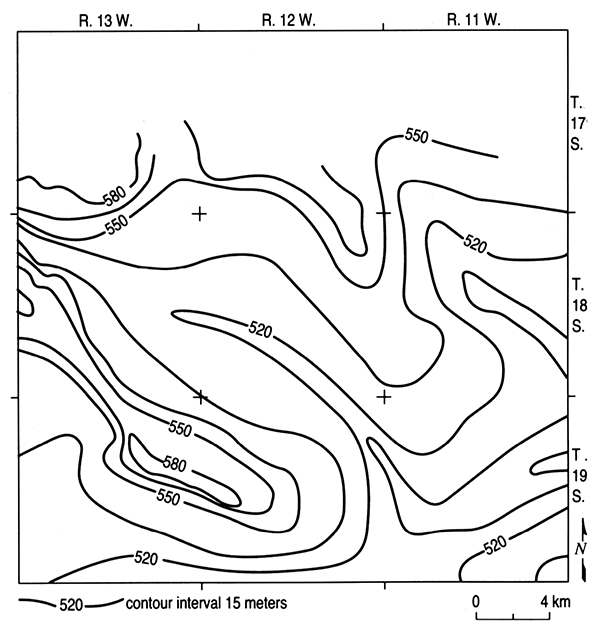
The Cretaceous Graneros Shale and Dakota Sandstone underlie Tertiary strata within Cheyenne Bottoms and crop out elsewhere, effectively rimming the basin (fig. 2). The contour map of the bedrock surface (fig. 3) shows a well-defined erosional channel, the course of which is thought to have been influenced by contemporaneous faulting and salt-related subsidence. The bedrock channel slopes to the southeast at about 1.2 m/km (2.4 ft/mi). Basin walls rise approximately 45 m (148 ft) to the south, west, and north.
Figure 2--Geologic cross section (Latta, 1950), location of cross section is indicated on fig. 1.
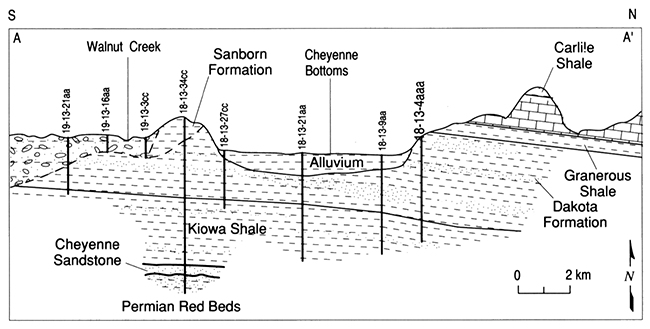
Figure 3--Contour map of the bedrock surface (data from Latta, 1950; contoured by Bayne, 1977).
Pre-Mesozoic units are represented in the Cheyenne Bottoms area by a sequence of alternating marine limestone, shale, and sandstone (Zeller, 1968; Bayne, 1977; Merriam, 1968). Key strata from a geophysical perspective are the Permian-age Stone Corral Formation of the Sumner Group and the Hutchinson Salt Member of the Wellington Formation. In the Cheyenne Bottoms area, the Stone Corral Formation is composed of dolomite and anhydrite. The Hutchinson Salt Member is composed principally of halite with minor interbeds of anhydrite, dolomite, and shale.
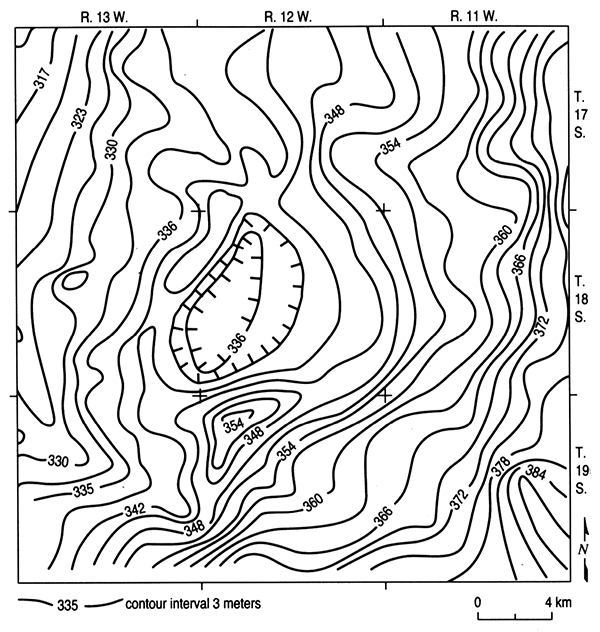
The Stone Corral Formation dips regionally towards the northwest. Within the study area, however, the top of this unit is anomalously (up to 6 m; 20 ft) structurally low relative to the regional trend and defines a basin, the areal extent of which is consistent with the surface area of the Cheyenne Bottoms basin (figs. 4 and 1). The structural low at the Stone Corral level rises abruptly to the northwest where a local anticlinal fold is present. A domelike high is located to the south of the basin in the northwest corner of T. 19 S., R. 12 W.
Figure 4--Contour map of the top of the Stone Corral Formation (Bayne, 1977).
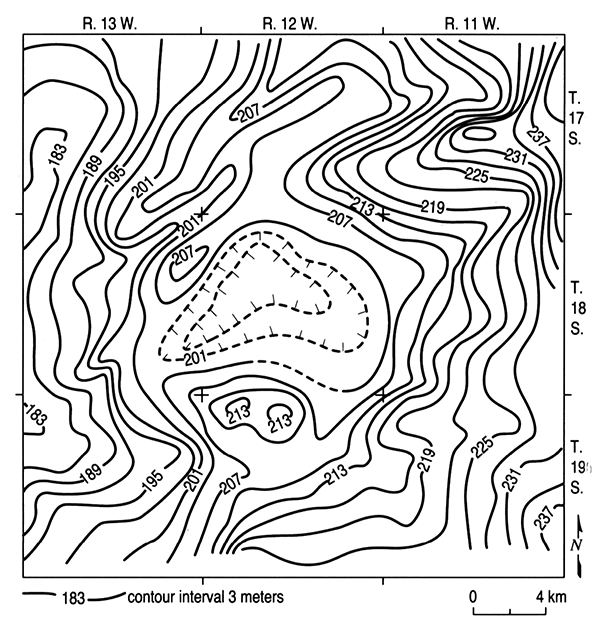
Similar structural features are observed at the top of the Hutchinson Salt Member (fig. 5). The top of this unit is as much as 9 m (30 ft) structurally low, relative to its regional trend, and is bound to the northwest by a localized high. The domelike high to the south of the basin is similarly distinct on the Hutchinson Salt structure map (fig. 5). Bayne (1977) noted that borehole information to the top of the Hutchinson Salt Member within the Cheyenne Bottoms area is sparse and that additional data could potentially change the extent and shape of the basin feature.
Figure 5--Contour map of the top of the Hutchinson Salt Member (Bayne, 1977).
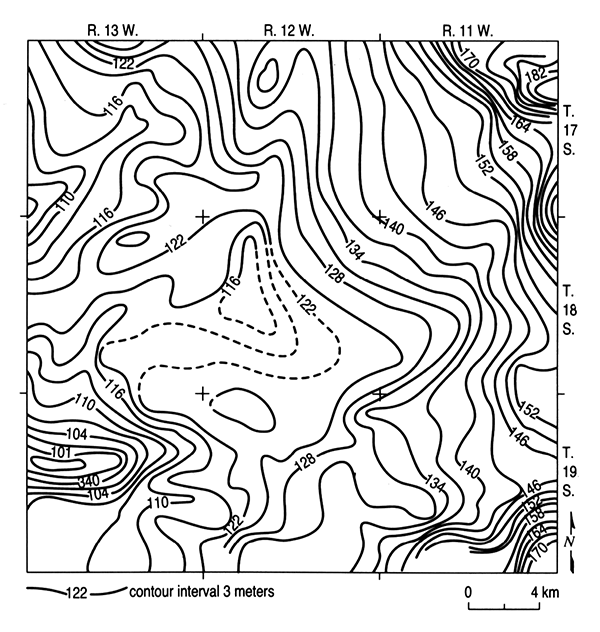
Structure at the base of the Hutchinson Salt Member (fig. 6) is similar but of lesser magnitude than that at the tops of the Hutchinson Salt and Stone Corral. The domelike high to the south of the Cheyenne Bottoms basin is still present but reduced in relief. The bounding structure to the west of the basin is present but is larger and shifted to the west.
Figure 6--Contour map of the base of the Hutchinson Salt Member (Bayne, 1977).
The patterns of structural relief observed at the top of the Stone Corral and at the top and base of the Hutchinson Member are consistent with the thesis that the Cheyenne Bottoms basin is partially the result of faulting and salt-related subsidence.
In an effort to elucidate the geologic origin of the Cheyenne Bottoms basin, seismic data were acquired adjacent to the edge of the marsh along an outlet canal (fig. 1; sec. 34, T. 18 S., R. 12 W.). The location of the CDP line was chosen based on proximity to well data (geologic control), accessibility to field vehicles, and quiet environmental conditions. The saturated, alluvial media provided excellent geophone-near surface coupling. Routine acquisition procedures such as consistent firing procedures; deeply rooted, vertical geophone plants; and manicuring the source and geophone locations to remove surface vegetation maximized recorded frequency response and helped attenuate unwanted source-generated noise.
An Input/Output 2400 DHR seismograph was used to analog filter, amplify, A/D convert (11 bits plus sign), and record the seismic data. These data were displayed on paper plots during acquisition and stored on magnetic media in a modified SEG- Y format. The selected sample interval was 0.5 msec and record length was 500 msec. Analog low-cut filters with a 24 dB/octave roll off and a -3 dB point of 220 Hz were used; the severe analog low-cut filters improved the resolution, decreased the effects of ground roll, and allowed the depth interval of interest to be imaged. The receiver array consisted of 3-40 Hz Mark Product L-28E geophones (with a damping factor of 0.7), wired in series, evenly spaced over 0.6 m (2 ft), and centered on 1.2 m (4 ft) stations. The geophone array was designed to enhance signal levels and attenuate source-generated noise. The fixed gain amplification, 72-dB instantaneous dynamic range, and 24-channel recording capabilities make the DHR 2400 competitive for target-oriented studies.
A series of walkaway-noise tests were conducted to optimize acquisition parameters (fig. 7 A, B). Source to receiver offsets ranged from 2 m to 246 m (6.6 ft to 807 ft), with three-geophone arrays centered on 1.2-m (4-ft) group spacings. Placement of the source in a 1-m (3.3-ft) hole to avoid wave attenuation by the weathered layer was possible due to the water-saturated, alluvial, near-surface media. The broad band characteristics and high energy output of the downhole .50-caliber rifle (Steeples et al., 1987) made it the source of choice at this site.
Figure 7A--Walkaway-noise spread acquired with the 110-hz low-cut filters.
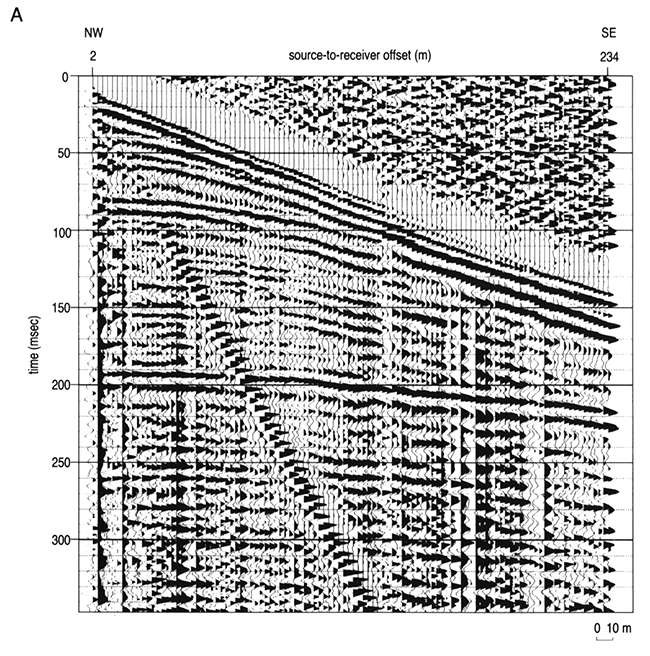
Figure 7B--Walkaway-noise spread acquired with the 220-hz low-cut filters. Source-to-near offset is 2 m (6.6 ft) for both the walkaways; trace spacing is 2 m (6.6 ft).
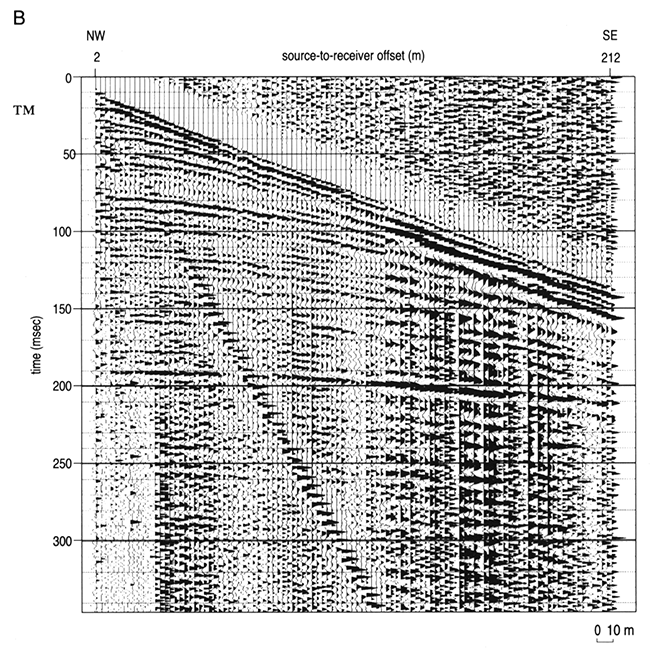
Figure 7C--Comparison of frequency vs. amplitude spectra for data acquired with different low-cut filters (110 vs. 220 Hz as shown).
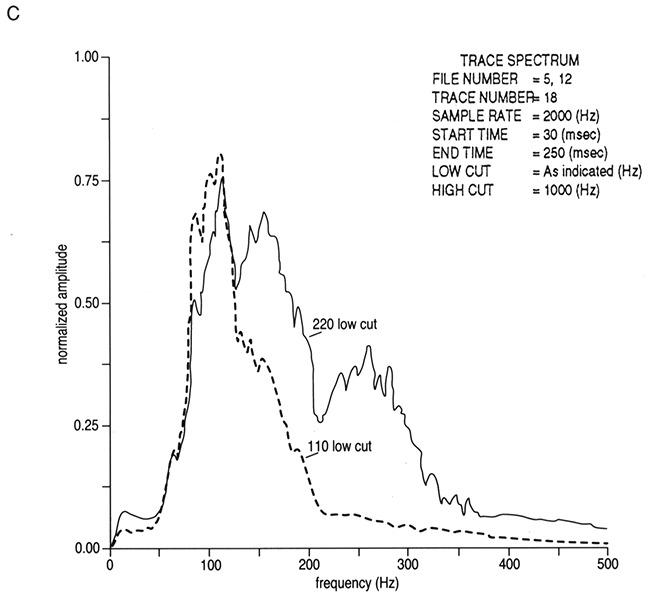
Analog low-cut filters shape the recorded spectrum, resulting in data with a higher dominant frequency and broader bandwidth than data recorded with no low-cut filters (Steeples, 1990). Increasing the dominant frequency and broadening the frequency spectrum of reflection energy improves resolution (Widess, 1973). During testing procedures, open (no low-cut filter), 110-Hz (fig. 7 A, C), 220-Hz (fig. 7B, C), and 340-Hz low-cut filters were tested. As the low-cut filter is increased, noticeable increases in dominant frequency are observed (figs. 7 A-C) The 220-Hz low-cut filters were selected for production acquisition based on an in-field analysis of shot records. Subsequent processing and display indicate that a low-cut filter with a lower corner frequency may allow the Paleozoic sequence to be better imaged.
The survey produced excellent data; on several of the noise spreads (figs. 7 A, B), hyperbolic reflection events can be identified as early as 20 msec; others can be observed between 30 and 200 msec, with several less defined reflections, between 200 and 300 msec.
The Cheyenne Bottoms data were processed on an Intel 80386-based microcomputer using Eavesdropper (a seismic-data-processing package developed and marketed by the Kansas Geological Survey). The processing flow is displayed in table 1. Special care was taken during trace editing, surgical muting, and velocity analysis. Deconvolution and migration processes were not applied. No corrections for elevation were made due to the relatively flat topography along the seismic line. During the processing flow, each step was visually inspected in an effort to ensure that processing artifacts were not introduced.
Table 1--Generalized processing sequence used to generate the CDP stack.
|
Raw data ↓ Conversion to SEG-Y format ↓ Bad trace editing ↓ Surgical muting of first arrivals and air-wave energy ↓ Frequency filter ↓ CDP sorting ↓ Velocity analysis ↓ NMO correction ↓ Automatic static corrections to apply surface-consistent statics ↓ Residual static corrections ↓ CDP stack ↓ Trace balancing |
Velocity analysis is critical during high-resolution seismic-data processing. Inaccurate stacking velocities will effectively lower the frequency content of the stacked section and result in unreliable time-to-depth conversions. Due to the highly variable weathered layer, stacking velocities varied considerably both laterally as well as vertically. After visual inspection of velocity panels, the velocity function shown in table 2 was selected.
Table 2--Velocity functions as a function of location and time. The velocity value is the average velocity from the surface to the specific time.
| Station 210 | Station 220 | Station 235 | Station 250 | |||||||
|---|---|---|---|---|---|---|---|---|---|---|
| Time (msec) |
Velocity (m/sec) |
Time (msec) |
Velocity (m/sec) |
Time (msec) |
Velocity (m/sec) |
Time (msec) |
Velocity (m/sec) |
|||
| 30 | 1200 | 30 | 1200 | 30 | 1200 | 30 | 1200 | |||
| 40 | 1375 | 40 | 1350 | 40 | 1350 | 40 | 1300 | |||
| 55 | 1600 | 55 | 1475 | 55 | 1450 | 60 | 1400 | |||
| 80 | 1700 | 80 | 1700 | 85 | 1700 | 80 | 1600 | |||
| 130 | 1750 | 130 | 1700 | 100 | 1800 | 120 | 1700 | |||
| 150 | 1800 | 155 | 2100 | 130 | 1800 | 155 | 1700 | |||
| 190 | 2300 | 185 | 2500 | 155 | 1900 | 185 | 2000 | |||
| 300 | 3000 | 300 | 3000 | 185 | 2000 | 300 | 3000 | |||
| 300 | 3000 | |||||||||
| Station 265 | Station 272 | Station 280 | Station 290 | |||||||
| Time (msec) |
Velocity (m/sec) |
Time (msec) |
Velocity (m/sec) |
Time (msec) |
Velocity (m/sec) |
Time (msec) |
Velocity (m/sec) |
|||
| 30 | 1250 | 30 | 1250 | 30 | 1275 | 30 | 1200 | |||
| 40 | 1300 | 40 | 1350 | 40 | 1500 | 40 | 1350 | |||
| 55 | 1400 | 55 | 1500 | 50 | 1400 | 50 | 1450 | |||
| 80 | 1600 | 80 | 1700 | 75 | 1500 | 75 | 1600 | |||
| 120 | 1600 | 125 | 1700 | 110 | 1600 | 130 | 1600 | |||
| 155 | 1900 | 150 | 1900 | 120 | 1800 | 140 | 1800 | |||
| 185 | 2000 | 185 | 2100 | 150 | 2000 | 190 | 2300 | |||
| 300 | 3000 | 300 | 3000 | 185 | 2100 | 300 | 3000 | |||
| 300 | 3000 | |||||||||
Spectral analysis techniques were used to define appropriate digital filters. Digital frequency filters are often critical in verifying reflection events. These data are of sufficient quality that digital filtering simply enhanced shallow events while enabling deeper events to be resolved. After the spectral analysis, a band pass filter of 75 to 250 Hz was applied to the final stack (corner frequencies 35, 75, 250, 400 Hz). The ground-roll energy was sufficiently reduced during the digital filtering and stacking processes such that no other procedures (such as surgical muting) were required.
In fig. 8 a one-dimensional synthetic seismogram for a well near the Cheyenne Bottoms area (sec. 28, T. 19 S., R. 11 W.) is presented. This seismogram was generated by convolving an edited version (the pseudo-density log was modified as per figure caption) of the reflection coefficient wavetrain (250-1,570-ft interval; 76.2-479-m interval) with zero-phase, 5-msec wavelength Ricker wavelets of both normal and reverse polarity. The synthetic seismogram is presented as a reasonable representation of high-resolution (156 Hz) CDP-stacked seismic data. As is illustrated in fig. 8, the normal- and reverse-polarity displays are mirror images; troughs on the normal-polarity seismogram correlate to peaks on the reverse-polarity display. Definitions for these terms may be found in Anderson et al. (1992a) and Sheriff (1991).
Figure 8--Modeling from borehole information.
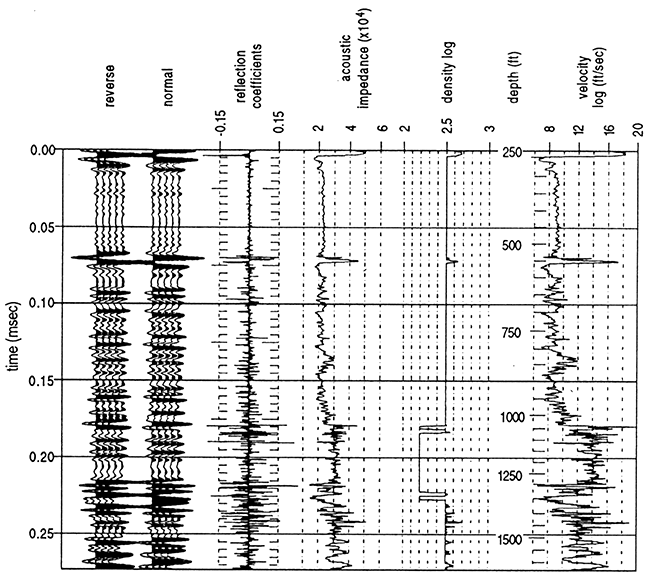
The top and base of the Hutchinson Salt Member on the normal-polarity synthetic seismogram (fig. 8) are represented by moderate-amplitude peaks. The Hutchinson Salt Member, between the top and base, is characterized by a series of relatively low- to moderate-amplitude events, the product of interlayered halites, sulfates, shales, and carbonates of variable acoustic impedance and thickness. Overall, the synthetic seismogram suggests that the seismic image of undeformed Hutchinson Salt Member can be readily discriminated on high-resolution seismic data. It should be noted that high-resolution sources have limited depth penetration and that high-frequency input signal is rapidly attenuated with depth. As a result, the vertical resolution at depth (as suggested by the synthetic seismogram) might not be realized using current high-resolution seismic techniques.
As evidenced by this synthetic seismogram, from a reflection-seismic perspective, rock salt is a bit of an enigma; although halite has a relatively high seismic velocity (4,200 m/sec), it has a low density (2,200 kg/m3). (Typically, dense rocks have relatively high seismic velocities, and less dense rocks have lower seismic velocities.) The top of the rock salt in particular can be difficult to image; the Hutchinson Salt Member is overlain by denser shales of lower seismic velocity. Note that the synthetic seismic image of the Hutchinson Salt Member would be very different if only the velocity curve was used to calculate the reflection coefficient wavetrain.
As illustrated on the synthetic seismogram, the reflections from the top and base of the Stone Corral are manifested as a high-amplitude peak and high-amplitude trough, respectively. The seismic signature of the Blaine Formation (thin anhydrite, the top of which is not represented on the synthetic seismogram) is similarly characterized by a high-amplitude peak-trough combination.
Sonic log control was not acquired above the Blaine Formation. As a result the base Pleistocene and the base Cretaceous are not imaged on the synthetic seismogram. Our experience elsewhere in central Kansas and the geologic/lithologic control in the study area suggests that these interfaces will be manifested as moderate- to high-amplitude peaks on zero-phase, normal-polarity seismic data. As a result of erosion, these seismic events also can exhibit significant lateral time-structural relief relative to the adjacent conformably bedded strata.
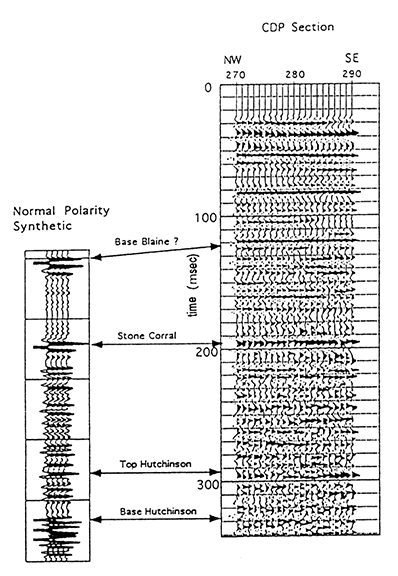
Correlation of the synthetic seismic data with the normal-polarity CDP stacked seismic data is quite good (fig. 9). Well-log information, stacking velocity control, and the synthetic seismogram have enabled confident identifications of several key reflections.
Figure 9--Correlation of synthetic trace to seismic section. Borehole data are from a well approximately 10 km (6.2 mi) southeast of Cheyenne Bottoms.
The shallowest labeled event is the pre-Pleistocene subcrop (fig. 10A, B). This undulating surface is erosional and represents the contact between the largely unconsolidated Pleistocene fluvial sediment and the underlying Cretaceous strata. This event conforms to driller logs for a well (sec. 29, T. 18 S., R. 12 w.) where the Dakota Formation is marked by the presence of gray shales and coal chips at a depth of around 35 m (115 ft). This event and the overlying inter-Pleistocene reflections are relatively time-structurally low to the north of CDP 250 (1-3 msec). This pattern of relief is consistent with erosion and the post-depositional compaction of the Pleistocene infill, supporting Haworth's (1897) thesis that Cheyenne Bottoms is a product of the Pleistocene sedimentary processes. Alternatively, the observed time-structural low could have been accentuated by either late-stage faulting, salt dissolution, and/or salt creep.
Figure 10--CDP stacked section of the seismic data (A) and interpretations (B) and (C).
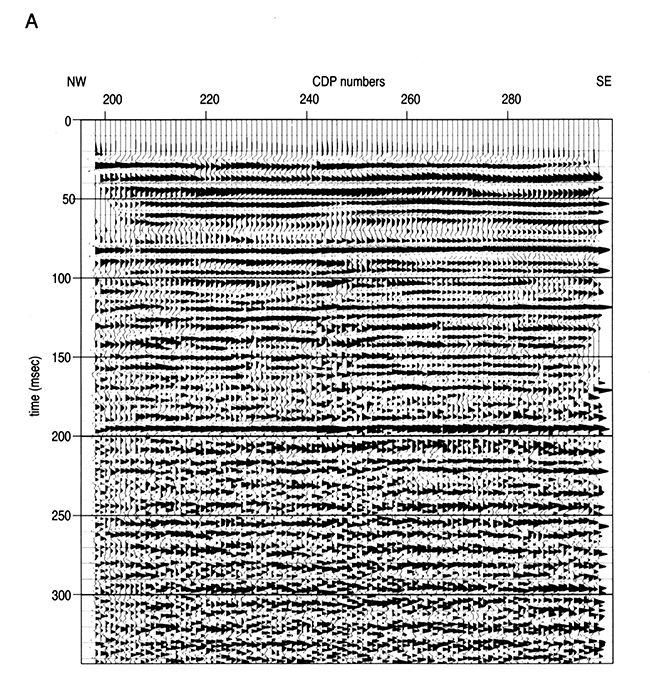
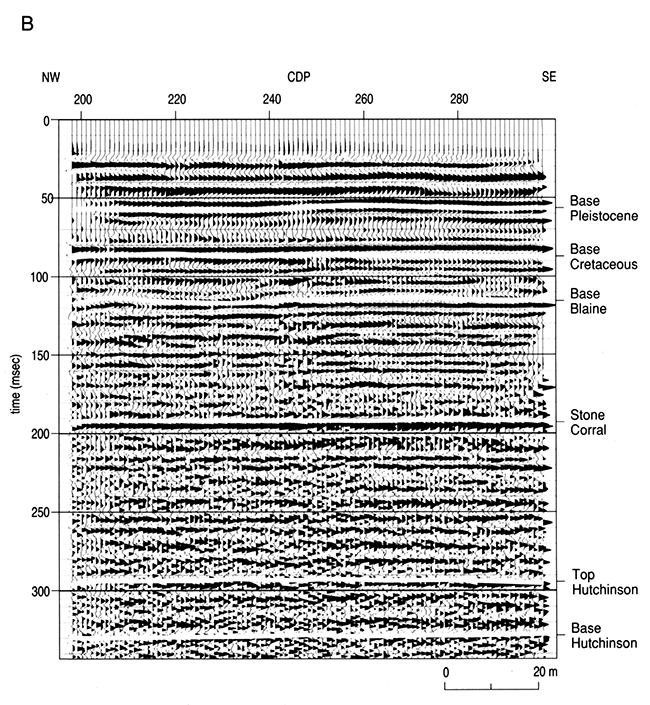
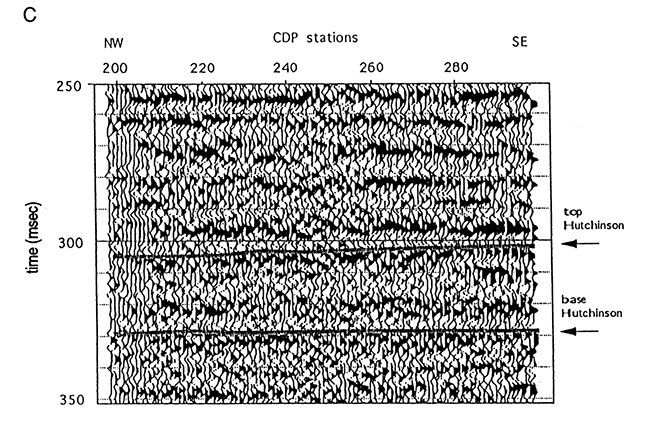
The base Cretaceous, base Blaine, top Stone Corral, and top Hutchinson Salt events are time-structurally low (1-2 msec) to the north of trace 250, supporting the thesis of late-stage faulting, dissolution, and/or creep. The base Hutchinson Salt event, in contrast, appears to be relatively flat (fig. 10C), suggesting that the time-structural relief observed along the shallower horizons is at least partially attributable to the recent thinning of the Hutchinson Salt.
On the basis of the seismic data, the preferred interpretation is that as a result of rock-salt creep, the Hutchinson Salt is several msec (5 m or so; 16 ft) thinner to the north of trace 250 than to the south. We submit that these salts are actually being leached to the north of the seismic line and that the observed thinning is the result of rock-salt creep towards the zone of active and/or recent dissolution.
From a regional perspective, we suggest that faulting during Pleistocene time initiated the dissolution of the Hutchinson Salt to the north of the seismic line. (As a consequence of this faulting, the pre-Hutchinson horizons are structurally low in the Cheyenne Bottoms area.) The leaching of Hutchinson Salt caused surface subsidence and influenced the regional drainage pattern to the extent that the Cheyenne Bottoms area was incised by deeply cutting stream channels. Erosional downcutting was accentuated by salt dissolution; hence, the base Pleistocene is anonymously low and the Pleistocene fill anonymously thick in the area. In those areas peripheral to the sites of extensive leaching, rock-salt creep occurred. This process, as envisioned by the authors, entails the creep of rock salt from zones of high pressure (no significant leaching) towards zones of lower pressure (sites of active dissolution or void space).
Seismic data (figs. 10A-C) were acquired near the southeastern periphery of the Cheyenne Bottoms area in an effort to elucidate the geologic origin of the basin. Our interpretation of these data suggests that the Hutchinson Salt Member thins along the length of the line (from southeast to northwest) by about 5 m (16 ft) as the result of rock-salt creep. We submit that these salts are actually being leached to the north of the seismic line and that the observed thinning is the result of rock-salt creep towards the zone of active and/or recent dissolution.
This interpretation is consistent with the generally accepted thesis that Cheyenne Bottoms is a natural land-sink, caused by regional faulting and the associated dissolution of the Hutchinson Salt. Our interpretation differs from these previously published concepts in that we provide seismic evidence that (at least in places) the Hutchinson Salt thins about the periphery of the Cheyenne Bottoms area. This thinning is herein attributed to rock-salt creep.
These high-quality seismic data suggest that a regional high-resolution seismic study could successfully image the Hutchinson Salt Member within Cheyenne Bottoms and better our understanding of the timing of tectonic activity responsible for the fracturing patterns observed. A study of this nature could potentially provide key information regarding the origin of Cheyenne Bottoms, salt dissolution and associated subsidence could be verified, and fault/fracture zones could be located. We anticipate acquiring additional seismic data with modern technology and techniques which would provide equal if not better resolution with very little (if any) environmental impact on the ecosystem.
The authors thank Karl Grover, Kansas Fish and Game Commission, for assistance during the planning stages, and Pat Acker for preparing the quality graphics.
Bass, N. W., 1926, Geological investigations in western Kansas: Kansas Geological Survey, Bulletin 11, 96 p. [available online]
Bayne, C. K., 1977, Geology and structure of Cheyenne Bottoms, Barton County, Kansas: Kansas Geological Survey, Bulletin 211, part 2, 12 p. [available online]
Bayne, C. K., and Fent, O. S., 1963, The drainage history of the upper Kansas River basin: Kansas Academy of Science, Transactions, v. 66, p. 363-377
Haworth, E., 1897, Physiography of western Kansas: Kansas University Geological Survey, v. 2, p. 11-49
Johnson, W. D., 1901, The high plains and their utilization: U.S. Geological Survey, 21st Annual Report, p. 601-741
Latta, B. F., 1950, Geology and ground-water resources of Barton County, Kansas: Kansas Geological Survey, Bulletin 88, 228 p. [available online]
Merriam, D. F., 1968, The geologic history of Kansas: Kansas Geological Survey, Bulletin 162, 317 p. [available online]
Sheriff, R. E., 1991, Encyclopedic dictionary of exploration geophysics: Society of Exploration Geophysicists, 376 p.
Steeples, D. W., Miller, R. D., and Knapp, R. W., 1987, Downhole .50-caliber rifle--an advance in high-resolution seismic sources (exp. abs.); in, Technical Program Abstracts and Biographies: Society of Exploration Geophysicists, 57th Annual Meeting, p. 76-78
Steeples, D. W., 1990, Early spectral shaping boosts data quality: Oil and Gas Journal Special, p. 49-55
Wentz, A. W., 1990, An introduction to Cheyenne Bottoms; in, Cheyenne Bottoms--Jewel of the Prairie: Kansas Department of Wildlife and Parks
Widess, M. B., 1973, How thin is a thin bed?: Geophysics, v. 38, p. 176-1,180
Zeller, D. E., 1968, The stratigraphic succession in Kansas: Kansas Geological Survey, Bulletin 189, 81 p. [available online]
Previous--Salt-dissolution Subsidence Feature in Stafford County, Kansas || Next--Northwestern Franklin, Southeastern Douglas, and Osage Counties in Kansas
Kansas Geological Survey
Comments to webadmin@kgs.ku.edu
Web version placed online Sept. 2, 2015. Original publication date 1995.
URL=http://www.kgs.ku.edu/Publications/Bulletins/237/Keiswetter1/index.html